A Thread Monitoring System for Multithreaded Java Programs Sewon Moon and Byeong-Mo Chang Department of Computer Science Sookmyung Women’s University, Seoul 140-742, Korea
[email protected],
[email protected]
Abstract. To assist developing robust multithreaded software, we develop a thread monitoring system for multithreaded Java programs, which can trace or monitor running threads and synchronization. We design a monitoring system which has options to select interesting threads and synchronized actions. Using this tool, programmers can monitor only interesting threads and synchronization in more details by selecting options, and can detect a deadlock. It also provides profile information after execution, which summarizes behavior of running threads and synchronized actions during execution. We implement the system based on code inlining, and presents some experimental results.
Keywords: Java, thread, synchronization, monitoring.
1
Introduction
Multithreading in Java has become widely used in modern software development. It has become popular for Java programmers to develop concurrent and reactive software like sever software using multithreading [8]. Multiple instances of one thread can be running concurrently in multithreaded programs, while a single threaded program executes one instance of a method at a time. Because there are multiple running threads in a multithreaded program, it is usually difficult for programmers to understand the behavior of the program. In addition, because multiple running threads can share resources, there can be some race conditions or deadlocks during execution which make programs more difficult to understand. So, it is important for the development of robust multithreaded programs for programmers to observe behavior of multithreaded programs more effectively. However, it is not easy for programmers to trace or monitor behaviors of multiple running threads and synchronization effectively. To assist developing robust multithreaded software, we need a tool to trace or monitor running threads and synchronized actions(methods or blocks) during execution. In this paper, we develop a dynamic thread monitoring system for multithreaded Java programs, which can trace how running threads and synchronized actions are progressing. We design a thread monitoring system, which has options to select interesting threads and synchronized actions. Using this tool, programmers can monitor only interesting threads and synchronized actions in more details by selecting options before execution, and can also detect a deadlock during execution. It also provides profile information after execution, which summarizes behavior of running threads and synchronized actions during execution. We implement the thread monitoring system based on inlined reference monitor [3] to reduce performance overhead. It is implemented in Java using Barat [1], which is a front-end for a Java compiler. We also present some experimental results, which can show the effectiveness of the system. The rest of this paper is organized as follows. The next section gives a motivating example. Section 3 describes overall design of the system, and Section 4 describes the implementation of the system. Section 5 presents some experimental results and Section 6 concludes this paper and discusses further research topics.
2
Example
We consider a multithreaded Java program in Figure 1, which is a running example of this paper. This program creates three threads, each of which synchronizes one object and then tries to synchronize an-
ACM SIGPLAN Notices
21
Vol. 41 (5), May 2006
class Deallock3thread static Object a = static Object b = static Object c = String name;
extends Thread{ new Object(); // a monitor object new Object(); // b monitor object new Object(); // c monitor object
public Deallock3thread(String name){ this.name = name; } public void run() { if(name.equals("d1") ){ synchronized(a) { System.out.println("d1 acquired a"); try { Thread.sleep(1000); } catch (InterruptedException e) {} synchronized(b) { System.out.println("d1 acquired b"); } } } else if(name.equals("d2") ){ synchronized(b) { System.out.println("d2 acquired b"); try { Thread.sleep(1000); } catch (InterruptedException e) {} synchronized(c) { System.out.println("d2 acquired c"); } } } else if(name.equals("d3") ){ synchronized(c) { System.out.println("d3 acquired c"); try { Thread.sleep(1000); } catch (InterruptedException e) {} synchronized(a) { System.out.println("d3 acquired a"); } } } } } public class Deadlock3main { public static void main(String[] args) { Deallock3thread d1 = new Deallock3thread("d1"); Deallock3thread d2 = new Deallock3thread("d2"); Deallock3thread d3 = new Deallock3thread("d3"); d1.start(); d2.start(); d3.start(); } } Fig. 1. Example program
ACM SIGPLAN Notices
22
Vol. 41 (5), May 2006
other object which has been synchronized by another thread. This will make a deadlock situation during execution.
3
Design considerations
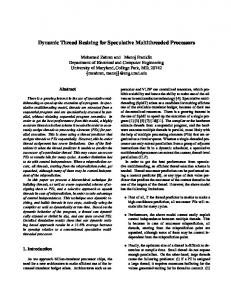
There are several ways that monitors can mediate all application operations. A traditional reference monitor is implemented by halting execution before certain machine instructions and invoking the reference monitor with the instruction as input. An alternate implementation, not limited by hardware support, runs applications inside an interpreter like JVM that executes the application code and invokes a reference monitor before each instruction. JVMPI(JVM Profiler Interface) follows this approach. However, this approach has unacceptable performance overhead [3], since a cost is incurred on every executed instruction. The third option inlines reference monitors in the target software. This approach is shown to overcome the limitations of traditional reference monitors, yet exhibits reasonable performance [3]. An inlined reference monitor is obtained by modifying an application to include the functionality of a reference monitor. As in Figure 2, IRMs are inserted into applications by a rewriter or transformer that reads a target application and a policy, and produces a secured application, whose execution monitors its execution. The inlining approach is shown to be efficient for monitoring Java programs in [3].
Fig. 2. Inlined monitor [3]
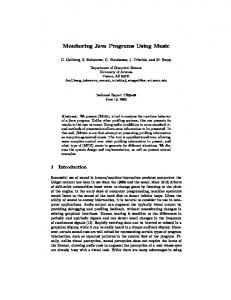
We follow the inlining approach to design a dynamic thread monitoring system for efficiency. We take the following things into consideration in the design. The first one is to provide users with options to select interesting threads and synchronized ations. By selecting options before execution, users can focus on interesting threads and synchronized actions by tracing only interesting ones in real-time. This option can also contribute in reducing performance overhead, because it makes the system to trace only interesting ones instead of all threads and synchronized actions. The second one is to provide a profile option to produce profile information after execution, which summarizes running threads and synchronized actions during execution. The third one is to reduce performance overhead. We try to reduce performance overhead by inlining code instead of using JVMPI. An input program P is transformed into a program P ′ by inlinig codes so as to trace only interesting threads according to user options. The transformed program P ′ will trace how threads and synchronized actions are started and processed during execution, and give profile information on threads and synchronization after execution. Overall architecture of the system is shown in Figure 3. This system consists of four steps as in Figure 3. The function of each step is as follows: The first step extracts constructs related to threads and synchronization by static analysis. This static information is used to provide options. The second step is option selection, where users can select interesting threads and synchronized actions using the static analysis information. Users can trace only interesting threads and synchronized actions by selecting options in this step. The third step is a program transformer, which transforms an input program P into a program P ′ by inlining codes so as to trace only interesting threads and synchronized actions according to user options.
ACM SIGPLAN Notices
23
Vol. 41 (5), May 2006
Fig. 3. System architecture
The last step is to compile and execute the transformed program P ′ . It is to be executed on Java 2 SDK or J2ME WTK.
4
Implementation
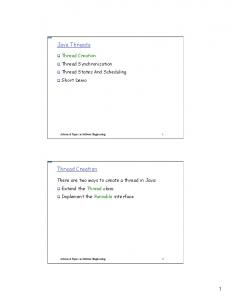
We implement the thread monitoring system in Java based on Barat [1], which is a front-end for a Java compiler. Barat builds an abstract syntax tree for an input Java program and enriches it with type and name analysis information. It also provides interfaces for traversing abstract syntax trees, based on visitor design
Fig. 4. Architecture of Barat
pattern in [4]. We can traverse AST nodes and do some actions or operations at visiting each node using a visitor, which is a tree traverse routine based on design patterns. Barat provides several visitors as basic visitors: DescendingVisitor which traverses every AST node in depth-first manner and OuputVisitor which outputs input programs by traversing AST nodes. We can develop a static analyzer by implementing visitors by extending basic visitors so as to do necessary actions or operations when visiting AST nodes [1]. As described in Figure 3, our system consists of four steps. We implement the first three steps. The last step is a execution on Java SDK. A main window for selecting options is shown in Figure 5, which shows all files in the package of a sample program. After users select files from the package, the window displays a list of threads, synchronized methods and blocks based on the static analysis information. Then, users can select only interesting ones
ACM SIGPLAN Notices
24
Vol. 41 (5), May 2006
Fig. 5. Menu window
among them. By selecting options, users can trace only interesting information and focus on interesting threads and synchronization. To provide users with options, we implement a static analyzer to extract constructs related to threads and synchronization by extending DescendingVisitor. It extracts static information about possible threads and synchronization by analyzing input programs statically. We implement a program transformer called TransformVisitor by extending OuputVisitor, which transforms an input program P into a program P ′ by inlining codes so as to trace running threads and synchronization according to selected options. It also inlines codes to trace synchronized objects and deadlocks. Figure 6 shows overall structure of the program transformer. A fragment of the transformed EzSearch program is displayed in Figure 7. This figure shows that putMessage method is a synchronized method. The codes in the box are inlined codes by the transformer, which monitor the synchronized method and store its related information during execution. The transformed program is to be executed automatically in Java 2 SDK. This transformed code traces how running threads and synchronization are progressing during execution. In addition, it can give profile information like the numbers of running threads and synchronized actions during execution.
5
Experiments
We have implemented the system with SDK 1.4.2 on Window XP on Pentium 4 processor. We first tested it with Deadlock3main in the example. When we execute the example deadlock program after transformation, we can trace progress of running threads as in Figure 8. It shows progress of running threads visually, each of which is represented as a running bar. Red color in the bar represents waiting of a thread for synchronization. For example, Figure 8 shows that all the three threads are waiting, and that one thread has synchronized an object and another is waiting for it. Figure 9 shows that a deadlock is found during execution.
ACM SIGPLAN Notices
25
Vol. 41 (5), May 2006
Class TransformVisitor extends OutputVisitor{ public void visitConcreteMethod(ConcrteMethod o) { // monitoring code for starting thread. } public void visitConstructor(Constructor o) { // monitoring code for thread name and creation. } public void visitObjectAllocation(ObjectAllocation o) { // monitoring code for creation of thread object. } public void visitInstanceMethodCall(InstanceMethodCall o) { // monitoring code for synchronized method call } public void visitBlock(Block o) { // monitoring code for inside of synchronized block } public void visitSynchronized(Synchronized o) { // monitoring code for access to synchronized block } } Fig. 6. Structure of TransformVisitor
Fig. 7. Transformed program
ACM SIGPLAN Notices
26
Vol. 41 (5), May 2006
Fig. 8. Trace of the example program
Fig. 9. Finding a deadlock
ACM SIGPLAN Notices
27
Vol. 41 (5), May 2006
When the program terminates, it profiles the numbers of running threads, synchronized method calls, and accesses to synchronized blocks. We have experimented the system with five Java benchmark programs. The first one is EzSearch, which searches files matching input patterns. The second one is Alaram, which shows time differently depending on modes. The third one is Atapplet, which withdraws from a bank account. The fourth one is the simple Read-Write program. The last one is Deadlock3main program, in which there is a deadlock during execution. Table 1 shows the number of threads, the number of running threads, the number of synchronized methods, the number of synchronized method calls, the number of synchronized blocks, and the number of accesses to synchronized blocks.
Programs
Threads Running Sync. Methods Sync. Method Sync. Blocks Sync. Block Accesses threads Calls 0 0 25 2 20 2 EzSearch 6 2 Alarm 8 23 1 8 Atapplet 1 9 1 0 1 18 6 2 5 Read-Write 13 3 8 0 3 1 0 Deadlock3main 3 3 Table 1. Experiment 1 with benchmark programs
Table 2 first shows the numbers of lines of benchmark programs before and after inlining, when all options are selected. It then shows the execution times of the programs before and after inlining. If only some options are selected, then the number of lines after inlining and the execution time are to be reduced. In Deadlock3main program, the monitoring systems detects deadlock during execution.
Programs Lines(before) Lines(after) Execution time(before) Execution time(after) EzSearch 210 245 3282 4375 21235 12172 462 Alarm 336 ATapplet 272 342 21188 33703 5719 1797 293 Read-Write 221 Deadlock3main 70 160 Deadlock Deadlock Table 2. Experiment 2 with benchmark programs
6
Related works
Dynamic program analysis techniques have been studied to provide information about actual execution [2, 6, 7, 9, 11]. Several dynamic analysis tools are developed for Java including J2ME Wireless Toolkit [7] and AdaptJ [6]. Recent J2ME Wireless Toolkit can trace method calls, exceptions and class loading as well as memory usage using JVMPI. However, it provides just the names of exceptions whenever exceptions are thrown. Moreover, JVMPI imposes heavy burden on performance overhead, which makes execution speed too slow. It is hard to trace interesting parts of programs effectively, because all codes including libraries are included in the trace. AdaptJ is a dynamic analysis tool, which gets dynamic information using JVMPI during execution and stores it as a file. It provides the dynamic information after execution. Users can select useful information from it by choosing some options.
ACM SIGPLAN Notices
28
Vol. 41 (5), May 2006
JFluid is a dynamic analysis tool recently developed at Sun Microsystems [9]. It is integrated in NetBeans IDE and shows performance data of running Java programs such as CPU, memory and threads. It instruments bytecode for monitoring right before execution. Concurrent Haskell Debugger in [11] is a debugging tool for concurrent Haskell, which can show concurrency problem like deadlock visually. In our previous work [13], a dynamic exception monitoring system was developed so as to trace handling and propagation of thrown exceptions in real-time. With this tool, programmers can examine exception handling process in more details and handle exceptions more effectively. Our thread monitoring system can show visually how running threads and synchronized actions are progressing. In particular, users can focus only on interesting threads and synchronized actions by selecting options, which can be provided with static analysis information.
7
Conclusion
We have developed a dynamic monitoring system for multithreaded Java programs, which can help programmers monitor behavior of multithreaded programs effectively. Using this system, programmers can examine progress of running thread and synchronization in more details by tracing only interesting ones. We have designed the system based on user options and inlined reference monitor. We are extending this system in two directions. The first one is to improve the execution times of the inlined programs. The second one is to visualize thread trace and profile information so as to give more insights to programmers.
Acknowledgements This Research was supported by the Sookmyung Women’s University Research Grants 2005.
References 1. B. Bokowski, Andre Spiegel. Barat A Front-End for Java. Technical Report B-98-09 December 1998. 2. B. Dufour, K. Driesen, L. Hendren and C. Verbrugge. Dynamic Metrics for Java. Proceedings of ACM OOPSLA ’03, October, 2003, Anaheim, CA. 3. U. Erlingsson, The inlined reference monitor approach to secure policy enforcement, Ph.D thesis, Cornell University, January 2004. 4. E. Gamma, R. Helm, R. Johnson and J. Vlissides, Design Patterns:Elements of Reusable Object-Oriented Software, Addison-Wesley,1995. 5. J. Gosling, B. Joy, and G. Steele, The Java Programming Language Specification, Addison-Wesley,1996. 6. AdaptJ:A Dynamic Application Profiling Toolkit for Java, http://www.sable.mcgill.ca/ bdufou1/AdaptJ 7. Sun Microsystems, J2ME Wireless Toolkit, http://java.sun.com. 8. Doug Lea, Concurrent Programming in Java(TM): Design Principles and Pattern, 2nd Edition, Addison-Wesley. 9. Sun Microsystems, Design of JFluid: A Profiling Technology and Tool Based on Dynamic Bytecode Instrumentation, 2003.11. 10. http://www.netbeans.org/ 11. Jan Christiansen, Frank Huch: Searching for deadlocks while debugging concurrent haskell programs. ICFP 2004: 28-39 12. Deepa Viswanathan, Sheng Liang: Java Virtual Machine Profiler Interface. IBM Systems Journal 39(1): 82(2000) 13. Heejung Ohe and Byeong-Mo Chang, An Exception Monitoring System for Java, Proceedings of Rapid Integration of Software Engineering, Nov. 2004, Luxembourg. Also available as LNCS 3475.
ACM SIGPLAN Notices
29
Vol. 41 (5), May 2006