Nov 27, 2012 - Keywords: eye movements, saliency model, binocular disparity, stereoscopy. 1 Introduction. The human system processes the surrounding ...
A time-dependent saliency model combining center and depth biases for 2D and 3D viewing conditions Josselin Gautier, Olivier Le Meur
To cite this version: Josselin Gautier, Olivier Le Meur. A time-dependent saliency model combining center and depth biases for 2D and 3D viewing conditions. Cognitive Computation, Springer, 2012, 4 (2), pp.141-156. .
HAL Id: hal-00757536 https://hal.inria.fr/hal-00757536 Submitted on 27 Nov 2012
HAL is a multi-disciplinary open access archive for the deposit and dissemination of scientific research documents, whether they are published or not. The documents may come from teaching and research institutions in France or abroad, or from public or private research centers.
L’archive ouverte pluridisciplinaire HAL, est destin´ee au d´epˆot et `a la diffusion de documents scientifiques de niveau recherche, publi´es ou non, ´emanant des ´etablissements d’enseignement et de recherche fran¸cais ou ´etrangers, des laboratoires publics ou priv´es.
A time-dependent saliency model combining center and depth biases for 2D and 3D viewing conditions J. Gautier (*), O. Le Meur(*) (*) University of Rennes 1, Campus Universitaire de Beaulieu, 35042 Rennes, France
Abstract The role of the binocular disparity in the deployment of visual attention is examined in this paper. To address this point, we compared eye tracking data recorded while observers viewed natural images in 2D and 3D conditions. The influence of disparity on saliency, center and depth biases is first studied. Results show that visual exploration is affected by the introduction of binocular disparity. In particular, participants tend to look first at closer areas in 3D condition, and then direct their gaze to more widespread locations. Beside this behavioral analysis, we assess the extent to which state-of-the-art models of bottom-up visual attention predict where observers looked at in both viewing conditions. To improve their ability to predict salient regions, low-level features as well as higher level foreground/background cues are examined. Results indicate that, consecutively to initial centering response, the foreground feature plays an active role in the early but also middle instants of attention deployments. Importantly, this influence is more pronounced in stereoscopic conditions. It supports the notion of a quasi-instantaneous bottom-up saliency modulated by higher figure/ground processing. Beyond depth information itself, the foreground cue might constitute an early process of “selection for action”. Finally, we propose a time-dependent computational model to predict saliency on still pictures. The proposed approach combines low-level visual features, center and depth biases. Its performance outperforms state-of-the-art models of bottom-up attention. Keywords: eye movements, saliency model, binocular disparity, stereoscopy
1 Introduction The human system processes the surrounding environment information through dedicated sensory organs. However, as we are not able to perceive our visual environment at a glance due to the overwhelming information from the visual world, exploratory eye movements are used to direct the fovea -responsible for detailed vision- to particular locations of the scene. This process is called overt attention. The deployment of visual attention involves two main mechanisms: a stimulus-dependent mechanism and an observer-dependent mechanism. The former, also called bottom-up attention is driven by low-level features (1), (2) while the latter, also called top-down attention, integrates high-level cognitive processes (task, prior knowledge) (3), (4).
1
Different computational models of overt attention have been proposed to predict where we deploy our attention on a given stimulus, through a topographic representation of visual attention: a saliency map. Most of them are based on bottom-up mechanisms and compute a predicted saliency map indicating the conspicuous parts of the incoming stimulus (1), (2). As the depth processing is known to follow the bottom-up processing in the ventral pathway, it is interesting to assess whether the depth cue is able to improve the saliency model’s performance. Indeed, for the human vision system, the problem of recovering the distance to objects and surface in a scene is ambiguous as it is inherently a light projection from a 3D-world onto a 2D retina which can be inverted in infinite number of ways. To solve this ambiguity, visual system relies on a combination of different depth cues: the monocular depth cues available from one eye, like accommodation, motion parallax, perspective, shading, etc, as well as binocular cues like convergence and binocular disparity. While most of the first cues give relative depth information on how far objects are relative to each other, the binocular cues give absolute information about the actual distance to objects. Contrary to convergence which gives distance signal with low depth resolution at short distances (up to 2 meters), the binocular disparity is useful at short and medium distances with a high discrimination of the depth thresholds (5). Depth perception thus involves a combination of multiple but possibly conflicting depth cues to estimate the 3D structure of visual scenes. There have been different suggestions to consider either the depth or the stereo disparity as individual features of a computational model of visual attention. Maki et al. (6),(7) first proposed a computational model based on image flow, depth and motion detection. The depth is used to prioritize the targets so that the closer the objects are, the higher priorities they are given. The main limitation comes from this assumption, as the closest object is not necessarily the most salient. Ouerhani et al. (8) also included the raw depth and some depth related features into Itti’s model (2). Depth was integrated as an additional feature and transformed into a conspicuity map based on center-surround mechanisms. The principle and consistency of depth integration were qualitatively illustrated. More recently Zhang et al. (9) proposed to handle the stereoscopic visual attention. The raw depth is combined with motion and static saliency map (from Itti’s model). The fusion of these three attributes with arbitrary weights is then performed. It is unfortunate that neither comparison of model’s performances with human observers nor stereoscopic perception consideration were given. Actually, one of the rare attempts to account for the stereoscopic perception is the stereo visual attention framework from Bruce and Tsotsos (10). The selective tuning model of Tsotsos has been extended to address the binocular rivalry occurring in stereo vision. Unfortunately the model’s performance was not given. Another factor that significantly influences our visual deployment is the central bias. It is often assumed that this effect results from motor biases in the saccadic system or from the central distribution of image features. However, Tatler (11) showed that the central fixation bias is irrespective of observer’s task or image features distribution. Be that as it may, the inclusion of the center bias in existing saliency models significantly increases the performances (12),(13). A first proposal to consider together the relative contributions of depth information and central bias has been done recently by Vincent et al. (14). In addition to potential high-level factors like lights and sky, the 2
foreground and central bias contributions are quantitatively studied. Results highlighted the potential role of foreground and central bias in saliency prediction. However, the contributions of these different visual features were fixed over time. Ho Phuoc et al.(15) followed a similar methodology, but to study over time the role of some low-level visual guiding factors. Following their statistical analysis of the evolution of feature weights, an adapted saliency model was proposed. The pooling of feature maps was based on a set of learned weights. However, as in Vincent (14), these weights were fixed over time. In this paper, we propose to design a time-dependent computational model of visual attention in order to predict where observers look at on still pictures for 2D and 3D conditions. The section 2 presents the materials as well as the eye tracking dataset (16). Behavioral and computational studies are presented in section 3. The fourth section describes the proposed time-dependent saliency model as well as its performances. Thus, this article aims at answering 4 questions:
Does the binocular disparity affect spatial locations of fixated areas, center and depth biases? Is the predictability of state-of-the-art bottom-up saliency models affected by stereo disparity? How to model the center and depth biases effects as individual features? How to include these features into a “time-dependent model” to predict salient regions over time?
2 Materials and methods The eye tracking dataset provided by Jansen et al. (16) is used in this paper. The experimental conditions, i.e. materials and methods to construct this database in 2D and 3D conditions, are briefly reminded here. Stereoscopic images were acquired with a stereo rig composed of two digital cameras. In addition, a 3D laser scanner was used to measure the depth information of these pairs of images. By projecting the acquired depth onto the images and finding the stereo correspondence, disparity maps were then generated. The detailed information relative to stereoscopic and depth acquisition can be found in (17). The acquisition dataset is composed of 28 stereo images of forest, undistorted, cropped to 1280x1024 pixels, rectified and converted to grayscale. A set of six stimuli was then generated from these image pairs with disparity information: 2D and 3D versions of natural, pink noise and white noise images. Our study focuses only on 2D and 3D version of natural images of forest. In 2D condition two copies of the left images were displayed on an auto stereoscopic display. In 3D condition the left and right image pair was displayed stereoscopically, introducing a binocular disparity to the 2D stimuli. The 28 stimulus sets were split-up into 3 training, 1 position calibration and 24 main experiments sets. The training stimuli were necessary to allow the participant to become familiar with the 3D display and the stimulus types. The natural 3D image of the position calibration set was used as reference image for the participants to check their 3D percept. (cited from (16))
3
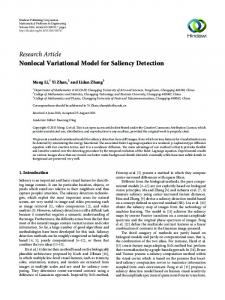
A 2 view auto stereoscopic 18.1” display (C-s 3D display from SeeReal technologies, Dresden, Germany) was used for stimuli presentation. The main advantage of this kind of display is that it does not require special eyeglasses. A tracking system adjusts the two displayed views to the user position. A beam splitter in front of the LCD panel projects all odd columns to a dedicated angle of view, and all even ones to another. Then, through the tracking system, it ensures the left eye perceives always the odd columns and the right eye the even columns whatever the viewing position. A “3D” effect introducing binocular disparity is then provided by presenting a stereo image pair interlaced vertically. In 2D condition, two identical left images are vertically interlaced. The experiment involved 14 participants. Experiment was split into two sessions, one session comprising a training followed by two presentations separated by a short break. The task involved during presentation is of importance in regards to the literature on visual attention experiments. Here, instructions were given to the subjects to study carefully the images over the whole presentation time of 20s. They were also requested to press a button once they could perceive two depth layers in the image. One subject misunderstood the task and pressed the button in all images. His data were excluded from the analysis. Finally, participants were asked to fixate a cross marker with zero disparity, i.e. on the screen plane, before each stimulus presentation. The fixation corresponding to the prefixation marker was discarded, as each observer started to look at a center fixation cross before the stimuli onset and this would biased the fixation to this region at the first fixation. An “Eyelink II” head-mounted occulometer (SR Research, Osgoode, Ontario, Canada) recorded the eye movements. The eye position was tracked on both eyes, but only the left eye data were recorded; as the stimulus on this left eye was the same in 2D and 3D condition (the left image), the binocular disparity factor was isolated and observable. Observers were placed at 60 cm from the screen. The stimuli presented subtended 34.1° horizontally and 25.9° vertically. Data with an angle less than 3.75° to the monitor frame were cropped. In the following sections, either the spatial coordinates of visual fixations or ground-truth i.e. human saliency map is used. The human saliency map is obtained by convolving a 2D fixation map with a 2D Gaussian with full-width at half-maximum (FWHM) of one degree. This process is illustrated in Figure 1.
4
Obs 1 Obs 2
Gaussian convolution
Obs 3
Obs i
Fixation map
Human saliency map
Obs N
Fixation positions for observers 1 to N
Figure 1 Illustration of the human saliency map computation from N observers
3 Behavioral and computational studies Jansen et al. (16) gave evidence that the introduction of disparity altered the basic properties of eye movement such as rate of fixation, saccade length, saccade dynamics, and fixation duration. They also showed that the presence of disparity influences the overt visual attention especially during the first seconds of viewing. Observers tend to look at closer locations at the beginning of viewing. We go further by examining four points: first we examine whether the disparity impacts the spatial locations of fixated i.e. human salient areas. Second, we investigate the mean distance between fixations and screen center, i.e. the center bias in 2D and 3D condition. The same analysis is done over the depth bias in both viewing conditions. The last question is related to the disparity influence on the of state-of-the-art models performance of bottom-up visual attention.
3.1 Do salient areas depend on the presence of binocular disparity? The area under the Receiver Operating Characteristic (ROC) curve is used to quantify the degree of similarity between 2D and 3D human saliency maps. The AUC (Area Under Curve) measure is nonparametric and is bounded by 1 and 0.5. The upper bound indicates a perfect discrimination whereas the lower bound indicates that the discrimination (or the classification) is at the chance level. The thresholded 3D human saliency map is then compared to the 2D human saliency map. For the 2D human saliency maps taken as reference, the threshold is set in order to keep 20% of the salient areas. For 3D human saliency maps, the threshold varies linearly in the range of 0 to 255. Figure 2 shows the AUC scores between these 2D and 3D human saliency maps obtained with different viewing times (the first 10 fixations (1-10), the first 20 fixations (1-20), etc). Cumulated fixations over time allow to deal with the increase of inter-observers dispersion over time and to put emphasis on salient areas due to the refixation trend over time (18). The median value is equal to 0.81 0.008 (mean ± SEM). When analyzing only the first fixations, the similarity degree is the lowest. The similarity increases from 0.68 to 0.77 in a
5
significant manner (paired t-test, p