Asia Pacific Management Review (2004) 9(3), 539-555
A Two-Dimensional Quality Model for Evaluating the Quality Attributes of Notebook Computers Lin-Lang Tang * and Su-Lin Huang** (received July 2001; revision received November 2003; accepted January 2004)
Abstract This research utilized the Kano two-dimensional model to investigate the quality attributes of notebook computer products and services in order to measure customer satisfaction in these dimensions. Data was gathering using a questionnaire. The data was then analyzed using oneway ANOVA to estimate the deviation among consumers, dealers, and manufacturers. That procedure provided a more accurate method for measuring the quality of the notebook products. Then, we used quality satisfaction indexes to evaluate the quality attributes that increased the satisfaction or decreased the dissatisfaction of the consumer providing manufacturers and dealers with an effective method to improve quality. The results indicated that the higher the customer’s satisfaction, the greater the purchase intention. Furthermore, when a nearly faultless quality factor has been provided by a manufacturer or a dealers, consumers will treat this factor as a “must-be” or “one-dimensional” quality. If a quality factor is not supported by manufacturers or dealers, the factor will be regarded as an “attractive” or “indifferent” quality factor. Keywords: Customer satisfaction; Two-dimensional quality; Quality creation; Notebook computer
1. Research Background and Purpose The information technology industry is changing more rapidly than ever before. Notebook computer products feature a short life cycle and a rapidly changing and competitive market. Manufacturers must be adaptable in this environment. Manufacturers must also be dedicated to product design and develop products that meet the demands of the customer. Therefore, customer-oriented products must be pursued and developed by R&D designers. The expectations of the customers are the key elements in determining the products’ quality. Thus, how to measure products and services becomes an important issue for the designers of notebook computers.
*
Corresponding author: Graduate School of Management, Yuan Ze University, 135 Yuan Tung Road, Chung-Li, Tao-yuan 320, Taiwan, ROC; Tel: 886-3-4638800 ext 623; Fax: 886-34630377; e-mail:
[email protected] ** Graduate School of Management, Yuan Ze University, 135 Yuan Tung Road, Chung-Li, Taoyuan 320, Taiwan, ROC. 539
Lin-Lang Tang and Su-Lin Huang
Notebook manufactures follow well-established standards to piece together hardware and software components. The major components can be purchased in a competitive global market. These components include the CPU (Central Processing Unit), housing, keyboard, memory chips, motherboards, disk drivers, monitors, modems, and connectors. Usually, the hardware in a notebook computer consists of standardized components that are purchased from specialized suppliers and assembled into a single platform by the manufacturer. Innovative technical changes are typically initiated by the component suppliers (e.g. Intel CPUs), and are often applied simultaneously by notebook computer manufacturers. Advanced CPU’s improve the quality of note- books. Furthermore, each manufacturer adds a number of brandspecific features that are unique to that platform or company including such items as pre-installed software and the operation system [21]. As a result, notebooks differ in their processing speeds, memory capacities, portability, software configurations, modem speeds, and screen sizes. Since technological advances occur at a rapid rate, the average life cycle of a notebook model is only about six months. The manufacturer upgrades the notebook when the life cycle of a notebook model ends by, incorporating newly developed features such as a new platform (i.e. family) based on a new technology (e.g. the Pentium CPU) into the notebook in order to remain competitive. Major manufacturers offer a variety of models that target different market segments. There are many brands in the current local notebook computer market. A manufacture needs an effective method to measure and manage the total quality of their products and customer service in such a competitive environment. Current measures of service quality do not adequately capture the customer's perceptions of service quality [3]. The changes in product technique and the diversification of customer requirements make it more complicated to predict customer preferences. Customer thoughts on quality are often confused and are difficult to identify. This research used the Kano twodimensional model to investigate the quality attributes of notebooks. The purposes of this study were three-fold and included: (1) Discovering the two-dimensional quality attributes of notebook computers through the questionnaire survey and analyzing the data to determine if any significant differences exist between consumers, dealers and manufacturers.
540
Asia Pacific Management Review (2004) 9(3), 539-555
(2) Using quality satisfaction indexes to discover the quality factors that improve satisfaction and decrease dissatisfaction. (3) Investigating the relationship between customer satisfaction and purchase intention. In the following sections, we will discuss the literature regarding customer satisfaction and Kano’s model. Then we will introduce the questionnaire design and sampling. Section 4 presents the survey results and explanation. The last section presents the concluding remarks. 2. Customer Satisfaction and Kano’s Model 2.1 Customer Satisfaction and Market Share Manufacturers who provide the customer with quality products and service can always be successful in this customer-oriented era. More and more firms use satisfaction ratings as an indicator of the performance of products and services, and as an indicator of the company’s future [6,7,17]. Reichheld and Sasser [20] stated that satisfied customers purchased goods and services offered by a manufacturer more frequently and in greater volume. Customer satisfaction reduces price elasticity because satisfied customers are willing to pay more for quality products and services [16]. Market share is a direct consequence of customer satisfaction and loyalty. The present or future market share of a company is composed of existing, loyal customers, and new customers that switch from other product manu- factures. The higher the customer retention rate, the higher the future marketshare [13]. High levels of perceived quality and customer satisfaction have an additional effect on future market shares due to the positive quality image and the positive word-of-mouth advertising of satisfied customers [12]. Researchers and customer relation managers have failed to deliver large numbers of loyal customers by using typical customer satisfaction measure-ment systems. The observed relationship between stated satisfaction and repeat purchase is very weak to nonexistent [17]. The degree of satisfaction, once past a critical level, cannot reliably predict repeat purchase. Increasing amounts of stated customer satisfaction beyond some threshold does not necessarily translate into increasing levels of repeat purchase. However, the relationship between stated dissatisfaction and defection is very strong and very linear. This suggests that “satisfaction” is not simply a linear continuum from very dissatisfied to very satisfied, but rather a non-linear function or two different constructs altogether.
541
Lin-Lang Tang and Su-Lin Huang
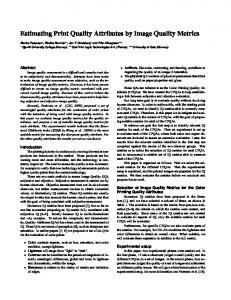
Most attitude researchers agreed that purchase intentions alone are a better and stronger predictor of behavior than attitudes [7,23]. Purchase intentions represent the perceived likelihood that a particular brand satisfaction is preceded by a high degree of intention to buy the notebook. As the quality variance across products affiliated with a brand increases, consumers’ confidence in their evaluations about the quality of a brand extension decreases [4]. Therefore, this research will investigate the relation between customer's satisfaction and purchase intention for notebook computer. 2.2 Kano’s Two-Dimensional Model Customer satisfaction has often been seen as one-dimensional – the higher the perceived product quality, the higher the customer’s satisfaction, and vice versa [6,13,17]. But fulfilling individual customer expectations to a great extent does not necessarily imply a high level of customer satisfaction. Attractive qualities can help the firm to design products that meet the potential needs of the customers [16]. Kano’s model is a method to explore quality requirements and needs of the customer [14,15]. It is also the type of expectation that defines the perceived product quality and thus customer satisfaction. To meet the diversified needs of users, Kano et al. [11] inevitably started to pay attention to the question “what to make” and then to manufacture products of original quality specifications. With the change from “how to make” to “what to make”, ‘quality management’ has also become unsuitable. Furthermore, according to him, what Kano [10] was doing now is to select the term ‘quality creation’ rather than ‘quality management’. Kano’s twodimensional model divided the quality attributes into four types, e.g. mustbe, one-dimensional, attractive and indifferent, which are shown in Figure 1 [11] and explained as below: (1) Must-be requirements: The ‘must-be’ requirements are the basic criteria of a product. If these requirements are not fulfilled, the customer will be extremely dissatisfied. On the other hand, as the customer takes these requirements for granted, their fulfillment will not increase his satisfaction. Must-be requirements are in any case a decisive competitive factor, and if they are not fulfilled, the customer will not be interested in the product at all. (2) One-dimensional requirements: With regard to theses requirements, customer satisfaction is proportional to the level of fulfillment--the 542
Asia Pacific Management Review (2004) 9(3), 539-555
higher the level of fulfillment, the higher the customer’s satisfaction, and vice versa. One-dimensional requirements are usually explicitly demanded by the customer. (3) Attractive requirements: These requirements are the product criteria which have the greatest influence on how satisfied a customer will be with a given product. Attractive requirements are neither explicitly expressed nor expected by the customer. Fulfilling these requirements leads to more than proportional satisfaction. If they are not met, however, there is no feeling of dissatisfaction. (4) Indifferent requirements: If the quality attribute cannot be classified into any of the above three catalogues, it is called the indifferent attribute. Kano’s model is used to establish the importance of individual product features for the customer’s satisfaction, and thus it creates the optimal prerequisite for the process-oriented product development activities [5,19]. To construct the questionnaire, the researchers formulated a pair of questions for each potential customer requirement for which we desired customer feed- back. Classifying customer requirements using Kano's method has the following advantages [8]: (1) The product criteria which have the greatest influence on the customer’s satisfaction can be identified, (2) Kano’s method provides valuable help in trade-off situations in the product development stage, (3) Must-be, one-dimensional and attractive requirement differ in the Customer Satisfied
One-dimensional Attractive Product Dyfunctional
Must-be
Customer Dissatisfied
543
Product Fully Functional
Lin-Lang Tang and Su-Lin Huang
Figure 1 Diagram of Kano Two-Dimensional Model utility expectations of different customer segments, and (4) Discovering and fulfilling attractive requirements creates a wide range of possibilities for differentiation. This paper intends to identify Kano categories for user requirements of notebook computers. Furthermore, we will investigate the relationship between quality attributes of product and customer's satisfaction. The customer satisfaction index indicates whether satisfaction can be increased by meeting a product requirement, or whether fulfilling this product requirement merely prevents the customer from being dissatisfied. The average impact on dissatisfaction, the must-be, and the one-dimensional columns were divided by the same normalizing factor for the calculation [1]. The customer satisfaction index is indicative of how strongly a product feature may influence satisfaction or, in the case of its non-fulfillment, customer dissatisfaction [16]. The researchers designed a questionnaire by applying Kano's twodimen- sional method. The research design is illustrated in Figure 2. The results of the quality measurement provide manufacturers and dealers with an effective method to improve the quality of service and products. In the following section, we will utilize Kano's two-dimensional model to investigate the quality attributes of note book computer and explain how product require- ments can be classified by means of a questionnaire.
Kano’s quality attributes
- Users - Dealers - Firms
Purchase intention
Customer satisfaction
Figure 2 The Research Framework
544
Asia Pacific Management Review (2004) 9(3), 539-555
3. Questionnaire Design and Interview Sample The steps followed in developing the Kano based questionnaire were: develop the questionnaire, test the questionnaire, revise if necessary, administer the questionnaire to customers, process the survey results, and analyze the survey results [22]. Notebooks are classified into four quality attributes including attractive, one-dimensional, must-be, and indifferent quality according to results from questionnaire. The key quality factors of notebooks include eight dimensions referred to in the related literature [2,9]. The questionnaire was designed using these eight dimensions: feature, safety, function, compatibility of expansion, reliability, service and reaction, communication, brand image as abstracted in the first column of Table 3. A pair of questions was formulated which the customer answered in one of five ways [11]. The examples illustrated below are the questions from Kano questionnaire regarding customer requirement for notebook computers: - If the safety design is good, (1) I like it that way. how do you feel?
(2) It must be that way. (3) I am neutral. (4) I can live with it that way. (5) I dislike it that way.
- If the safety design is poor, (1) I like it that way. how do you feel?
(2) It must be that way. (3) I am neutral. (4) I can live with it that way. (5) I dislike it that way.
The first question concerns the reaction of the customer if the product has that feature (functional form of the question); the second concerns his reaction if the product does not have that feature. Must-be, one-dimensional, attractive, as well as product requirements towards which the customer is indifferent can be classified by means of a questionnaire. In addition to the Kano questionnaire, it may be helpful to let the customers rank the
545
Lin-Lang Tang and Su-Lin Huang
individual product satisfaction by rating scale and determining the purchase intention on these brands [1]. The sample included manufacturers, retailers, and consumers. The consumer and dealer questionnaires were surveyed at computer shops located in the cities of Taipei, Hsinchu, and Tao-Yuan. Manufacturers' questionnaires were surveyed from OEM notebook computer companies. The sample included a total of 705 participants including 38 manufacturers (R & D personnel), 67 dealers, and 600 consumers. A total of 688 useable questionnaires were received from 38 firms, 66 dealers, and 584 consumers. The total effective feedback rate was 97.59%. The degree of satisfaction and purchase intention was rated using a Likert's five scales. The relationship between demographic variables and satisfaction/repurchase intention are shown in Table 1. The demographic characteristics of the sample includes 294 males (66%) and 152 females (34%). Approximately 49% of the sample fell into an age range of 21-30. Approximately 41% of respondents class themselves as service workers, while 30% of respondents class themselves as businessmen. The one-way ANOVA test was applied to test the difference between the demographic variables. The result of the satisfaction variable indicates that there is a statistically significant difference between male and female participants. The quality attributes of notebooks and the user perceptions of important factors influencing purchases include: feature, safety, function, compatibility for expansion, reliability, service and reaction, communication, brand repu- tation. These quality attributes were aggregated and tested for reliability by using Cornbach’s alpha( α ). The results of this test are presented in Table 2, where it is clear that all the extracted quality attributes satisfy the minimum recommended alpha level of 0.7 for reliability [18]. 4. Survey Results and Explanation The results of the survey were explained in three parts. First, we classified the quality factors using Kano's method and tested each factor using an analysis of variance to determine if there were any statistically significant opinions regarding quality factors among the consumers, dealers, and manufactures. Next, we defined the satisfaction/dissatisfaction indexes to explain the quality improvement items. Finally, we divided consumers into groups with distinguishing characteristics of products/services by applying Kano model, and examining whether or not the total degree of satisfaction and purchase intention were the same for the groups. 546
Asia Pacific Management Review (2004) 9(3), 539-555
Table 1 The Relationship between Demographic Variables Variable
Item
Male Female Under 20 21 - 30 Age 31 - 40 41 - 50 High school Education College Graduate Officeholder Industry Business Occupation Student Service Others Under 10,000 10,000-30,000 30,000-50,000 Monthly 50,000-70,000 income 70,000-100,000 100,000-150,000 150,000-200,000 Sex
Number of sample 294 152 3 217 195 51 71 277 98 11 67 135 47 183 3 42 166 168 47 12 6 5
Satisfaction Average F (P) value 7.06 3.16 (0.0082) 2.53 3.00 2.16 2.99 (0.0918) 2.91 2.88 2.92 2.85 2.94 (0.0587) 2.98 2.94 2.91 1.07 2.95 (0.3790) 2.96 3.00 2.95 2.93 2.94 2.95 1.44 2.96 (0.1886) 2.92 3.00 3.00
Repurchase intention Average F (P) value 2.67 1.11 (0.2926) 2.69 2.67 2.63 1.88 (0.1333) 2.66 2.68 2.60 2.74 2.64 (0.0654) 2.69 2.64 2.60 2.64 1.57 (0.1667) 2.66 2.67 2.66 2.67 2.63 2.64 0.78 2.68 (0.600) 2.67 2.67 2.60
Table 2 The Cornbach’s αof Questionnaire Fulfilling quality characters
Classification
Unfulfilling quality characters
Feature (#1, #2)
0.719
0.724
Safety (#3, #4, #5)
0.723
0.700
Function (#6, #7, #8, #9, #10)
0.754
0.871
Compatibility for expansion (#11, #12)
0.899
0.866
Reliability (#13, #14, #15, #16)
0.820
0.807
Service and reaction (#17, #18, #19, #20, #21, #22)
0.765
0.870
Communication (#23, #24, #25)
0.724
0.794
Brand reputation (#26, #27, #28) 0.814 Remark: the numbers in the brackets are the number of questions
0.799
547
Lin-Lang Tang and Su-Lin Huang
4.1 Classification of Quality Attributes for Consumers, Dealers and Manufacturers We distinguished the quality factors of notebooks separately for consumers, dealers, and firms based on the Kano model. The quality attributes of classification and test results for a total of 28 questions are shown in Table 3. To further interpret the concept among three subjects, we tested each quality factor using an analysis of variance procedure. Ten items belong to the one-dimensional quality for consumers. The two-dimensional quality has 18 items, and the must-be and indifferent qualities have 9 items each. All 28 items identified as two-dimensional quality attributes were of must-be quality. Only one item was of a one-dimensional quality for the manufacturers. The other 27 items were of the two-dimensional quality and most (10 items for deals and 9 items for manufacturers) were of must-be quality. We found that there was a statistically significant different perception between the consu- mers, dealers, and manufacturers using an ANOVA test. Column 6 in Table 3 identifies the significant variables of the quality items. Fifteen items of the quality attributes reflect the statistically significant deviations (P