then localized necking in the form of crossed intense-shear bands, and finally fracture. ..... failure process in the form of void nucleation, growth, and coa-.
Xinjian Duan1 Department of Materials Science and Engineering, McMaster University, 1280 Main Street West, Hamilton L8S 4L7, Canada
Mukesh Jain Don. R. Metzger1 Department of Mechanical Engineering, McMaster University, 1280 Main Street West, Hamilton L8S 4L7, Canada
David S. Wilkinson Department of Materials Science and Engineering, McMaster University, 1280 Main Street West, Hamilton L8S 4L7, Canada
A Unified Finite Element Approach for the Study of Postyielding Deformation Behavior of Formable Sheet Materials Deformation and fracture behavior of several formable automotive aluminum alloys and steels have been assessed experimentally at room temperature through standard uniaxial tension, plane strain tension, and hemispherical dome tests. These materials exhibit the same deformation sequence: normally uniform elongation followed by diffuse necking, then localized necking in the form of crossed intense-shear bands, and finally fracture. The difference among these alloys lies primarily with respect to the point at which damage (i.e., voiding) starts. Damage develops earlier in the steel samples, although in all cases very little damage is observed prior to the onset of shear instability. A unified finite element model has been developed to reproduce this characteristic deformation sequence. Instability is triggered by the introduction of microstructural inhomogeneities rather than through the commonly utilized Gurson-Tvergaard-Needleman damage model. The predicted specimen shape change, shear band characteristics, distribution of strain, and the fracture modes for steels and aluminum alloys are all in good agreement with the experimental observations. 关DOI: 10.1115/1.2767360兴 Keywords: localization, damage, FEM, fracture, formability
1
Introduction
Due to increasing requirements for the light weight and high strength alloys, materials such as aluminum alloys 共e.g., AA5754 and AA6111兲 and dual phase steels are seen as current or potential replacements of traditional materials such as drawing quality aluminum killed 共DQAK兲 steel in numerous applications. The formability is essentially limited by the occurrence of ductile fracture or tearing of the sheet. It is therefore desirable to develop a model that can give reasonable prediction of the ductility for both steels and aluminum alloys. Although rolled sheet metal is considered here, the methodologies for ductile failure may also be applied to other structures and components. The most widely used approach incorporates the various failure criteria into finite element codes to predict the initiation and evolution of fracture during various forming processes 关1–3兴. The failure criteria developed by Oyane et al. 关4兴, Rice and Tracey 关5兴, and Lemaitre 关6兴 are often used. Although many successful studies have been reported in the literature, these continuum based ductile failure criteria require the determination of critical failure values. Normally, a trial and error method is employed to ensure that the predicted final specimen geometry agrees with experimental observations irrespective of whether or not the first three deformation processes 共i.e., uniform elongation, diffuse necking, and localized necking兲 are followed. This is not appropriate since work in sheet metal forming indicates that the failure strain depends on the prior deformation history and strain path. It would be better to develop a finite element model, which could cover all the above 1 Present address: Atomic Energy of Canada Ltd., 2251 Speakman Drive, Mississauga, Ontario L5K 1B2, Canada. Contributed by the Pressure Vessel and Piping Division of ASME for publication in the JOURNAL OF PRESSURE VESSEL TECHNOLOGY. Manuscript received April 18, 2006; final manuscript received October 17, 2006. Review conducted by Poh-Sang Lam.
Journal of Pressure Vessel Technology
deformation processes, and to determine the critical failure parameters based on direct microstructural observations. From a microstructural viewpoint, damage is associated with the nucleation, growth, and coalescence of voids in ductile metallic materials. This sequence of damage leading to fracture depends on the size, distribution, and morphology of particles and their cohesive and/or fracture resistance. The relevant damage models in this category are due to the Gurson-Tvergaard-Needleman 共GTN兲 model 关7,8兴. These models are superior to previous methods in Refs. 关1–3兴 because 共1兲 softening due to void nucleation, growth, and coalescence is coupled with the deformation process; 共2兲 the deformation processes can be captured with reasonable accuracy; and 共3兲 a critical void volume fraction is used as a parameter to trigger the fracture process. Despite the advantage of GTN model, several issues restrict their general application, including too many parameters, imprecise physical meaning for some of parameters, and difficulty with experimental determination of the parameters. Also, because of the early introduction of void nucleation and growth during the uniform deformation stage, diffuse necking and localized necking are triggered due to the assumed existence of damage. This is contrary to many experimental observations for automotive sheet materials in which void nucleation is generally not observed until well after the formation of intense-shear bands 关9兴. In these materials, there is no evidence of void formation except very close to the fracture surface. Thus, the use of a constitutive relationship based on the GTN model is not appropriate for such materials. It has been reiterated in the literature 关10–12兴 that a classical elastic-plastic solid with a smooth yield surface and satisfying normality is resistant to localization. Most of the previously published work on the prediction of macroscopic shear localization based on the continuum finite element method 共FEM兲 has usually introduced a vertex on the yield surface, such as the J2 corner theory, to bring down the calculated critical strain at localization 关13兴. A small geometric imperfection is generally required to trig-
Copyright © 2007 by ASME
NOVEMBER 2007, Vol. 129 / 689
Downloaded 22 Oct 2007 to 209.167.89.139. Redistribution subject to ASME license or copyright, see http://www.asme.org/terms/Terms_Use.cfm
Table 1 Chemical composition of various Al–Mg aluminum alloys
AA5754-O AA6111-T4
Mg
Mn
Si
Fe
Ti
Cu
Al
3.42 0.7
0.23 —
0.05 0.66
0.08 0.06
0.01 —
— 0.69
Bal. Bal.
mation behavior under an out-of-plane biaxial condition. In hemispherical dome test, sheet specimen is firstly clamped circumferentially, and then a hemispherical punch moves to stretch the sheet to desired height. The equipment used in this study is described in an earlier work 关18兴.
ger the occurrence of localization. The predicted locations of shear bands are found to be very sensitive to the form of imperfections 关10兴. Recent numerical studies on aluminum alloys by the present authors have demonstrated that localization in sheet specimens occurring across the width of tensile specimens 共both diffuse and localized necking兲 can be predicted naturally and accurately using the most basic isotropic elastic-plastic 共von Mises兲 constitutive model for aluminum alloys 关14–16兴. The necessary conditions are the introduction of material imperfections, an appropriate representation of strain hardening rate, the element formulation, the element size, and the convergence control. Although steels and aluminum alloys have substantially different microstructures, the objective of this work is to present a unified FEM, which is capable of covering all deformation stages for both classes of automotive materials under plane stress, plane strain, and 3D deformation modes. The predicted shape change, shear band formation, strain distribution, and failure mode are closely compared with experimental observations.
2
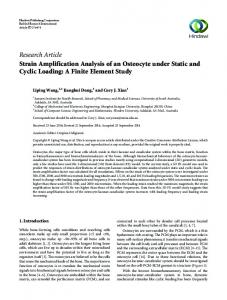
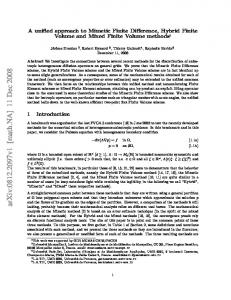
2.3 In Situ Microstructural Characterization. In situ uniaxial tension tests on polished specimens were carried out inside a scanning electron microscope 共SEM兲 to observe surface microstructure during deformation. The electropolished nonstandard AA5754 samples 共Fig. 1兲 were placed inside a Hitachi S-3500N SEM chamber and pulled axially using a built-in tensile stage with a load cell. The tests were interrupted at different strain levels; the load values were recorded along with the corresponding SEM images of the surface of the test specimens. 2.4 Optical Strain Measurements. To validate the calculated strain distribution from FE modeling, a noncontact strain mapping system, ARAMIS®, was used to measure the surface deformation. This system is based on digital image correlation techniques 关19兴. A nonstandard AA6111-T4 specimen 共see Fig. 2兲 was utilized to measure the strain distribution and its evolution with increased cross-head displacement. A very fine random speckle pattern of black pigment was applied with a spray nozzle over the gauge length of the test specimen prior to the test. A recommended facet size of 7 ⫻ 5 pixels 共equivalent to 0.245⫻ 0.175 mm2兲 was selected to capture the local strains accurately.
Experimental Procedure
2.1 Material Characterization. The chemical compositions for sheet aluminum alloys and steels are shown in Tables 1 and 2, respectively. Their mechanical properties were determined by the use of uniaxial tension tests, plane strain tests, and hemispherical dome tests. All materials were provided in the form of rolled sheet with different nominal thickness values, see Table 3. 2.2 Mechanical Test. Uniaxial tensile tests were performed on an Instron 4202/5500R electromechanical test frame with a 10 kN load cell 共except for DP600 dual phase steel, which were tested on an Instron 810 servohydraulic test frame with a 100 kN load cell兲. All samples were tested at room temperature at a nominal strain rate of 6.7⫻ 10−4 s−1. Mechanical properties in terms of yield stress 共YS兲, ultimate tensile stress 共UTS兲, average r value, elongation, and n value 共strain hardening index兲 are also shown in Table 3. In-plane plane strain tests were conducted using two specimen geometries, as reported in Refs. 关9 and 17兴. By using a large sheet specimen, the in-plane plane strain state is obtained in the rollingthickness plane or the transverse-thickness plane at the specimen center. Hemispherical dome tests were also performed to assess defor-
3
Finite Element Modeling Considerations
The focus of this work is to introduce a simplified FE approach that is capable of predicting the postyielding deformation behavior. Several commercial FE programs with finite strain formulation have been adopted. The detailed numerical formulations/ algorithms are not given, rather a brief introduction of a few important practices. In this work, we only report the results obtained from the general-purpose FE program MSC.MARC2005R2 关20兴. Four-node isoparametric arbitrary quadrilateral elements were used with full integration. Since the formation of shear bands involves significant element deformation, an assumed strain formulation was adopted to avoid shear locking and to ensure a good representation of strain gradients.
Table 2 Chemical compositions of DQAK and DP600 steels
DQAK DP600
C
Mn
Al
S
Cr
P
Si
Cu
Ni
Mo
0.041 0.07
0.19 1.84
0.037 —
0.007 0.003
0.022 0.03
0.005 0.012
0.007 0.09
0.011 0.025
0.008 0.01
⬍0.037 0.15
Table 3 Comparison of the mechanical properties
AA5754-O AA6111-T4 DQAK steel DP600
Thickness 共mm兲
YS 共MPa兲
UTS 共MPa兲
Elongation 共%兲
n value
r valuea
1.0 0.92 1.53 1.85
107 134 243 350
282 391 351 615
26.2 28 37 25.5
0.32 0.27 0.19 0.19
0.69 0.75 1.63 0.9
a Note that the average r value in this table is defined as 共r0 + 2r45 + r90兲 / 4. r0, r45, and r90 are the r values 共the ratio of the width strain to the thickness strain兲 along the rolling direction, 45 deg orientation with respect to the rolling direction and transverse direction, respectively.
690 / Vol. 129, NOVEMBER 2007
Transactions of the ASME
Downloaded 22 Oct 2007 to 209.167.89.139. Redistribution subject to ASME license or copyright, see http://www.asme.org/terms/Terms_Use.cfm
Fig. 1 Nonstandard specimen used in the in situ SEM observation. All units in millimeters.
The von Mises yield criterion together with isotropic hardening was used for aluminum alloys. For steels, Hill’s quadratic yield function 关21兴 is generally valid. 2 a1共y − z兲2 + a2共z − x兲2 + a3共x − y兲2 + 3a4zx + 3a52yz 2 + 3a6xy = 2¯2
tion pattern of these inhomogeneities can be determined according to the real distribution of the adopted textural components. Such characterization of a variety of inhomogeneities has been considered in Ref. 关14兴. Here, the study assumes 8% 共by volume兲 that each of the hard and soft phases are added to the matrix material. These regions are assigned a YS that is 2% different from the matrix, which is similar to a recent study showing that the measured strength difference between the soft texture component and the matrix was less than 1% for AA6016 关23兴. Also for AA5754-O, the measured volume fractions of cube and Goss texture components by X-ray analysis are 7% and 9%, respectively. The Oyane failure criterion is used to trigger element failure because it includes both the triaxiality 共m / ¯兲 and equivalent plastic strain ¯. Most importantly, the contribution of each factor on the fracture initiation and development can be adjusted through the weight constant B, as shown below:
冕冉 冊
共1兲
where ¯ is the equivalent YS for isotropic behavior, and ai=1–6 are constants. The inputs in the MSC.MARC include r0, r45, r90, Y 45 / Y 0, and Y 90 / Y 0, where r0, r45, and r90 are the r values 共the ratio of the width strain to the thickness strain兲 along the rolling direction, 45 deg orientation with respect to the rolling direction and transverse direction, respectively. Y 0, Y 45, and Y 90 are the YS along the rolling, 45 deg and transverse directions, respectively. Predicting the material response after diffuse necking requires the application of some special considerations in most implicitalgorithm based commercial FE programs. First of all, it is important to drive the simulation using displacement control as opposed to load control because the stiffness matrix may become singular 共nonpositive definite兲 at diffuse necking and the solution may be unstable. From a microstructural viewpoint, a precise prediction of the localized necking requires an accurate representation of both the stress and the work-hardening rate as a function of strain. In most commercial FE programs, the true-stress–plastic-strain relationship is input through a table. This means that the default workhardening rate between two data points is constant. To overcome the convergence difficulty caused by the large variation of the derived work-hardening rate, especially just before and after diffuse necking, our experience shows that at least 30 data points are required to ensure a smooth change of work-hardening rate. Unlike most previous work in which geometrical imperfections are embedded in the specimen in order to trigger localization 关22兴, randomly distributed material imperfections 共inhomogeneities兲 are used here. While there are several potential sources of inhomogeneities, here they are assumed to be due to one of the major textural components. Taking AA5754, for example, regions of cube or Goss texture would result in locally soft and hard inhomogeneities, respectively. The remaining material is called the matrix material comprised of a “random” texture. Here, each material is assumed to consist of a matrix material, having the average behavior of the alloy, plus a predetermined value for the hard and soft regions. These materials are assumed to possess the same work-hardening rate but with different flow stresses. The distribu-
¯ f
0
共2兲
where ¯ f is the equivalent plastic strain at which the failure occurs, m is the hydrostatic stress, and B and C are constants. When B = 0, m / ¯ and ¯ have the same weight on the critical value C. When B ⬎ 0, ¯ has a large contribution to the fracture initiation than m / ¯. During simulation, fracture is assumed to occur when the critical value is reached, and the element deletion technique is applied to visualize the fracture process. In other words, the contribution of particular elemental stiffness is deactivated during the assembly of global stiffness matrix once the averaged damage value exceeds the critical C value.
4
Experimental Observations
4.1 Sequence of Deformation Under Uniaxial Tension. Although aluminum alloys and steels show significantly different microstructures and stress-strain curves, we observe the same sequence of deformation under uniaxial tension: namely, uniform deformation, diffuse necking, localized necking, void nucleation, growth and coalescence, and finally fracture. This sequence of deformation is illustrated in Fig. 3. However, asymmetrical crossed bands were observed for AA5754, while the steel showed symmetrical bands 共see Fig. 4兲. The final failure modes were also different between the aluminum alloys and the two steels studied. In the longitude-transverse plane, aluminum alloys always fail diagonally with an angle greater than 54 deg to the loading direction, while steels exhibit a cup-cone mode. 4.2 Forming Limit Curves. The forming limit curve 共FLC兲 is frequently used to guide the development of dies and to analyze failures during sheet metal stamping. Figure 5 is a typical FLC, a strain space defined by major and minor true strains. Major and minor true strains refer to the maximum and minimum principle strains. The positive value means tensile strain. The negative value means compressive strain. The left side FLC indicates the strain state under uniaxial loading. For ASTM standard sheet
Fig. 2 Specimen used in the strain mapping by the millimeters. The thickness is 0.92 mm.
Journal of Pressure Vessel Technology
m ¯=C + B d ¯
ARAMIS®
for AA6111-T4. All units are in
NOVEMBER 2007, Vol. 129 / 691
Downloaded 22 Oct 2007 to 209.167.89.139. Redistribution subject to ASME license or copyright, see http://www.asme.org/terms/Terms_Use.cfm
Fig. 3 Illustrated sequence of deformation during tensile test of sheet materials: uniform deformation, diffuse necking „point A…, localized necking „point B…, and fracture „point D…
specimen, the major tensile strain is two times of minor compressive strain. For the minor strain of zero, it is called plane strain deformation. The right side FLC defines the strain state at failure under biaxial loading. The hemispherical punch stretching of sheet into a dome is usually employed to determine the FLC. Through changing the friction condition, the strain ratio varies from 0 共plane strain兲 to 1 共balanced biaxial loading兲. Although aluminum alloys show significantly higher n values than those of steels in Table 3, the forming limit strains of most aluminum alloys are inferior to those of steels. For example, a comparison between AA5754 and DP600 is shown in Fig. 5. This
Fig. 4 Experimentally observed failure modes for both steel and aluminum alloys
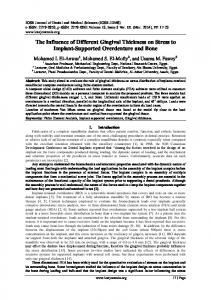
Fig. 6 Measured distribution of the von Mises strain „equivalent plastic strain… from the ARAMIS system for AA6111-T4 at the cross-head displacement of approximately 8.1 mm. This is the last image before the fracture.
indicates that use of work-hardening exponent 共or n value兲 to compare the formability of aluminum alloys and steels is not always reliable. 4.3 Strain Measurements. The optical strain measurement system, ARAMIS, was used to measure the strain distribution and evolution in AA6111 tested under uniaxial tension tests conducted at a speed of 1 mm/ min. A total of 163 images were recorded at the rate of one image every 3 s. Figure 6 shows the measured distribution of equivalent plastic strain after an applied cross-head displacement of 8.1 mm, just before fracture. The strain distribution is shown superimposed on the deformed specimen sprayed with the speckle pattern. An intense-shear band inclined at an angle of 62.9 deg to the loading direction is clearly visible, and the maximum equivalent plastic strain in the band is close to 0.6. The width of the localized band measured with an optical microscope is 1.06 mm, 15% larger than the initial thickness of 0.92 mm.
5
Simulation Results for Uniaxial Tension Tests
For a uniaxial tension test on a thin sheet material, plane stress deformation in the rolling-transverse plane is thought to lead to the formation of crossed bands prior to fracture. When the ratio of width to thickness is less than 5 共similar to the specimen described in Fig. 1兲, a 3D model is required to take into account the thickness effect. For the test using a notched wide specimen, plane strain in the rolling-thickness plane is assumed to constrain the deformation along the width direction. In the following, results from the plane stress model, plane strain model, and finally the 3D model are presented.
Fig. 5 Comparison of forming limit strains between DP600 and AA5754 sheet
692 / Vol. 129, NOVEMBER 2007
5.1 Plane Stress Deformation of AA6111. In the plane stress simulation, material inhomogeneities are randomly assigned to the elements in the FE model with a mesh size of 0.25 mm in the center region of the specimen. The predicted distribution of strain and strain rate at an applied displacement of 8.01 mm is shown in Fig. 7. Comparing Figs. 7共a兲 and 7共b兲, strain rate seems to be more suitable variable for the study of intense-shear bands. The strain rate clearly shows the boundary of loading/unloading so Transactions of the ASME
Downloaded 22 Oct 2007 to 209.167.89.139. Redistribution subject to ASME license or copyright, see http://www.asme.org/terms/Terms_Use.cfm
Fig. 7 FE predicted distribution of equivalent plastic strain „a… and the equivalent plastic strain rate „b… at an applied displacement of 8.01 mm
that the ensuing band dimensions are sharply discernible. The predicted shear band is inclined at 60 deg to the loading direction, close to the experimentally measured value of 62.9 deg. This angle varies significantly with the geometrical dimensions of the sheet specimen, particularly the width-to-thickness ratio. The distribution of equivalent plastic strain in Fig. 7共a兲 and that in Fig. 6 show good agreement in terms of both distribution pattern and the magnitude. Also, the predicted intense-shear band width measured from Fig. 7共b兲 of 1.03 mm is close to the measured band width from Fig. 6. Further, it was found that the calculated band width decreases dramatically from 1.73 mm at an applied displacement of 7.9 mm to 1.03 mm at an applied displacement of 8.01 mm as the deformation becomes increasingly localized with continued straining. The equivalent plastic strain profiles are plotted along the gauge length at different cross-head displacements in Fig. 8共a兲. The locations for the comparisons are identified in the load curves in Fig. 8共b兲. The strain profiles from FE approach 共FEA兲 are plotted from top to bottom in the specimen, as shown in Fig. 7. The profiles from measurement 共ARAMIS兲 are also plotted from the top to bottom in Fig. 6. Comparing Figs. 6 and 7, it can be seen that the starting points of the FEA and the measurement do not coincide. Therefore, offset plots are given in Fig. 8共a兲. In the mean time, the readability is improved. In Fig. 8共a兲, both the measurements and the predictions show a sharp strain increase within the intense-shear bands after localization. Before the cross-head displacement of 7.5 mm, the strain distribution in the flat part of the specimen is quite uniform. The serrations in both the predicted and measured strain profiles can be attributed to the presence of material inhomogeneities. The sharp decrease in the loads after Journal of Pressure Vessel Technology
localization is attributed to the element removal, simulating the failure process in the form of void nucleation, growth, and coalescence until fracture. In summary, the present plane stress FE model provides a very good prediction of the occurrence of intense-shear bands and the distribution and evolution of strain throughout deformation in AA6111. 5.2 Plane Stress Deformation of DQAK Steel. Plane stress model was also applied to simulate the uniaxial tension test of steel sheet specimen. Figure 9 compares the deformed specimen shapes and their corresponding load-displacement curves up to the formation of a crossed band in DQAK steel. Both experiment and prediction show an apparent specimen width reduction. This is in contrast to Al alloys in which little width reduction is observed at the onset of localization. The onset of void nucleation was experimentally determined by cutting through the crossed shear bands of several specimens and observing SEM images of the microstructure. These observations show that the intense-shear bands in steels are not a consequence of void nucleation. Conversely, it is the intense-shear band that creates local triaxiality to promote the void nucleation, growth, and coalescence. By matching the FE predicted minimum specimen width with the experimental measurement at the onset of central cavity, the critical strain for void nucleation was found to be approximately 0.81. Extensive metallurgical examinations suggested that voids nucleate after the formation of cross band for steels. The load curves in Fig. 8共b兲 already indicate the load drops dramatically after void formation 共i.e., starting of failure process兲. For the same NOVEMBER 2007, Vol. 129 / 693
Downloaded 22 Oct 2007 to 209.167.89.139. Redistribution subject to ASME license or copyright, see http://www.asme.org/terms/Terms_Use.cfm
Fig. 8 „a… Comparison of strain profiles at different deformation stages for AA6111 „b… Locations on the load curves where the FEA and the ARAMIS measurements are compared: 6.5 mm, 7.0 mm, 7.5 mm, and 8.0 mm
reason, it would be expected that the loads calculated by FEA in Fig. 9 would drop dramatically after localization. 5.3 Plane Strain Deformation of AA5754. The experimental results of plane strain test of AA5754 were extracted from Ref. 关24兴 for the purpose of validating the FE model. More details on the test conditions can be found in Ref. 关24兴. Figure 10 shows two distinct deformation stages during plane strain tension of a notched specimen. Figure 10共a兲 corresponds to the initiation of a central void while Fig. 10共b兲 represents the complete separation. Comparing this figure with optical micrographs presented in Fig. 11, a rather good prediction is obtained. Three geometric parameters, a, b, and c in Figs. 10 and 11, are compared between predictions and measurements in Table 4 to quantify the deformation features. The present FE model can quite accurately predict the occurrence of intense-shear bands and the voids appear to be nucleated at the intersection of two bands at the center of the specimen. 694 / Vol. 129, NOVEMBER 2007
Fig. 9 Comparison between the FE prediction and experimental observations for DQAK steel
Transactions of the ASME
Downloaded 22 Oct 2007 to 209.167.89.139. Redistribution subject to ASME license or copyright, see http://www.asme.org/terms/Terms_Use.cfm
Fig. 10 Predicted intense-shear bands with void in the center „a… and the final failure mode „b…. The initial notch profile is also plotted in „a…. Thickness direction is along the horizontal.
Thus, the combination of experimental observations such as the current thickness in Fig. 11 with the FE predictions in Fig. 10 can provide useful information for the determination of void nucleation conditions. The equivalent plastic strain at the cross-band intersection is 1.05 with a triaxialty m / ¯ of 1.48 for the case shown in Fig. 10. Supposing that the constant B in Eq. 共2兲 is 0, the calculated critical damage value C = 1.8. This makes it possible to predict a reasonable failure mode without considering the details of particle size and distribution, and thereby enables the simulation of more complex forming processes. 5.4 3D Model. For the in situ SEM test described in Sec. 2 in which the ratio of specimen width to thickness is 2, a threedimensional FE model has to be adopted. A significantly different localization mode appears in the form of a trough as shown in Fig. 12, and the width of the trough is similar in both the experiment and the prediction. It is clear that the specimen geometry plays a very important role in the determination of localized shape. Also noticeable is the appearance of crossed bands in the thickness section. Although over 300,000 brick elements were used in the simulation, the elements within the localized zone elongate significantly along the loading direction and result in an aspect ratio of over 2, making the elements unfavorable for the representation of intense-shear bands. It is anticipated that if more elements were used, only one band would remain in the thickness section and this inclined band would define the separation plane.
6
Discussion
The major difference between aluminum alloys and steels relates to the state of localized deformation when voids are nucleated. For steels, the damage process starts from the intersection of two intense-shear bands 共point B in Fig. 3兲, while damage can only be observed after point C for aluminum alloys. The two equations presented in Fig. 3 are detailed in Ref. 关14兴. A common observation for both steels and aluminum alloys is that there are few voids before the occurrence of shear localization. Most voids nucleate after intense deformation develops within the bands. In other words, the localization can occur without the presence of any damage, and therefore damage models should be appropriately activated according to the natural constitutive response. One of the key contributions of the present FEMs presented here is the explicit introduction of a spatially heterogeneous distribution of material properties. Although the same kind of microstrucutral information is used in the simulation for both aluminum alloys and steels, the FE model appears to distinguish the two materials in terms of the characteristics of intense-shear banding. This is due to the use of suitable empirical equations to fit the measured stress-strain relationship and to extend the relationship ¯ = ¯ at well beyond the diffuse necking point and satisfying d¯ / d the point of maximum uniform strain. The Voce equation 关25兴 in ¯ 兲, where A, B, and C are constants, the form of ¯ = A − B exp共−C
Fig. 11 SEM observations of the crossed shear bands with void nucleated at the interaction and the final failure for AA5754 with double notches at a width of 0.55 mm. Thickness direction is along the horizontal. The thickness of the unnotched part is 2.18 mm.
Journal of Pressure Vessel Technology
NOVEMBER 2007, Vol. 129 / 695
Downloaded 22 Oct 2007 to 209.167.89.139. Redistribution subject to ASME license or copyright, see http://www.asme.org/terms/Terms_Use.cfm
Table 4 Comparison between FE predictions in Fig. 10 and experimental observations in Fig. 11 for the plane strain test of notched specimen. All units are in millimeters. Dimensions
Measurement
Prediction
a b c
0.57 0.04–0.05 0.29
0.53 0.048–0.052 0.468
is used for aluminum alloys and the Hollomon equation 关26兴 in ¯ n, where K and n are constants, is used for steels the form of ¯ = K studied here. It should be noted that for some AA6xxx alloys, the Hollomon equation gives a better representation of both the stress and work-hardening rate. One practical suggestion in determining suitable stress-strain curves is to smooth the experimental data before fitting the measured curves. This is particularly important for those alloys which show inherent Piobert-Lüders 共PL兲 and Portevin–Le Chatelier 共PLC兲 instabilities. The PL phenomenon is a strain softening type of instability and is characterized by the presence of a plateau of almost constant stress after the onset of yielding. The PLC effect is a strain rate softening type of instability and manifests itself as serrations in the stress-strain during the work-hardening stage of deformation. For the simulation of postyielding behavior by the use of classical finite-strain solid elements, the calculated equivalent plastic strain and hence stresses are element size dependent. Our practice is to use an element size of two times grain size at the critical region. Such an element size is sufficient to give reasonable accuracy and to satisfy the continuum assumption from the microstructure point of view. Most commercially rolled aluminum sheet materials exhibit some degree of anisotropy, so that their yielding behavior cannot be well represented by von Mises type of isotropic yield function. More advanced yield functions such as those proposed by Barlat 关27兴 should be investigated. Nonetheless, the aforementioned measured strain distribution from ARAMIS has demonstrated the applicability of the von Mises yield function for the prediction of deformation behavior for Al–Mg sheet alloys using the present heterogeneous microstructurally based FEM. Except for the plane stress simulation of AA6111 that was carried out before experimental test 共including the strain measurements兲, other simulations were carried out after the tests. Recently, we have applied the methodology presented in the
aforementioned sections to assess the structural integrity of degraded steam generator tubes, feeder pipes/bends, and irradiated pressure tubes. Excellent pretest predictions on the failure pressure have been observed. The results will be reported as a followup of this work.
7
Conclusions
The deformation and fracture behavior of four commonly used automotive sheet materials, AA5754, AA6111, DQAK, and DP600 steels, have been experimentally assessed and analyzed by FE modeling. Although the two aluminum alloys and two steels show significantly different microstructures and formability, they exhibit the same sequence of deformation under uniaxial tension test: namely, uniform deformation, diffuse necking, localized necking, void nucleation, growth and coalescence, and finally fracture. However, the aluminum alloys and steels are at different stages of deformation localization when the voids are nucleated. For steels, the damage process starts from the intersection of two intense-shear bands, while damage can only be observed after the disappearance of one band for aluminum alloys. Typically, there may be few voids before the occurrence of shear localization and massive void nucleation occurs only after intense deformation develops within the bands. In this way, the localization can occur prior to the presence of any damage, and therefore damage models should be appropriately activated in response to local strain and triaxiality due to the natural constitutive behavior of the material. For the present FEM with spatially heterogeneous material imperfections, if appropriate strain hardening rate, true-stress–truestrain curve, and r value are input into the FE codes, a rather simple von Mises or Hill’s yield function 关21兴 can provide accurate prediction of deformation and fracture behaviors under plane stress, plane strain, and 3D deformation conditions. The combination of FE prediction and the experimental observation makes it possible to determine the critical damage parameters accurately and efficiently.
Acknowledgment The authors acknowledged the financial support of the Natural Sciences and Engineering Research Council of Canada 共NSERC兲 and General Motors of Canada Limited. They thank Dr. Yuriy Ososkov, Dr. Jidong Kang, and Dr. Kevin Spence for permission to use some their unpublished experimental data.
Fig. 12 Comparison between the predicted and observed load curves and the failure modes for AA5754. Both images are taken at the end of load-engineering strain curve.
696 / Vol. 129, NOVEMBER 2007
Transactions of the ASME
Downloaded 22 Oct 2007 to 209.167.89.139. Redistribution subject to ASME license or copyright, see http://www.asme.org/terms/Terms_Use.cfm
References 关1兴 Clift, S. E., Hartley, P., Sturgess, C. E. N., and Rowe, G. W., 1990, “Fracture Prediction in Plastic Deformation Processes,” Int. J. Mech. Sci., 32, pp. 1–17. 关2兴 Takuda, H., Mori, K., Takakura, N., and Yamaguchi, K., 2000, “Finite Element Analysis of Limit Strains in Biaxial Stretching of Sheet Metals Allowing for Ductile Fracture,” Int. J. Mech. Sci., 42, pp. 785–798. 关3兴 Duan, X., Velay, X., and Sheppard, T., 2004, “Application of Finite Element Method in the Hot Extrusion of Aluminium Alloys,” Mater. Sci. Eng., A, 369, pp. 66–75. 关4兴 Oyane, M., Sato, T., Okimoto, K., and Shima, S., 1980, “Criteria for Ductile Fracture and Their Application,” J. Mech. Work. Technol., 4, pp. 65–81. 关5兴 Rice, J. R., and Tracey, D. M., 1969, “On Ductile Enlargement of Holes in Triaxial Stress Field,” J. Mech. Phys. Solids, 17, pp. 201–217. 关6兴 Lemaitre, J., 1985, “A Continuous Damage Mechanics Model for Ductile Fracture,” ASME J. Eng. Mater. Technol., 107, pp. 83–89. 关7兴 Gurson, A. L., 1977, “Continuum Theory of Ductile Rupture by Void Nucleation and Growth: Part 1: Yield Criteria and Flow Rules for Porous Ductile Media,” ASME J. Eng. Mater. Technol., 99, pp. 2–15. 关8兴 Tvergaard, V., and Needleman, A., 1984, “Analysis of the Cup-Cone Fracture in a Round Tensile Bar,” Acta Metall., 32, pp. 157–169. 关9兴 Spencer, K., Corbin, S. F., and Lloyd, D. J., 2002, “The Influence of Iron Content on the Plane Strain Fracture Behaviour of AA 5754 Al-Mg Sheet Alloys,” Mater. Sci. Eng., A, 325, pp. 394–404. 关10兴 Needleman, A., and Tvergaard, V., 1992, “Analyses of Plastic Flow Localization in Metals,” Appl. Mech. Rev., 45, pp. S3-S18. 关11兴 Trabtafyllidis, N., Needleman, A., and Tvergaard, V., 1982, “On the Development of Shear Bands in Pure Bending,” Int. J. Solids Struct., 18, pp. 121–138. 关12兴 Abeyaratne, R., and Triantafyllidis, N., 1981, “Emergence of Shear Bands in Plane Strain,” Int. J. Solids Struct., 17, pp. 1113–1134. 关13兴 Christoffersen, J., and Hutchinson, J. W., 1979, “Class of Phenomenological Corner Theories of Plasticity,” J. Mech. Phys. Solids, 27, pp. 465–487. 关14兴 Duan, X., Jain, M., Metzger, D. R., Kang, J., Wilkinson, D. S., and Embury, J. D., 2005, “Prediction of Shear Localization During Large Deformation of a
Journal of Pressure Vessel Technology
Continuous Cast Al-Mg Sheet,” Mater. Sci. Eng., A, 394, pp. 192–203. 关15兴 Metzger, D. R., Duan, X., and Jain, M., 2005, “Numerical Simulation of Sample Scale Intense Shear Bands in Uniaxial Tension Test of Aluminum Alloys,” ASME/JSME Pressure Vessels and Piping Conference 2005 Proceeding, Paper No. PVP2005-71383. 关16兴 Duan, X., Jain, M., and Wilkinson, D. S., 2006, “Development of a Heterogeneous Microstructurally Based Finite Element Model for the Prediction of Forming Limit Diagram for Sheet Material,” Metall. Mater. Trans. A, 37, pp. 3489–3501. 关17兴 Jain, M., 2000, “Simple Test to Assess the Formability of Tailor-Welded Blanks,” Int. J. Form. Processes, 3, pp. 185–212. 关18兴 Jain, M., and Allin, J., 1994, “Analysis of Experimental Variability of Forming Limit Diagrams,” Proceedings of the 39th SAMPE Symposium, pp. 2564– 2577. 关19兴 ARAMIS 4.7, 2001, GOM mbH, Braunschweig, Germany. 关20兴 MSC.Software Corporation, 2005, MSC.Marc Volume A: Theory and User Information. 关21兴 Hill, R., 1948, “A Theory of Yielding and Plastic Flow of Anisotropic Metals,” Proc. R. Soc. London, Ser. A, 193, pp. 281–297. 关22兴 Kuroda, M., 2004, “A Phenomenological Plasticity Model Accounting for Hydrostatic Stress-Sensitivity and Vertex-Type of Effect,” Mech. Mater., 36, pp. 285–297. 关23兴 Moore, M., and Bate, P., 2002, “Microstructural Inhomogeneity and Biaxial Stretching Limits in Aluminium Alloy AA6016,” J. Mater. Process. Technol., 125–126, pp. 258–266. 关24兴 Spencer, K., Corbin, S. F., and Lloyd, D. J., 2002, “Notch Fracture Behaviour of 5754 Automotive Aluminium Alloys,” Mater. Sci. Eng., A, 332, pp. 81–90. 关25兴 Voce, E., 1948, “The Relationship between Stress and Strain for Homogeneous Deformation,” J. Inst. Met., 74, pp. 537–562. 关26兴 Hollomon, J. H., 1945, “Tensile Deformation,” Trans. AIME, 162, pp. 268– 290. 关27兴 Barlat, F., Brem, J. C., and Yoon, J. W., 2003, “Plane Stress Yield Function for Aluminum Alloy Sheets—Part 1: Theory,” Int. J. Plast., 19, pp. 1297–1319.
NOVEMBER 2007, Vol. 129 / 697
Downloaded 22 Oct 2007 to 209.167.89.139. Redistribution subject to ASME license or copyright, see http://www.asme.org/terms/Terms_Use.cfm