A User-centered Look at Glyph-based Security Visualization Anita Komlodi∗
Penny Rheingans†
Utkarsha Ayachit‡
John R. Goodall§
Amit Joshi¶
University of Maryland Baltimore County
A BSTRACT This paper presents the Intrusion Detection toolkit (IDtk), an information Visualization tool for intrusion detection (ID). IDtk was developed through a user-centered design process, in which we identified design guidelines to support ID users. ID analysts protect their networks by searching for evidence of attacks in ID system output, firewall and system logs, and other complex, textual data sources. Monitoring and analyzing these sources incurs a heavy cognitive load for analysts. The use of information visualization techniques offers a valuable addition to the toolkit of the ID analyst. Several visualization techniques for ID have been developed, but few usability or field studies have been completed to assess the needs of ID analysts and the usability and usefulness of these tools. We intended to fill this gap by applying a user-centered design process in the development and evaluation of IDtk, a 3D, glyph-based visualization tool that gives the user maximum flexibility in setting up how the visualization display represents ID data. The user can also customize whether the display is a simple, high-level overview to support monitoring, or a more complex 3D view allowing for viewing the data from multiple angles and thus supporting analysis and diagnosis. This flexibility was found crucial in our usability evaluation. In addition to describing the tool, we report the findings of our user evaluation and propose new guidelines for the design of information visualization tools for ID. Keywords: information visualization, intrusion detection, glyphs, multivariate display 1
I NTRODUCTION
Intrusion detection (ID) analysts monitor system, network, application, and intrusion detection system (IDS) output to identify attacks against their networks. IDS’s identify attacks from network logs; however they do not accurately detect intrusion attempts. On encountering a suspect event, they generate an alert and record the data that caused the alert. The analyst then has to glean through these recorded alerts and separate actual intrusions from false alarms. The rate of false positives is often considerable for most IDSs, which implies that a very small percent of the alerts generated are actually intrusive. An IDS can generate thousands of alerts a day, up to 99 percent of which are false Positives[10]. The high rate at which modern networks generate packets exacerbates this problem. The large amount of textual data ID analysts monitor naturally calls for information visualization support. The cognitive load placed on the analyst is considerable, but it may be mitigated using information visualization by taking advantage of human perceptual ∗ e-mail:
[email protected] † e-mail:
[email protected]
‡ e-mail:
[email protected] § e-mail:
[email protected] ¶ e-mail:
[email protected]
Workshop on Visualization for Computer Security October 26, Minneapolis, MN, USA 0-7803-9477-1/05/$20.00 ©2005 IEEE.
abilities to amplify cognition. Visualization allows users to interact with large, abstract data sets through graphical representations, shifting the cognitive processing burden to the human perceptual system and expanding working memory by externally representing the information in a condensed, visual form. Because vision is the highest bandwidth human sense, visualization can increase the speed and efficiency of information processing. Visualization can speed up searching by allowing users to scan graphical information in parallel. Reading textual data is a slower, serial activity. Information visualization also takes advantage of strong human pattern recognition skills - finding patterns and anomalies is one of the key elements in recognizing intrusions - and good visual representations can make these obvious to the user. Finally, information visualization encodes the data in a manipulable form that permits the user to browse and explore the data easily. Information visualization tools can represent multiple levels and views of the data allowing users to get a high-level overview of the information space, then easily drill down to lower-level details [3]. We have developed the Intrusion Detection toolkit (IDtk) as a prototype tool for visualization of ID data using a user-centered design and development methodology. The application of these methods have been severely limited in the development of previous information visualization tools for ID. IDtk provides the user with a wide range of tools to change the way the input alert or raw packet data is mapped to the glyph-based visualization. By choosing appropriate mappings, the analyst can highlight abnormalities in the data which could be true intrusion attempts. Thus, the analyst can filter true positives from false ones without having to analyze the entire dataset. In parallel with the design and development of the toolkit, we conducted a usability evaluation of IDtk to visualize ID data, including user testing and heuristic evaluation. This led to the iterative development of IDtk and the identification of several design implications. In this paper, we will introduce a task model of ID work, describe IDtk, and report findings related to design requirements for information visualization tools for ID. 2
R ELATED W ORK
Visualization for ID is an active area of research. The most common approach is to capture network topology in a graph, with systems as nodes and connections as edges. Erbacher [6, 4, 5] developed a network visualization system intended to help network administrators monitor their system in real-time. The system generates glyphbased visualizations in which all monitored systems are represented as nodes. Nodes are connected by spokes that are made dependent on the characteristics of the traffic between the nodes. However, the visual attribute mappings of the glyphs are fixed and cannot be customized by the user. Muniandy [14] describes a system in which users, machines, and other objects are represented as nodes in a graph thus showing the network topology. The user can interact with the system by filtering the data or by drilling down to the underlying data. The system uses the cyclic nature of time to display the timeline using a circle. The data can be grouped or filtered in the timeline view. Tolle and Niggemann [19] created a system that uses aggregated nodes to avoid overloading the user with information. A cluster in the graph represents a group of nodes with high inter-node traffic. Unlike most other graph-based systems, this one does not
21
seek to show the geographic locations of nodes. Instead, nodes with strong communication relations are grouped together. Scott et al. [16] use input from existing IDS sensors and display that data using glyphs in 3D space, emphasizing node and link mappings using several different node placement algorithms. One key difference in this work and ours is our system’s flexible, customizable approach to mapping data attributes to visual parameters. A few approaches organize their displays in other ways. Vert et al. [20] use spicules, spherical glyphs capable of representing up to 360 variables, to show nodes. The volume of a spicule is proportional to the perceived security fitness of the node. Each spicule has several vectors protruding from its surface that represent different attributes of the node. Girardin’s [7, 8] system visualizes intrusion data using self-organized maps and machine learning. The map is organized by similarity of events rather than by network topology. Events that are similar are close together in the display. Selforganizing maps are well suited for large datasets but they become hard to understand as the authors are still investigating the theoretical foundation of this strategy. While various visualization approaches have been proposed, user needs analysis and evaluation, and thus an understanding of the unique needs of ID analysts, are often missing. The lack of understanding of user needs creates limitations in these tools. Our user-centered design methods and iterative development ensured that IDtk addresses real-life needs of ID analysts. There as been some previous research on the 3D display of security data [1, 13]. Our work is an intellectual descendant of the former and independent of the latter. Atkinson et al. created 3D displays showing the match between network traffic and three known attack templates. Lau displays network activity plotted by local IP address, global IP address, and port number, creating a visualization which very effectively shows a number of classic attack types. Our system allows both input data and visual mappings to be more general than in either of these previous systems, resulting in a more flexible tool of potential use in detecting a wider range of attack types. 3
U SER -C ENTERED D ESIGN M ETHODOLOGY
In order to ensure the usability and effectiveness of IDtk we involved users throughout the design process. The methods included a focus group usability review with domain experts, two iterations of a usability-expert-based heuristic evaluation and a formal usability evaluation with user participation. The sample for the study was comprised of sixteen security analysts with ID expertise. By deliberately choosing a sample with diverse experience in ID, the range of viewpoints represented was increased. User interface design experts participated in the heuristic evaluation of the user interfaces. The data collection methods were selected to assess the usability of the tool using multiple types of feedback. An early prototype was demonstrated to a group of ID experts in the focus group. At this phase user interaction with the prototype was not practical and the focus group provided and ideal setting to collect feedback from multiple experts. Specific visualization usability issues and design characteristics were explored via the heuristic evaluation and a usability test of the functional IDtk prototype. Analyst interaction with the prototype helped elicit system-specific needs. Each method will be described in the following sections. 3.1
Focus Group Usability Review
A focus group with seven members of the Washington, D.C. Snort User Group (http://www.snort.org/usergroups.html) was also conducted. The session included an introduction to information visualization, an overview of the IDtk tool using static screenshots, and
22
a demo of the tool using a subset of the 1998 DARPA IDEval data. The participants were then encouraged to ask about the tool, offer their opinions, sketch out possible improvements, and discuss potential visual variable mappings. 3.2
Heuristic Evaluation
To evaluate our tool, initially we focused on inspection-based methods to ensure that basic usability principles had been applied appropriately and that no significant usability problems would hinder the users from using the tool effectively. While a variety of techniques are available, we concentrated on using a heuristic walkthrough that combines the advantages of heuristic evaluations and cognitive walkthroughs [17, 18]. Given the characteristics of this particular application, which will be used by individuals who are highly knowledgeable (as opposed to a walk-up-and-use system), the focus of the evaluation was on usability issues that would have the greatest impact on experienced performance (as opposed to firsttime usage). 3.3
Usability Testing
The procedure of the usability test started with a brief background questionnaire collecting information on the participants’ computer and ID experience. They were then asked to carry out specific tasks using the think-aloud protocol, requiring the participants to say what they were thinking and doing while carrying out the tasks [11, 15, 2]. In the first task, participants were asked to describe the data and discuss how the tool and the mapping would be used to determine rules for excluding false alarms from the dataset. In the second task, participants were asked to create at least one new mapping that would be useful in intrusion detection analysis. They were then asked to choose one of the mappings provided (including the one recently created or other ones created by previous participants) and use it to find the one actual attack present in the data of otherwise false positives. 4
I NTRUSION D ETECTION TASK F RAMEWORK ALIZATION R EQUIREMENTS
AND
V ISU -
In order to design tools to support the tasks related to ID, it is imperative to first understand how the work is accomplished. All of the participants followed a similar, high-level process model consisting of three phases: monitoring, analysis, and response. While we provide a summary here, this process is described in detail in Goodall et al. [9] and the resulting design recommendations in Komlodi et al. [12]. In the following section we summarize the steps of the ID task, followed by a brief description of the design recommendations. Phase 1: Monitoring The first phase of ID is the surveillance of the network infrastructure and resources. Analysts in this step rely on textual IDS alerts, trying to identify the true attacks in a large number of alerts. They complement the alert data with the output of other monitoring data, such as application, firewall, and network logs. From a security standpoint, these secondary systems are typically not used for detecting intrusions per se, but provide context for the analysis that takes place next. The monitoring phase of the ID task requires simple displays, with high-level overviews under flexible and powerful user control to customize to the analyst’s network environment. Simple, 2D displays can best support continuous monitoring tasks, especially when analysts have to often monitor system output from many sources at the same time. Displaying a
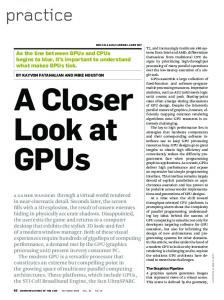
Figure 2: Interface for setting attribute mappings and interactive filtering.
Figure 1: Visualization with mappings: time - x-axis, source ip - yaxis, priority - color.
ence, knowledge of the attack, and familiarity with their operating environment.
high-level overview of the current activity in a graphical way is essential in giving analysts an overall situational awareness of their environment.
Support for the response step includes the ability to save and reuse views, keep histories of exploration and activity, and annotate alerts, which will all help analysts document and report incidents. These functions are often missing from visualization tools, although they allow users to make the transition from exploring and finding information to using and reusing this information in their work.
Phase 2: Analysis The next step of the ID task is that of analysis and diagnosis. This step is usually triggered by an alert that is deemed to signify a real attack. While monitoring involves only the display of the output from the IDS or other monitoring devices, diagnosing that output involves not only the alert artifact itself, but a host of other sources of data that provide the contextual information necessary to determine whether or not the alert is an actual intrusion and if so, how severe it is. In determining the nature and severity of the attack, analysts rely on this multitude of data sources and their knowledge of and experience with ID and their local environment. Contextual information must be combined with alert data in a complex problem-solving process. Supporting analysis is a highly interactive activity. Due to the large size of the data sets, filtering and interaction are very important functions for visualization tools for ID as a transitional mechanism from monitoring to analysis. IDtk should demonstrate flexibility in filtering by providing both a stand-alone pre-filtering tool and an integrated visual filtering mechanism. Interactivity is also important to support flexible exploration of the data set to identify trends in the data and diagnose attacks. The analysis and diagnosis of an alert cannot be accomplished without also taking into account secondary data sources that supplement the information contained in the alert itself. Phase 3: Response The third step of the ID process is response to attacks. If the results of the analysis lead to a diagnosis that the alert does indeed represent an intrusive or malicious activity, the analyst respond to the attack. The analyst must choose the most appropriate response based on prior experi-
5
ID TK T OOL D ESCRIPTION
IDtk generates glyph-based visualizations of the input data. The input data can be raw TCP packet data or alerts generated by IDS tools such as Snort. In fact, any dataset in the form of enumerated attributes can be visualized using IDtk. By mapping data variables to visual properties of the glyph, we can generate visualizations that bring out certain characteristics of the input dataset. Spatial coordinates, color, and glyph size have been traditionally used to generate glyph-based visualizations. Mapping data variables to spatial coordinates generates graph-like plots that are commonly used to understand the nature of datasets. When color mapping is used, each glyph is colored using a lookup table, based on the value of the corresponding data variable at that location. Likewise, the opacity of the glyph can be varied in proportion to the value of the corresponding data variable. When a data variable is mapped to size, the size of the glyph is varied proportionally to the value of the variable at that location. Size can be used to highlight sudden variations in the data. Since different mappings can highlight different characteristics of the dataset, flexibility in mapping is important. In IDtk, the user can choose and reuse the mappings to be used to generate visualizations. Figure 1 shows a simple visualization generated by IDtk. In Figure 1, we have mapped time to the x-axis, source IP to the y-axis and priority to color. When a data variable is mapped to any of the axes, a glyph is drawn for every item in the dataset and its spatial coordinates are determined by the values of the corresponding data variables. Thus, all alerts caused by packets sent from the same IP
23
(a)
(b)
(c)
Figure 3: Visualization with mappings: a) time - x-axis, source ip - y-axis, ip datalen - color, ip datalen - size, b) time - x-axis, source ip - y-axis, destination ip - color, priority - shape, c) time - x-axis, source ip - y-axis, priority - color with labels for protocol for items that were classified as suspicious by snort.
address have the same y coordinate. Depending on when the packet was time stamped, we may get a different x coordinate for each alert. Since priority is mapped to color, all data items with the same priority get the same color. The color used is determined based on a customizable color lookup table. Figure 2 shows the interface for setting the mappings. ”Variables” lists all the variables in the dataset. A user selects the active set of variables for mappings which are listed in ”Selected Variables”. The user can map a selected variable to an attribute by clicking and dragging the variable to an attribute. Most of the attributes have additional parameters that can be edited using the ”Settings” button. Selecting a variable in the ”Selected Variables” list displays the filtering widget which allows the user to select the range of the variable to be visualized. The user can animate the visualization using the VCR control to vary the selected filtering range for each frame and render the filtered subset. 5.1
Pre-filtering and Interactive Filtering
ID datasets can be very large. Attempting to visualize the entire dataset can result in sluggish performance. Alternatively, the analyst may not be interested in the entire dataset but only a subset of it based on time or any other data variable. IDtk provides two ways of filtering the data. Coarse filtering can be done using a stand-alone pre-filtering tool. The user can set the ranges for data variables to be used for filtering. Depending on the size of the dataset, prefiltering can be a time consuming process, so it is provided with a stand-alone interface rather than integrated in the tool. The attribute mappings dialog also provides the user with interactive filtering capabilities [Figure 2]. The user can choose data ranges for data variables to be mapped. For nominal or enumerated data variables such as protocol, user can select the individual values to be passed through the filtering stage. Since interactive filtering works on a smaller subset of data, it is less time consuming than pre-filtering. This feature is provided to give the user the ability to fine-tune the dataset to be visualized. 5.2
Shape Mapping
IDtk provides the shape of the glyph as a visual attribute. The shape of the glyph is implemented as a superquadric. A superquadric
24
is 3D object whose roundness in the longitudinal and latitudinal directions can be varied to generate shapes ranging from cube to sphere to higher order shapes that appear star-shaped. Using a superquadric permits the varying of shape continuously over the entire range of the data variable rather than using a discrete lookup table for shape. In the discrete case, there may not be any logical ordering for the shapes in the lookup table, making interpreting the visualization can be difficult. Figure 3(b) shows a visualization with priority mapped to shape. The user can clearly spot glyphs with maximum priority. 5.3
Labels
The user may want to know the exact value of any data variable for each glyph. For example, the user may want to see the protocol used for each glyph/alert but may not want to map it to any other visual attribute. In that case, IDtk can selectively label each glyph with the value of the requested data variable. There are two decisions that the user has to make when using labels, what to label each glyph with and when to label a glyph. Both can be set independently in IDtk. The user chooses the variable whose values are to be used for labeling. The user can also set a criterion for labeling by using the interactive filtering tool for the data variable mapped to labels. Only glyphs that satisfy that condition will be labeled. Thus, it is possible to label all glyphs that have been identified as suspicious with the protocol used for corresponding data item. IDtk labels only those glyphs that are not occluded and thus reduces overlap of labels or visual clutter. Figure 3(c) is the same visualization as in Figure 1, but with labels for only those glyphs that were classified by the IDS tool Snort as suspicious. 5.4
Glyph Aggregation
In glyph visualizations, glyphs are laid out in space based on the values for the data variables mapped to spatial coordinates. If two or more glyphs have the same or similar enough data values for those variables, they can coincide or overlap. This can hide some glyphs, which may have crucial data in them. Also, since all the glyphs are rendered, irrespective of the fact that they are visible or not, this can slow down the rendering process.
(a)
(b)
(c)
Figure 4: Wireframe visualization. a) with no aggregation, b) with aggregation, c) information displayed upon picking of aggregated node.
With glyph aggregation enabled, IDtk detects such overlaps and uses a single glyph to represent an aggregate of all the overlapping glyphs. Figures 4(a) and 4(b) show a wireframe representation of the visualization with aggregation disabled and enabled respectively. Note the simplification in the polygonal frame when aggregation is enabled in Figure 4(b). The aggregate glyph has data values that are an average of the constituent glyphs. Since a single glyph is rendered for all overlapping glyphs, rending speed is noticeably improved even for small datasets. In addition, IDtk keeps track of the aggregation. Hence, when the user picks on an aggregate glyph, a list of all the glyphs that are aggregated are displayed [Figure 4(b)]. Thus, the user can check the details of every component glyph. IDtk gives a user the control over enabling/disabling aggregation and modifying the aggregation threshold. The aggregation threshold is used to determine whether the glyphs are close enough to be aggregated. Enabling aggregation can also introduce a few complications. The fact that the data values for the aggregate glyph are computed by averaging those of the constituent glyphs can produce strange results. Since averages of most data variables in ID data have no real world meaning (eg. average of two IP addresses, or classifications), it is impossible to have a direct correspondence between the visual attributes of an aggregate glyph and the values of its constituent glyphs. Some alternatives would be to use the visual attributes of the aggregate glyph to display the max, median, or mode of the values of the consituent data items. 5.5
Picking
Since visual attributes do not convey the precise values of the data variables and not all variables can to be mapped to visual attributes, it becomes essential for the user to be able to drill down any particular glyph and examine its data values. Figure 4(c) shows the result of picking a glyph in IDtk. The popup dialog displays a list of all the data variables and their values for the data item corresponding to the picked glyph. 5.6
Multidimensional Color Lookup
Typically, color is mapped using a univariate lookup table, possibly generated by specifying hue, saturation, value (HSV) values at the ends and optionally, at intermediate steps. The lookup table is built by interpolating the HSV values for intermediate entries. When a data variable is mapped to color, its data range is mapped to the
Figure 5: Two-dimensional color mapping, with hue and value remaining fixed and saturation increasing along each dimension. Since opposing hues were chosen, when both dimensions have same saturation, we get a shade of grey. Mappings: X-Axis - time, Y-Axis classification, Color Dim 1- Source IP, Color Dim 2 - Destination IP. Alerts with same source and destination ip are grey - we can spot one such glyph on the Y-Axis (near the label ’classification’)
lookup table such that every data value of that variable has a corresponding color in the lookup table. We have extended this to up to three dimensions for the lookup table. The lookup table can now be thought of as a multidimensional array filled with a color at each entry. A data variable can be mapped to a dimension of the lookup table. The values of that variable are used to decide the index for color in the multidimensional lookup table. Once the index for each dimension has been identified, we can determine the color for that glyph. With multiple dimensions for the lookup table, more than one data variable can now be mapped to color. Hence, we can convey more information about the dataset through the visualization than using a single dimension lookup table. The user can specify the HSV triples for the start and end of each dimension and for intermediate points if required. The resultant color at each index in the lookup table is computed by treating the HSV triples as vectors and adding the vectors for each dimension.
25
The lookup table in Figure 5 uses this fact to generate a lookup table using opposing hues with a grey scale along the diagonal. This mapping is used to compare the source and destination addresses of alerts. Alerts with similar source and destination addresses will be colored grey, while those with addresses with greater differences will be red or cyan. Such a display emphasizes long-range traffic. 6
U SABILITY S TUDY R ESULTS
The participants in our study were enthusiastic about visualization tools for ID. Overall, the 3D glyph-based display with zooming, panning, and rotation proved to be somewhat confusing for ID analysts who often have to monitor several data sources at the same time and are rarely able to devote their full attention to one display. We identified five basic difficulties, along with solutions to address them, these will be described next: 1. The 3D display requires users to rotate and zoom the display to fully understand the data, and analysts often could not afford the effort involved in operating the 3D display. Three mouse buttons had to be used to achieve these movements and this level of physical coordination along with the mental rotation of the image proved to be too high a cognitive overload for ID analysts who had to focus on interpreting the data and not on manipulating the display. At the same time, the added dimension afforded by 3D displays were deemed useful in analysis of alerts by the participants. This points to the need for multiple simultaneous views of the same or related data to support monitoring. Our system does offer simpler, 2D displays, which seems to be a better solution for the monitoring phase. 2. Zooming, rotation, and panning are operated via three mouse buttons. Originally the rotation function was tied to the left mouse button, which was confusing to users as this is the button that is the most-often used button. Participants often pushed this button in error to select data or to zoom and were confused when the display rotated instead. This seemingly uncontrollable rotation overwhelmed users, especially in the early stages of use. Switching zooming to the left button and rotation to the right button improved the manipulation of the display. 3. Users often got lost in the 3D display by over-zooming or over-panning, a typical problem of 3D spaces. In these cases they tried to return to their earlier position often over-zooming or over-rotating again, which made the situation worse. Three different solutions were created to help this problem. First, an overview of the visualization space was added that showed the camera angle and the three axes in the camera view. This helped users understand where they were in the 3D space. Users could also reset the zooming ratio to get the data display back into the camera view at one click. The same functionality was built in to help with over-rotation. Orthogonal XY, YZ, and YX views are available to users. These ?home? functions made it easier to return to previous positions while the overview helped with understanding the overall position. 4. Users experienced disorientation when the axes were out of view. The usability studies point to the necessity of transparent gridlines or other visual aids to help users anchor their view. Users also had problems with the size of the labels on the axes which were at times to small to read and other times disappeared from view. 5. As panning, rotation, and zooming was difficult for users, they exerted much effort to achieve a satisfactory view. They
26
wanted to be able to save views in a history and to mark certain views as default views to which they could return. For this, they expressed a need to separate the data from a view; that is to be able to link certain data variables to specific visualization attributes, select a rotation and zoom setting, and save this as a named view that they can apply to new datasets. In addition, they wanted to take snapshot pictures of certain views to share with colleagues and include in reports of attacks. In addition, usability problems were identified with the filtering screen and with the setup of the 3D display. The mechanics of the attribute selection and tying data attributes to visualization features were initially confusing for users. These were later revised to more closely resemble standard graphical user interface interaction mechanisms (i.e. double-clicking for selection). The selection of ranges for nominal variables was clear, however, participants had problems with the trapezoid-shaped selection tool. This tool filtered randomly from the data at both ends of the selected range which was not acceptable for ID monitoring. Another request frequently voiced by participants is the ability to select multiple ranges from the data to be included in the visualization, for example, two different time slices. 7
S AMPLE S CENARIOS
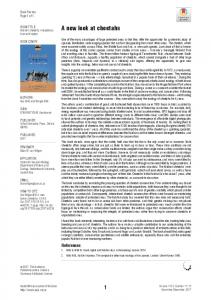
An important question for IDtk was the definition of appropriate mappings between data attributes and visualization features. In IDtk, these are user-adjustable and can be interactively updated. Participants were asked about combinations of three data attributes to map to the axes of the 3D display. While the popular mappings are specific to 3D visualization, the combinations of attributes visualized together can be informative for other visualization designs in this domain. The following combinations proved to be popular mappings: 1. Destination IP, Classification of alert, Time 2. Source IP, Destination IP, Classification of alert 3. Source IP, Destination IP, Time 4. Source IP, Destination IP, Destination Port Destination IP is the address of the targeted machine on the analyst’s network. Each alert has a certain abstract classification that helps the analyst recognize the type of attack without worrying about the specific details. Source IP is the address of the attacking machine and destination port represents the targeted machines particular service. Each of these mappings serves a different purpose in the analysts’ toolkit. For example, mapping 1 will reveal if a particular local server is repeatedly generating alerts of the same classification. This will inform the analyst that this server may have a certain vulnerability associated with that kind of alert. In the screenshot [Figure 6(a)] of this mapping, it is immediately recognizable that there are several servers (on the y-axis) generating the same class of alerts at different times. The vertical clusters of red glyphs indicate a serious type of attack directed at several different servers. These repeated alerts of the same classification targeted at the same machines could be indicative of a machine that is vulnerable to a certain kind of attack or an IDS signature that is prone to false positives. After drilling down to the detailed view, an analyst could determine which of these two conclusions is correct, and, if necessary, tune the IDS signatures to decrease the number of false positives. Viewing these alerts serially, as they are generated, would make these relationships difficult to determine without relying heavily on the short-term memory of the analyst.
(a)
(b)
Figure 6: Two mappings from focus group. a) Mapping 1: Destination IP, Classification of alert, Time, b) Mapping2: Source IP, Destination IP, Classification of alert.
Mappings 2 and 3 will reveal relationships between attacking machines and local servers along either alert similarity or time. Mapping 2 [Figure 6(b)] reveals four clusters, each representing a source/destination combination, with two groupings along a single dimension. Along the vertical center of the screen, one machine is attacking several different targets. Along the horizontal center, there are several attackers targeting one destination. Both of these relationships, especially in conjunction with a third dimension of time or classification, tell the analyst a great deal about the local servers and the attacking machines. A single source address, or attacker, generating alerts against multiple hosts on the local network may be indicative of ”doorknob rattling,” an attacker searching the network for vulnerable machines. Multiple sources against a single local server may indicate a vulnerable server that is in need of patching or reconfiguration. Adding a time dimension, as in mapping 3, can increase the likelihood of detecting multi-stage attacks. Just like in a robbery, an attacker will typically first do reconnaissance looking for weak points (e.g., portscans), then break in (e.g., gain user-level access), and finally steal the valuables (e.g., attain privileged administrator status). This progression of events is difficult to mentally correlate when examining textual files, but can be quickly and easily grasped through visualizing the necessary data attributes together. The fourth popular mapping will easily reveal relationships between attacking machines and particular services on the servers. For example, a clustering around port 80, commonly used for web services, only around a small number of local servers that actually are web servers, it may mean that the attacker has already done reconnaissance and knows which machines to target. All of these mappings provide a quick means of situational awareness, while also providing the analysts with easy to interpret displays that can help them increase the security and improve their IDS signatures on their network. In this way, the visualization can be used for realtime ID, and for post-hoc analysis that aids the analyst in finding vulnerable points in their infrastructure and tune their IDS signature set.
In all of our sessions, the color of the glyph was mapped to the priority of the alert. Participants built on color conventions in both everyday life and existing ID tools: red for high priority alerts (danger) and green for low priority alerts. When monitoring multiple displays, red glyphs will stand out and attract attention. Time is unique among the data attributes; it is one of the most important aspects of ID data. There was almost unanimous agreement that time should either be mapped to an axis or used for animation. Several different aspects of time were brought up: a snapshot in time (e.g., 1.30pm on 7.11.03), or a time interval (such as the past thirty minutes, like a sliding window for real-time analysis). 8
C ONCLUSIONS
The IDtk prototype we developed demonstrates the potential utility of applying information visualization to the ID domain. IDtk provides a great deal of flexibility and customization, which our initial user-needs assessment and subsequent usability testing confirmed to be very important in this domain. Because ID analysts have their own style of work and operate on their own unique networks, this flexibility is crucial to the success of the tool. Our initial user-needs assessment revealed multiple phases of ID with different requirements. While monitoring tasks requires simple displays, the analysis tasks can accommodate and take advantage of a more complex visual display. Due to a flexible design, IDtk can accommodate both requirements. It can be used as a 2D display, which is ideal for the monitoring task, and used in analysis as a 3D display, allowing greater insight into the multidimensional relationships in the data. By providing multiple filtering mechanisms, a coarse prefiltering and interactive visual filtering, and through the flexible aggregation mechanism, the enormous size of ID data sets are easily managed. The use of color, opacity, and shape add dimensionality to the display, but can be left unused when simpler displays are required. This is the kind of flexibility that makes IDtk useful for a not only a wide-range of analysts, but also for the different ID-related
27
tasks analysts need visual support tools to accomplish. The heuristic evaluation, focus group, and usability testing revealed several weaknesses in the prototype. These evaluative techniques fed back into the design process to iteratively increase the functionality and tailor the tool to actual needs of a range of IDrelated tasks. Our research also identified other avenues to increase the functionality of an ID visualization. These include the integration of multiple, correlated data sources and views, and tools tailored towards the response task, such as automatically displaying historical data for similar alerts and the ability to annotate alert data. Because the ID domain is complex, requiring a great deal of knowledge and experience on the part of the analysts, IDtk leverages the the ID analyst’s understanding of the domain, particularly through the customizable mappings. Thus, IDtk draws on both the strengths of information visualization and on the domain-related knowledge of the human analysts operating the tool. 9
ACKNOWLEDGEMENTS
This work supported by the Department of Defense under the LUCITE program. R EFERENCES [1] T. Atkinson, K. Pensy, C. Nicholas, D. Ebert, R. Atkinson, and C. Morris. Case study: Visualization and information retrieval techniques for network intrusion detection. In VisSym 2001: Joint Eurographics - IEEE TCCG Symposium on Visualization, 2001. [2] T. Beer, T. Anodenko, and A. Sears. A pair of techniques for effective interface evaluation: Cognitive walkthroughs and think-aloud evaluations. In Proceedings of the Human Factors and Ergonomics Society 41st. Annual Meeting, pages 380–384, 1997. [3] S. K. Card, J. D. Mackinlay, and B. Shneiderman. Information visualization: Using vision to think. Morgan Kaufman Publishers, San Francisco, CA, USA, 1999. [4] Robert F. Erbacher. Visual behaviour characterization for intrusion detection in large scale systems. In Proceedings of the IASTED International Conference on Visualization, Imaging, and Image Processing, pages 54–59, 2001. [5] Robert F. Erbacher. Visual traffic monitoring and evaluation. In Proceedings of the Conference on Internet Performance and Control of Network Systems II, pages 153–160, 2001. [6] Robert F. Erbacher. Glyph-based generic network visualization. In Proceedings of the SPIE 2000 Conference on Visualization and Data Analysis, pages 228–237, 2002. [7] L. Girardin. An eye on network intruder- administrator shootouts. In Proceedings of the Workshop on Intrusion Detection and Network Monitoring (ID’99), pages 19–28, 1999. [8] L. Girardin and D. Brodbeck. A visual approach for monitoring logs. In Proceedings of the 12th Usenix System Administration conference, pages 299–308, 1998. [9] John R. Goodall, Wayne G. Lutters, and Anita Komlodi. The work of intrusion detection: Rethinking the role of security analysts. In Proceedings of the Americas Conference on Information Systems (AMCIS), pages 1421–1427, 2004. [10] K. Julisch. Clustering intrusion detection alarms to support root cause analysis. ACM Transactions on Information and System Security, 6(4):443–471, 2003. [11] C. Karat, R. Campbell, and T. Fiegel. Comparison of empirical testing and walkthrough methods in user interface evaluation. In Proceedings of the ACM Conference on Human Factors in Computing Systems (CHI), pages 397–404, 1992. [12] Anita Komlodi, John R. Goodall, and Wayne G. Lutters. An information visualization framework for intrusion detection. In Extended Abstracts of the ACM Conference on Human Factors in Computing Systems (CHI), pages 1743–1746, 2004.
28
[13] S. Lau. The spinning cube of potential doom. Communications of the ACM, 47(6):25–26, 1997. [14] K. Mundiandy. Case study: Visualizing time related events for intrusion detection. In Proceedings of the IEEE Symposium on Information Visualization 2001, pages 22–23, 2001. [15] J. Nielsen. Evaluating the thinking aloud technique for use by computer scientists. In R. Hartson and D. Hix, editors, Human-computer interaction volume 3, pages 69–82. Ablex Publishing Corporation, Norwood, NJ, 1992. [16] C. Scott, K. Nyarko, T. Capers, and J. Ladeji-Osias. Network intrusion visualization with niva, an intrusion detection visual and haptic analyzer. Information Visualization, 2(2):82–94, 2003. [17] A. Sears. Heuristic walkthroughs: Finding the problems without the noise. International Journal of Human-Computer Interaction, 9(3), 1997. [18] A. Sears and D. Hess. Cognitive walkthroughs: Understanding the effect of task description detail on evaluator performance. International Journal of Human-Computer Interaction, 11(3):185–200, 1999. [19] J. Tolle and O. Niggemann. Supporting intrusion detection by graph clustering and graph drawing. In Proceedings of the Third International Workshop on Recent Advances in Intrusion Detection (RAID 2000), 2000. [20] G. Vert, D. A. Frincke, and J. C. McConnell. A visual mathematical model for intrusion detection. In Proceedings of the 21st National Information Systems Security Conference, 1998. [21] W. Yurcik, J. Barlow, K. Lakkaraju, and M. Haberman. Two visual computer network security monitoring tools incorporating operator interface requirements. In CHI Workshop on HCI and Security Systems, 2003.