2014 IEEE Online Conference on Green Communications (OnlineGreenComm)
A User-Centric System Architecture for Residential Energy Consumption Reduction Nikolaos Vastardis∗ , Mounir Adjrad† , Kathryn Buchanan‡ , Zhining Liao† , Christian Koch† , Riccardo Russo‡ , Kun Yang∗ , Mohammad Ghavami† , Ben Anderson§ , Sandra Dudley† ∗ School
of Computer Science & Electronics Engineering, University of Essex Colchester, UK Email: {nvasta,kunyang}@essex.ac.uk, † Department of Engineering and Design, London South Bank University, 103 Borough Road, London, UK Email: {adjradm,liaoz,christk3,ghavamim,dudleyms}@lsbu.ac.uk ‡ Department of Psychology, University of Essex Colchester, UK Email: {kbucha,rrusso}@essex.ac.uk, § Sustainable Energy Research Group, University of Southampton, Highfield, Southampton, UK, Email:
[email protected] energy reduction within the house, while retaining desirable comfort levels. Smart metering and intelligent agent applications are promoted to help the grid understand customer energy consumption patterns. This one-way information flow, although useful, does not necessarily empower customers to change habits and reduce their energy expenditure. Real-time interaction and end-user feedback on energy consumption within a dwelling is a necessary step towards inducing more energy conservative behaviour. However, positive changes in energyrelated behaviours are rarely maintained at long-term followup [3]. Thus, it is vital that any intervention aimed at these behaviours supports them in a way that makes behavioural changes persistent in the long term. It is crucial that any feedback users receive on their energy consumption, not only indicates the extent to which energy consumption changes over a period of time, but also provides information on 1) monetary cost/savings to the user over a time period, 2) the proportion of energy used by each appliance (with the relative costs) and 3) comparison with prior consumption by users over comparable time periods [4]. Hence, any feedback or action taken should be tailored to provide information on where and when changes can be made. Energy reduction targets set prior to the intervention have been shown to produce a greater chance of long-term persistence of positive energy-related, newly acquired behaviours [5]. However, given the difficulty in achieving long-term energy-related behavioural changes, it may be beneficial to install systems that not only routinely extract useful data on energy consumption, but also implement changes in the use of some appliances or utilities to reduce or alter energy use profiles. By doing so, users will only need to minimally interact with the system. Given the difficulty of retaining longterm changes in energy-related behaviours (Fallback Effect), if behavioural changes required to improve energy use are minimal, then it may be that intervention is more likely to succeed in the long term reduction of energy use [6]. Consequently, Information and Communications Technology (ICT) and networked systems, which not only extract
Abstract—Long-term energy consumption reduction can be achieved more readily through sensible cooperation between end users and technological advancements. The DANCER project presented here proposes a user-centric residential energy management system, with the intention to achieve long-term energy related behavioural changes, thus improving the energy efficiency of modern homes. Although, it follows the same basic principles as other contemporary approaches, it focuses on minimizing the interaction of the user with the system. This is achieved through an improved feedback mechanism and a generic, policy based service that takes advantage of the modularity and generality of the software architecture. The proposed system is designed to support a variety of technologies (WiFi, Zigbee, X10), in order to ameliorate the input and output of the decision making operation. In this paper, the general outline of the DANCER system architecture and its most important components are discussed and the prototype test-bed is presented. Special consideration is given to the implementation, operation and response behaviour of the prototype. Index Terms—Energy Reduction, Smart Gateway, Sensors, Smart Metering, Policy Engine, System Architecture.
I. I NTRODUCTION HE Department of Energy and Climate Change (DECC) statistics show that 50% of UK carbon emissions are from buildings; of which, two-thirds come from dwellings. In 2011 alone, residential sector emissions rose by 13.4% [1]. Building regulations legislation (Part L and the Code for Sustainable homes) have tried to address the problem, but post-occupancy evaluations continue to reveal that actual energy consumption exceeds design with the main reason for this disconnect given as occupant behaviour [2]. Hence, the need to implement approaches to induce longlasting less energy consumptive behaviours is paramount. While from the above data it may be inferred that people may not necessarily want to reduce energy consumption, nevertheless energy users’ aspire to reduce their energy bills, and less energy consumptive behaviours are germane to this. The presented Digital Agent Networking for Customer Energy Reduction (DANCER) project aims to develop a system that leads to long lasting behaviours which are associated to the
T
978-1-4799-7384-2/14/$31.00 ©2014 IEEE
1
2014 IEEE Online Conference on Green Communications (OnlineGreenComm)
useful power consumption data to provide end-user feedback but also support and where appropriate take decisions within the home, may be crucial in reducing energy costs. DANCER employs a suitable system architecture, algorithms and associated hardware, fronted by easy to use displays which will not only enable the end user to view their domestic energy/financial costs but also give them more control over their consumption. For example, a user could input that they want to use 20% less energy in their home over a given period and via DANCER their house would “decide” how to achieve this based on the previously detected user’s habits.
target technology of this work however is the ZigBee standard, also considered by the UK government for the mass roll-out of smart meters [14]. All the above proposals however, lack a user-centric perspective, as well as a focus on the energy consumption behaviours and practices. As previously stated, the prime goal of the DANCER project is to have a permanent effect on the users’ behaviour. Various studies have examined the ways information is presented to the users and how this affects their subsequent decisions. Up to now, home energy management revolved around thermostats, whether manual or programmable. Residential thermostats control 9% of the total energy consumption in US. Additionally, 97% of households have a heating system, while 75% airconditioning. Peffer et al. [15] discovered that people usually find programmable thermostats difficult to use. The key to improving building management is to provide users with faster system responses, improving access to thermostat by moving it’s functionality to existing interfaces (e.g., PC, smart phones), improving feedback and introducing an intelligent system that involves automation. However, it is important to note that one size does not fit all. As far as the feedback is concerned, there has also been considerable research on which kind is more successful. This is a tricky issue, as energy is invisible and does not comprise an important share of the household costs. On average, households spent the equivalent of 5.1% of their income on household energy in 2012 [16]. Fisher [17], after examining five review studies presenting feedback over the past 20 years, defined the features of an efficiency feedback: • Based on actual consumption • Given frequently (ideally, daily or more) • Involve interaction and choice for households • Involve appliance-specific breakdown • Given over a longer period • Involve historical or normative comparisons (although the effects are less clear) • Be presented in an understandable and appealing way Attempts to follow the above findings resulted in the introduction of smart phone applications into energy management systems. Weiss et al. [7], proposed such a system where a mobile application is connected to a smart meter through a HG. At the same time, user studies were performed to identify the most suitable information to be presented. The most important aspects were found to be the prominent energy guzzlers and the real time view of the entire consumption. Although not taken into account in any of the previously mentioned works, security also plays a crucial role in the deployment of resilient HEMSs and is considered one of the most critical requirements [18]. In a case study for Germany, Bartsh [19] suggested that the smart meter systems should follow three principles: 1) Data Minimization, 2) Transparency and 3) Empowerment of the individual. More specifically, in order to allow authentication of users, devices and applications, Vaidya et al. [20] proposed a novel mechanism based on the elliptic curve cryptography. Again, in this approach the HG is the core component.
II. R ELATED W ORK DANCER is part of a larger effort in the UK to transform the energy demand management and introduce smart Home/Building Energy Management Systems (HEMSs/BEMSs). This has led to the establishment of networks such as the EPSRC1 funded TEDDINET2 , currently comprised of DANCER and 21 other individual projects. The goal of TEDDINET is to ensure a strong legacy of its outputs and findings. The same interest is of course shared by the EU, the US and many other countries around the globe. After all, the residential sector alone is responsible for the 37% of electricity end use in the U.S. and 29% in the EU [7]. The European FP7 project BEAMS [8] proposes the flexible OGEMA energy middle-ware that supports easy integration in various kinds of facilities. The open-source community has also displayed interest in smart energy grids. An example is the OpenADR demand-response protocol [9]. OpenADR is proposed to be used complementary to the Smart Energy Profile, extending the grid communications to residences. Home Gateways (HGs) are a core component in the investigated HEMS, and as such, they have drawn an extensive amount of interest. Standardization efforts such as the Home Gateway Initiative (HGI)3 have already yielded products available in the market. A home network comprises of a wide variety of diverse devices. This necessitates emergence of HGs that are able to connect these devices together, handle different quantitative and qualitative data, enable trouble-shooting and provide improved manageability. Existing devices are usually targeted on specific technologies. Hence, new proposals should approach the issue through an appropriate design philosophy, management strategy, and smart considerations for total solutions [10]. It is only natural that the latest research in the area focuses on interoperability and user interfacing. For example, Bjelica et al. [11] presented a 6LoWPAN enabled gateway with UPnP support. The UI suggested is a cloud-based application that communicates with the GW via XML messages. In a similar approach, Arnold et al. [12] proposed an OSGi4 based HG supporting OpenADR. The OSGi framework is frequently found in the literature such as in [13] by Ha. OSGI allows new services to be developed and deployed on runtime. The 1 http://www.epsrc.ac.uk/Pages/default.aspx 2 http://teddinet.org/ 3 http://www.homegatewayinitiative.org/ 4 http://www.osgi.org/Main/HomePage
2
2014 IEEE Online Conference on Green Communications (OnlineGreenComm)
Fig. 1. High level architecture and working flow of the DANCER system.
Fig. 2. The software and network component diagram of DANCER.
It is clear that the area of HEMSs/BEMSs is quite diverse, but the current research can be used to identify the major requirements for the development of the future energy management systems: interoperability, manageability, ease of use, intelligence, efficient feedback, and security. As no current proposal is able to offer such a solution, DANCER is a step towards this goal by developing, pervasive ICT system that automatically monitors and reduces energy consumption in the home with minimal user input. Although the DANCER system is aimed at energy management in the home, in principle it could be extended to larger and more complex conditions (e.g. offices and shops).
Smart and legacy appliances, UWB platforms, user interface and Heating, Ventilation, Air-Conditioning (HVAC) devices are amongst some prime examples. In addition, energy management services cannot have a priori knowledge of the available network devices. Consequently, interoperability is a key objective. In DANCER, a control API has been introduced in the HG to mask all implementation details from the services running on top. It is responsible for manipulating the local databases and controlling the connected devices through a set of dynamic actions. Thus, the API provides a generic pool of resources on the running services and controls the authorization procedure. The HG is also connected via a Virtual Private Connection (VPN) to a public service, which provides access to the RECAP services over the internet. This allows the user to connect to the system remotely, but also allows an automated behavioural pattern extraction mechanism that does not waste the limited resources of the HG. In the following subsections, the four most important components of the DANCER system will be described in more detail. The focus on these components is intentional, since their introduction distinguishes DANCER from the previous approaches described in Section II.
III. DANCER OVERALL S YSTEM A RCHITECTURE The high level working flow of the DANCER architecture is depicted in Figure 1. At its core is the Local Energy Saving Decision Making Agent (LESDMA). This is located in the HG, which receives data from the end-users energy use preferences, the derived users’ behaviour patterns and the advanced Ulta-wideband (UWB) adapted sensors. LESDMA then makes decisions and adjusts energy consumption in areas not being used throughout the dwelling. End-users receive feedback on their energy consumption, costs and carbon footprint and can set or modify desired energy reduction targets via their Visual Information Display (VID). The DANCER system, via the LESDMA, connects to a Remote Energy Consumption Amalgamation Point (RECAP). RECAP stores/aggregates each household’s energy consumption information in a centralised, secure database. Further energy saving interventions can be derived from these data and fed back to LESDMA for actions that may impact global (rather than local) energy optimisation. For a more detailed examination of the software and network components of the system, Figure 2 is presented. It demonstrates the two core principles of the system design, modularity and generality. As pointed out in Section II, the home network comprises of a variety of diverse devices.
A. User Behaviour Extraction and Prediction A key advantage of the DANCER architecture is that it collects data about users energy consumption behaviours and occupancy. Such data is valuable and has considerable scope. Firstly, it can used to further enhance the performance of DANCER by identifying energy conservation opportunities that are tailored to each individual household. For instance, it might be apparent from the data that the heating is on and reaches the required temperature some time before the occupants need it, either because they are out of the house or still in bed. Such information can either be fed back to users via the VID or directly in to the LESDMA so that an appropriate and relevant policy could be implemented.
3
2014 IEEE Online Conference on Green Communications (OnlineGreenComm)
Aside, from enhancing the internal performance of DANCER, the data collected may also be useful to a broad spectrum of external agents, providing of course end-users consent to their data being shared. This is because the data can be used to gain insight into how people use buildings and consume energy. Evidently, such knowledge can be informative for engineers looking to design efficient buildings, psychologists wishing to derive energy reduction interventions, energy suppliers looking to incentivise load shifting and policy makers aiming to reduce carbon emissions in line with legally binding carbon budgets [21]. Most residential energy-monitoring projects and energy providers, are interested in acquiring usage data and behavioural patterns. Even though this information is usually made available to the respective users, to the best of our knowledge, it has never been used to optimize the energy consumption in an automated way. Such a mechanism is considered in DANCER, although initially with a limited scope. After all, performing tasks without a prior user authorization could be considered as intrusive. Initially a supervised pattern recognition operation will be performed on the gathered monitoring data, in order to better understand the dynamics and energy-saving opportunities. Afterwards, the methodology can be ported onto a centralized service running a genetic algorithm (or another artificial intelligence mechanism) over the real time data. The output can then be translated into a set of policies that update the LESDMA behaviour.
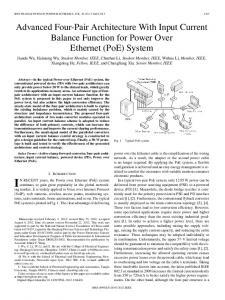
In return, the server responds with error or reply messages, containing the output of the requested operation, whether that relates to context manipulation or calling an action. The employed messaging scheme supports apart from simple requestreply connections, the publish-subscribe paradigm. This allows a much higher flexibility, as local and remote services can possibly subscribe to information that are considered to be of interest. A prime example is the LESDMA component of the HG, that operates as a policy engine based on context changes. Furthermore, the implementation of a demand-response system becomes quite straight-forward as it enables the easy request exchange with the capability of technology-independent automated device control. C. Advanced UWB-based Sensing UWB is one of the most promising technologies for indoor location and sensing, combining some unique and distinctive properties including large channel capacity, extremely low power transmission levels, low cost, low complexity and high range resolution capability [22], [23], [24]. IR (Impulse Radio) UWB communication systems are based on the transmission of very short duration pulses, which produces very high bandwidth signals. The short duration of the pulses allows a high level of accuracy with centimetre-level ranging resolution and unmatched performance in multipath environments [25]. Multiple studies can be found in the literature concerning both ranging [23] location and tracking algorithms [24], [26]. We consider in our setup a commercially available transceiver. The UWB radar module comprises one TimeDomain PulsON P410 transceiver and two Broadspec antennas [27]. The received signal sample data are sent to a host PC for data processing. the module has a 3.1-5.3 GHz bandwidth at -10 dB, giving a fractional bandwidth of 48%. The waveform generated by the transceiver is a Gaussian modulated sinusoidal pulse. It is centred at fc = 4.3 GHz, occupies more than 2 GHz of bandwidth and achieves an effective RF bandwidth of 1.4 GHz, as shown in Figure 3. This system is coherent giving it a significant advantage over other commercial systems. This allows individual pulses to be summed together, increasing both signal-to-noise ratio and processing gain. The nominal pulse repetition frequency for the system is 10 MHz, corresponding to a duty cycle of approximately 1%. As an example, averaging over 128 pulses increases the processing gain to 41 dB. The amount of averaging can be varied by factors of two, trading SNR for processing speed.The default gain of the system corresponds to the peak emission power permitted under the US Federal Communications Commission (FCC) rules [28]. In one of our experiments, the radar was placed at R = 0m and two human targets were present in the scene: the first person was sitting on the sofa at a range just below 2m from the radar; and intermittently moving the upper limbs. The second person was moving towards the radar and away from it in a straight line fashion with repetitive pattern, at a range between 3m and 5m. The radar return was collected, stored to disk, and post-processed using MATLAB.
B. Smart Home Gateway for Energy-saving Decision Making In the HG lies the heart of the DANCER operations. It performs the initial sensor data storage and processing, while providing the local Graphical User Interface (GUI). This is demonstrated by the gateway design included in Figure 2. As previously stated, the API service running on the gateway acts as a kind of middleware that masks the system operations and provides a unified inter-communication interface to the running local or remote services. This architecture divides the software components in three layers, namely the services, the middleware and the system-specific components and drivers. The HG is designed to support multiple communication interfaces. However the user/services should consider all sensors/actuators that are connected to these interfaces as generic end-points, where queries/actions can be performed, without requiring any technology-specific knowledge. Hence, an action repository has been developed, where small, technologydependant pieces of dynamic code can be placed, allowing operations to the various connected devices. All information related to the context used by the service layer, the connected devices and the action metadata, are stored in a separate database structure. This design allows the middleware functionality to be categorized in two generic classes, Context and Actions. These two categories can be further refined to onedimensional and time series context operations, and system and sensor/actuator actions respectively. The service layer (including the GUIs) utilizes a messaging scheme to send requests to the API Server running on the HG.
4
2014 IEEE Online Conference on Green Communications (OnlineGreenComm)
Fig. 3. PulsON P410 generated waveform in frequency (Left) and Time (Right).
Fig. 5. Examples of home network components deployed in the prototype installation. Starting clockwise from the top left corner, they depict a UWB platform measuring occupancy, an Xbee sensor monitoring the boiler operation, a Zigbee HA plug module and a Zigbee HA Thermostat.
show consumers and how to show it to them. These decisions require careful thought about the practical implications for the user’s convenience, comfort and safety, as well as their energy consumption. For example, on certain appliances (e.g., a fridge) a message might pop up asking users if they really want to remotely turn it off. Evidently, the VID plays an integral role in the success of DANCER because the proposed system depends on both end users acceptance as well as their input. A poorly designed interface may result in users rejecting the system or not benefiting from all its functions. Given this, the VID will be designed with end users in mind via an iterative process involving focus groups and surveys to ensure that it is intuitive (i.e., straightforward to use), engaging and appealing.
Fig. 4. Example of processed raw radar data.
Figure 4 shows the radar response as a function of time. More specifically, each individual radar return is plotted as a function of time with a color proportional to signal intensity. All of the scans are then plotted as rasters to form a final waterfall plot. The x-y axes are, respectively, range in meters and scan number. We can demonstrate on this figure the radar capability in tracking the moving person and separating its movement from the slower moving body parts of the second person. This capability offer the opportunity of tracking persons in their dwellings and inferring on the activities they are performing by map-matching the radar time-range plot with the actual environment plan.
IV. P ROTOTYPE I MPLEMENTATION
D. Visualized Information Display (VID)
Currently the prototype of the DANCER system is comprised of an enterprise level cloud platform connected to the public Internet, Raspberry Pi type B Single Board Computers (SBCs) acting as the HGs, and a variety of compatible sensors/actuator modules. The selected SBC features a 700 MHz ARM processor, 512MB of RAM and an 8 GB SD-card storage and is running the Rasbian Linux distribution operating system. Most DANCER services have been implemented using the Java Software Development Kit (SDK), while the local UI service was built over the Apache 2.2 web server and PHP 5.4. Although the software architecture follows a servicecentric approach similar to OSGi, it was deemed appropriate to avoid using the framework in order to optimize the gateway’s performance. Instead the services are controlled using Linux service manipulation tools. The followed service-centric software architecture though, could easily be ported on OSGi, for cases where a more powerful platform would be utilized. The HG is able to support peripheral sensors/actuators of various communication technologies. Apart from its embedded
The VID is the part of the system that end-users will have direct contact with and is where they can 1) access information about their consumption and 2) adjust their heating and appliances either remotely or locally. Regarding consumption information, current plans include showing end users the itemised costs of each energy activity. By linking cost to consumption we hope to highlight a households biggest areas of energy expenditure and where appropriate provide “actionable” advice. It is anticipated that this will be an improvement on existing energy monitors which require time, effort, and a certain degree of competence to unpack energy patterns and identify viable eco-actions [29]. Additionally, consumers will be able to view their historical information. This provides a benchmark to evaluate costs, although evidently some data collection is required first. As yet, it is unclear as to how this information should best be displayed as existing research is rare and offers conflicting findings [30], [31]. Regarding the control panel, decisions need to be made about what to
5
2014 IEEE Online Conference on Green Communications (OnlineGreenComm)
Fig. 6. Screen captures of the public web interface of DANCER. Starting clockwise from the top left corner, they depict the control panel, the list of energy guzzlers and the general data plotting facility. Fig. 7. Delays for the execution of commands on the smart gateway.
Ethernet port, it is also equipped with an Asus WL-330N3G 3G router/access point, a Telegesis ETRX357 Zigbee module and a C11 X10 Computer Interface Serial interface. Consequently, it has the ability to communicate with IPv4/IPv6 enables devices, Zibgee wireless sensors/actuators, as well as control X10 PLC modules. The ETRX357 module is currently running the Zigbee Home Automation (HA) profile firmware (CICIE R300 BETA) and acts as a coordinator. It has the capability to communicate not only with Zigbee Alliance certified modules, but also with Digi Xbee Pro modules, if these have been properly configured. The prototype implementation has already been deployed on a single bedroom flat in Colchester, UK. In the current setup, the average CPU utilization is currently around 9.8%, while the average active RAM utilization lies at about 38.5%. These measurements demonstrate the light weight solution applied over the limited SBC resources. As shown in Figure 5, the utilized/controlled devices installed around the house premises, include the platform described in subsection III-C, various Xbee-enabled sensors that monitor the room temperatures and the heating system activity, Zigbee-enable devices such as the HA Profile ZB-Connection5 Plug modules and a Computime6 CTW218 Smart Energy Thermostat. The UWB platform, is furthermore equipped with its own processing unit, in order to perform the necessary computations to detect occupancy and movement in the premises. The user is able to control the devices, as well as receive feedback through the web interface, provided by the public cloud platform. Various screen-shots of this interface are presented in Figure 6. The menu options are separated in two modes, simple and advanced. In the first one, the user is able to access the consumption readings and perform simple control operations on the household devices and the main thermostat schedule. The more advanced menu allows user to add/remove devices from the DANCER network, interact with the policy engine and change the monitoring operation of the system. Various tests were performed to examine the response time of the system. In two of the most prominent ones, the first one deals with the amount of time spent while redeploying
rule scripts on the policy engine of the HG, while the second one with measuring the delay until a Zigbee command has been successfully completed by the system. According to the firmware of the HGs Zigbee module, every command generates an output, whether it has been completed successfully or not. So the time since a user requests a command from the web interface, until the web-browser (using Javascript and AJAX) receives a response was measured. For both experiments 100 measurements were performed, and their distributions in milliseconds are depicted in Figure 7. The policy engine script redeployment is quite concise and usually takes a bit over 2 seconds. This is to be expected as is closely related to a software operation. The time for an action to be completed though, has a wider distribution and usually takes longer. Action requests are seen to take almost up to 5 seconds. This is caused by the traffic of the Zigbee network and the amount of commands being processed simultaneously. This demonstrated that the deployed number of Zigbee/Xbee devices should be kept to a minimum, otherwise the performance of the system may be seriously degraded. V. C ONCLUSIONS The presented project attempts to promote smart metering and intelligent agent applications to help understand customer energy consumption patterns. ICT is utilized to provide a modular and generic system, as described in this paper. The variety of controllable devices but also useful application services, necessitates the design of an architecture that is able to bridge this discrepancy. The main goal is to motivate users towards an active engagement with their energy management. The key to this motivation is to limit the user interaction requirements with the system, through an intelligent automated energy management mechanism. An issue that is usually overlooked in previous works is the user feedback. DANCER enables the users of the system to better understand the plethora of gathered data by employing comprehensive visualization approaches that are engaging and summarising. This is achieved by extending detailed graph-based information through overall and per appliance cost/consumption over a time period and comparisons with
5 http://www.zb-connection.com/ 6 http://www.computime.com
6
2014 IEEE Online Conference on Green Communications (OnlineGreenComm)
prior periods. All of this is achieved within a framework for information governance that takes into account the private and sensitive nature of the information involved. As far as future work is concerned, we plan to investigate the possibilities for conducting detailed studies relating to different aspects of the system, such as visualisation or the security of the API framework. Modularity in this context, was an important requirement, since it allows new components to be introduced without endangering the reliability of the whole system. Additionally, the deployment of DANCER is planned, over a larger number of residences and monitor the energy consumption behaviour of the users. The project is already in collaboration with the Croydon District Council, which has provided the team with access to several recently built smart metered dwellings meeting a minimum standard of Code for Sustainable Homes (Level 4). Finally, various intelligent methods will be examined, employing techniques such as genetic algorithm and neural networks. Since human behaviour is known to be hard to model, this operation will pose an interesting challenge to the project.
[9] C. McParland, “openadr,” in Power and Energy Society General Meeting, 2011 IEEE. [10] N. Saito, “Ecological home network: An overview,” Proceedings of the IEEE, vol. 101, no. 11, pp. 2428–2435, Nov 2013. [11] M. Bjelica, B. Mrazovac, V. Vojnovic, and I. Papp, “Gateway device for energy-saving cloud-enabled smart homes,” in MIPRO, 2012 Proceedings of the 35th International Convention, May 2012, pp. 865–868. [12] D. Arnold, M. Sankur, and D. Auslander, “The next generation energy information gateway for use in residential and commercial environments,” in Power and Energy Society General Meeting (PES), 2013 IEEE, July 2013, pp. 1–5. [13] Y.-G. Ha, “Dynamic integration of zigbee home networks into home gateways using osgi service registry.” IEEE Trans. Consumer Electronics, vol. 55, no. 2, pp. 470–476, 2009. [Online]. Available: http://dblp.uni-trier.de/db/journals/tce/tce55.html#Ha09 [14] P. Jason and I. Cooper, “Smart metering implementation programme government response to the consultation on the second version of the smart metering equipment technical specifications part 1,” Department of Energy and Climate Change of the UK, Tech. Rep., 2013. [15] T. Peffer, M. Pritoni, A. Meier, C. Aragon, and D. Perry, “How people use thermostats in homes: A review,” Building and Environment, vol. 46, no. 12, pp. 2529–2541, Dec. 2011. [Online]. Available: http://dx.doi.org/10.1016/j.buildenv.2011.06.002 [16] Office for National Statistics, “Full report: Household energy spending in the uk, 2002-2012,” http://www.ons.gov.uk/ons/rel/ household-income/expenditure-on-household-fuels/2002---2012/ full-report--household-energy-spending-in-the-uk--2002--2012.html, 2014. [17] C. Fischer, “Feedback on household electricity consumption: a tool for saving energy?” Energy Efficiency, vol. 1, no. 1, pp. 79–104, Feb. 2008. [Online]. Available: http://dx.doi.org/10.1007/s12053-008-9009-7 [18] O. T. Force, “UCAIug home area network system requirements specification ver. 2.0,” http://osgug.ucaiug.org/sgstore/Shared%20Documents/ UCAIug%20HAN%20SRS%20-%20v2.0.pdf, Aug 2010. [19] M. Bartsch, “German smart metering and european privacy needs,” in Security in Critical Infrastructures Today, Proceedings of International ETG-Congress 2013; Symposium 1:, Nov 2013, pp. 1–3. [20] B. Vaidya, D. Makrakis, and H. Mouftah, “Secure remote access to smart energy home area networks,” in Innovative Smart Grid Technologies (ISGT), 2012 IEEE PES, Jan 2012, pp. 1–7. [21] DECC. [22] B. Allen, M. Ghavami, A. Armogida, and H. Aghvami, “The holy grail of wire replacement?” Communications Engineer, vol. 1, no. 5, pp. 14 – 17, Oct 2003. [23] G. Yang, L. Giannakis, “Ultra-wideband communications, an idea whose time has come,” IEEE Signal Processing Magazine, vol. 21, no. 6, pp. 26 – 54, Nov 2004. [24] S. Gezici, Z. Tian, G. B. Giannakis, Kobayashi, and A. H. Molisch, “Localization via ultra-wideband radios. a look at positioning aspects of future sensor networks,” IEEE Signal Processing Magazine, vol. 22, no. 4, pp. 70 – 84, Jul 2005. [25] M. Ghavami, L. Michael, and R. Kohno, Ultra Wideband Signals and Systems in Communication Engineering. Wiley & Sons., 2007. [26] F. Seco, A. Jimenez, C. Prieto, J. Roa, and K. Koutsou, “A survey of mathematical methods for indoor localization,” in Intelligent Signal Processing, 2009. WISP 2009. IEEE International Symposium on, Aug 2009, pp. 9–14. [27] “Timedomain corporation,” http://www.timedomain.com. [28] “Federal communications commission,” http://www.fcc.org. [29] K. Buchanan, R. Russo, and B. Anderson, “Feeding back about ecofeedback: How do consumers use and respond to energy monitors?” Energy Policy, vol. 73, no. 0, pp. 138 – 146, 2014. [Online]. Available: http://www.sciencedirect.com/science/article/pii/S0301421514002894 [30] T. Chiang, S. Natarajan, and I. Walker, “A laboratory test of the efficacy of energy display interface design,” Energy and Buildings, vol. 55, no. 0, pp. 471 – 480, 2012, cool Roofs, Cool Pavements, Cool Cities, and Cool World. [Online]. Available: http://www.sciencedirect.com/science/article/pii/S0378778812003714 [31] T. Chiang, G. Mevlevioglu, S. Natarajan, J. Padget, and I. Walker, “Inducing [sub]conscious energy behaviour through visually displayed energy information: A case study in university accommodation,” Energy and Buildings, vol. 70, no. 0, pp. 507 – 515, 2014. [Online]. Available: http://www.sciencedirect.com/science/article/pii/S0378778813006828
ACKNOWLEDGMENTS The work presented in the paper was funded by UK EPSRC project DANCER (EP/K002473/1; EP/K002643/1). The authors would also like to thank the Telegesis team for their most valuable advices. R EFERENCES [1] P. Jason and I. Cooper, “UK Housing Energy Fact File 2012: energy use in homes,” Department of Energy and Climate Change of the UK, Tech. Rep., 2013. [Online]. Available: https://www.gov.uk/government/ publications/housing-energy-fact-file-2012-energy-use-in-homes [2] S. Monahan, A. Gemmell, N. Foundation, and N. F. Staff, How Occupants Behave and Interact with Their Homes: The Impact on Energy Use, Comfort, Control and Satisfaction. Building Research Establishment, 2011. [Online]. Available: http://books.google.co.uk/ books?id=NKF5twAACAAJ [3] Y. Strengers, “Negotiating everyday life: The role of energy and water consumption feedback,” Journal of Consumer Culture, vol. 11, no. 3, pp. 319–338, 2011. [Online]. Available: http: //joc.sagepub.com/content/11/3/319.abstract [4] W. Abrahamse, L. Steg, C. Vlek, and T. Rothengatter, “A review of intervention studies aimed at household energy conservation,” Journal of Environmental Psychology, vol. 25, no. 3, pp. 273 – 291, 2005. [Online]. Available: http://www.sciencedirect.com/science/article/ pii/S027249440500054X [5] J. H. van Houwelingen and W. F. van Raaij, “The Effect of Goal-Setting and Daily Electronic Feedback on In-Home Energy Use,” The Journal of Consumer Research, vol. 16, no. 1, pp. 98–105, 1989. [Online]. Available: http://dx.doi.org/10.2307/2489305 [6] S. Karjalainen, “Consumer preferences for feedback on household electricity consumption,” Energy and Buildings, vol. 43, no. 2, pp. 458– 467, 2011. [7] M. Weiss, C.-M. Loock, T. Staake, F. Mattern, and E. Fleisch, “Evaluating mobile phones as energy consumption feedback devices.” in MobiQuitous, ser. Lecture Notes of the Institute for Computer Sciences, Social Informatics and Telecommunications Engineering, P. Snac, M. Ott, and A. Seneviratne, Eds., vol. 73. Springer, 2010, pp. 63–77. [Online]. Available: http://dblp.uni-trier.de/db/conf/mobiquitous/ mobiquitous2010.html#WeissLSMF10 [8] J. Ringelstein, M. Vogt, and B. Klebow, “An energy management gateway for facilities based on open middleware,” in Intelligent Energy Systems (IWIES), 2013 IEEE International Workshop on, Nov 2013, pp. 46–51.
7