Technical Report 1513520080128. A Validated Framework for Measuring Interface Support for Interactive Information Seeking. Max L. Wilson, m.c. schraefel.
A Validated Framework for Measuring Interface Support for Interactive Information Seeking Max L. Wilson, m.c. schraefel School of Electronics and Computer Science University of Southampton, UK
{mlw05r, mc}@ecs.soton.ac.uk ABSTRACT In this paper we present the validation of an evaluation framework that models the support provided by search systems for different types of user and their expected types of seeking behavior. Factors determining the types of users include previous knowledge and goals. After an overview is presented, the framework is validated in two ways. First, the novel integration of the two existing information-seeking models used in the framework is validated by the correlation of multiple expert and novice analysis. Second, the framework is validated against the results produced by two separated user studies. Further, the refinements made by the first validation technique are shown to increase the accuracy of the framework through the second technique. The successful validation process has shown that the framework can identify both strong and weak areas of search interface design in only a few hours. The results produced can be used to either revise and strengthen designs or inform the structure of a user study.
Categories and Subject Descriptors H.5.2 [User Interfaces]: Theory and Evaluation/methodology, User-Centered Design.
Models,
1. INTRODUCTION Despite the successful development of many new enhancements to information retrieval and interactive information seeking, Järvelin and Ingwersen still note the need to understand how different types of users can use all these features together in achieving their search and work tasks [12]. An example of a successfully researched feature is Boolean search [8], which showed that users could be more specific in their keyword queries. Similarly, spelling suggestions also supported users in a new way by allowing them to quickly select revised versions of their search terms [15]. Search interfaces may be built up of many such features to support general information seeking. Here we review and validate a framework that has been designed to simultaneously assess search interfaces from the point of view of known types of users. Further, the framework can identify both strong and weak functionality within the search interfaces, so that designs can be improved to better support different search tactics and the users that may use them. In the following sections we first briefly present related work into the theoretic modeling of users in information retrieval and information seeking research, focusing on the models used within Permission to make digital or hard copies of all or part of this work for personal or classroom use is granted without fee provided that copies are not made or distributed for profit or commercial advantage and that copies bear this notice and the full citation on the first page. To copy otherwise, or republish, to post on servers or to redistribute to lists, requires prior specific permission and/or a fee. Conference’04, Month 1–2, 2004, City, State, Country. Copyright 2004 ACM 1-58113-000-0/00/0004…$5.00.
the framework. This is followed by a brief overview of the existing evaluation framework. More detail can be found in Wilson et al. [23, 24]. Section 4 describes the validation of the framework on two fronts. First, the novel integration of these models is validated through correlating the mapping with other expert and novice opinion. After refining the framework, we validate the accuracy of the framework, by matching its analyses against the results of user studies. The paper concludes with the contributions of the framework and the on-going work that is planned to extend its capabilities.
2. RELATED WORK Here we overview work related to the design of the framework. A more detailed survey of the material, including a discussion of which models to use within the framework, can be found in a previous publications [23, 24]. Here we focus on what has been chosen to provide context to the validation of the framework. Järvelin and Ingwersen [12] recently reviewed the history of information seeking research and summarize the field into 9 dimensions: Actors, Work Task, Perceived Work Task, Search Task, Perceived Search Task, Documents, Algorithms, Interfaces and Interaction. While most research into information retrieval has mainly focused on documents and algorithms, information seeking research has produced models of actors, search tasks, interfaces and interactions. Further, they specifically state that “There is a shortage of studies that relate system features to features of task and/or seeking processes”. Below we present a framework that addresses this research gap, as it is designed specifically to understand how search interface features support different information seeking processes. Further, it models the seeking processes that are likely to be required by different types of users. Below we present the two models used in the framework and research pertaining to their validity. In 1979, Bates presented a model of information seeking activity that defined four levels of complexity [1, 2]. At the lowest level of granularity, a user may make any number of mental or physical moves such as deciding on a keyword (mental) and entering it into a search box (physical). By using a combination of these moves, a user may carry out a search tactic that achieves part of their search tasks. As part of her contribution, Bates identified 32 individual tactics that may be carried out with information systems. By using a combination of moves and tactics, a user might perform a stratagem, which in turn can be used in combination with tactics and moves to follow a larger strategy. Due to their complexity and unpredictability, strategies and stratagems remain to this day mostly undefined. Strategies may vary from user to user, and will be different in different domains. Further, strategies and stratagems may surpass the activity within one search system and
Technical Report 1513520080128
may determine the choice of service. To our knowledge, no one has produced a specific list of stratagems or strategies. Aside from reusing her own model of search moves and tactics for many years [19], many other studies have shown the accuracy and thoroughness of Bates’ identified tactics by analyzing the actions of searchers. Before using Bates’ model in his own research [10], Hsieh-Yee identifies a further 6 studies that use tactics and moves to explain the search behavior of participants, including [13, 17, 21] and 2 occasions where the model has been used to design a new search system [5, 18]. Here, Bates’ tactics and moves are used together in a novel way as metrics within the framework. In a separate strand of research that aims to understand the conditions and needs that drive the information seeking behavior of Actors (users), Belkin et al. identified four dimensions with two values that could be used to classify types of users. Method describes whether a user is either searching for a particular information object, or scanning a set of information objects. Goal describes whether a user is learning about something or selecting something. Mode is between recognizing and specifying something. Resource is between requiring information items or meta-information about an item. For example, traditional Web search engines such as Google, Yahoo, and Live Search are best used for ISS15, where the user is searching (Method) to select (Goal) by specifying (Mode) attributes of a specific information object (Resource). Subsequently, traditional Web search engines least support users who are scanning (Method) to learn (Goal) by recognizing (Method) some meta-information about an object (Goal): this is ISS2. Faceted browsing tries to support users by presenting all the meta-information to the user in advance and letting them choose. Conversely, this best supports ISS2, but may inadequately support ISS15: useful meta-information can be embedded in long lists and it may require more effort to find them than to simply type them into a search box. Aside from Nicholas Belkin being cited as one of the more prominent researchers in the field [20] and the model having been cited by many papers, there has been very little direct validation of the model. In the same paper that proposed the four dimensions [4] and in a follow-up paper [3], Belkin and his colleagues used the model to build two separate systems that support various types of users. No empirical studies were performed. In response to research by Pharo that found out the model may be insufficiently exhaustive for some conditions [14], however, Cool and Belkin produced an extended version that goes into much more detail [7]. These enhancements were then validated by Huvila and WidenWulff by applying the extended model to multiple scenarios [11]. Although the original model being used in the framework has not been directly validated, it provided the core understanding for an elaborated version of the model that was later given a strong validation. Further, the extended model reuses the dimensions of the first version, but goes into more detail than is necessary for the framework below. Consequently, we accept this as a sufficient validation for using the earlier model, but recognize that future work should investigate the extended version for use within the framework. Including the extended version, however, will not be trivial as it produces over 100 types of user in comparison with the current 16 less-finite types of user.
3. OVERVIEW OF FRAMEWORK Here we present an overview of a framework, reported in detail by Wilson et al. [23, 24], which can be used to evaluate search interfaces for their support of the different known types of users
and tasks. The flexible framework can formalize either multiple designs of a single feature, or collectively the cumulative support provided by whole search interfaces. The strength and weaknesses of designs are formalized in two ways. First, the framework identifies how well it supports each of the known search tactics the interface supports. Second, the framework identifies how well the interface supports different types of users through a novel integration of two models. The inputs, processes, and outputs of the framework are described briefly below.
3.1 Framework Inputs The input process of the evaluation framework is built of a single step repeated as follows. For each browser or design in the study (L1), and for each function or feature with the designs (L2) count how many moves (mental or physical) it takes to perform each of Bates tactics (L3). For example, Wilson et al. [23, 24] apply the framework to three faceted browsers: mSpace [16], RB++ [26], and Flamenco [25]. When applying the framework to the three browsers, L1 is to repeat the enclose steps for mSpace, then for RB++, and then for Flamenco. Loop L2 is, within each browser), to step through each of the features. Then for each feature, to ask how many moves it takes to achieve each of the tactics (L3).
3.2 Automatic Processing The processing of data within the framework is constructed by the novel integration of two models discussed above: Bates tactics and moves [1, 2] mapped onto the 16 user types described by Belkin et al. [4], where each type is made out of a unique combination of four dimensions with two options. Once the data entry has been completed, an existing mapping of tactics to values within Belkin’s four dimensions produces cumulative scores that correlate to the support provided for each user type. This mapping is one of the novel contributions of the framework and is one of key areas of validation covered in Section 4.1. In simple terms, the mapping states that: users in condition x may need to carry out the tactics {a, c, d, etc.}. This novel mapping provides a metric for search systems that has not been previously available, which allows us to see which user types are well supported and which user types may have trouble using the system.
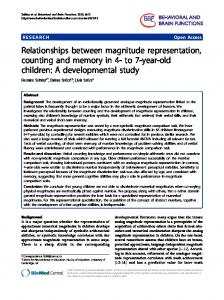
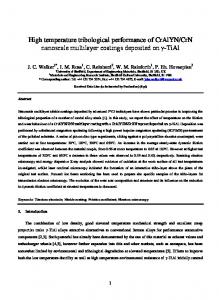
3.3 Framework Outputs The outputs of the framework are three separate graphical representations that define: G1) the support provided by each feature, G2) the support provided for different search tactic, and G3) the support provided for different user types. An example of Graph G1 is shown in Figure 1. From graph G1, we can see: a) the implementation of a feature is strongest in a browser; b) a browser may not provide a certain feature at all; c) a browser may provide a unique feature and how much support it alone provides. Graph G2 shows the total support provided for each Tactic, an example is shown in Figure 2. Graph G2 can show that: a) the support for one tactic is strongest in a certain browser; b) a browser may not support a tactic at all; and c) a browser may uniquely support a tactic. The features providing the support for particular tactics can be identified by reviewing the data entered, or by converting the graphical representation to a stacked bar graph. Graph G3 is the product of the novel integration of the two models and shows the total support provided by each interface for each user type; an example is shown in Figure 3. Graph G3 can be used to highlight the types of users that are supported well by the interfaces and those who could be supported better. The visualization is read in patterns, and so a line graph has been
Technical Report 1513520080128
Figure 2: Graph G2 showing the total support for each of Bates’ tactics provided by each browser, taken from [23, 24].
4. VALIDATION OF THE FRAMEWORK Although the framework has previously shown promising results [23, 24], they must be validated before the approach can be used as a basis for decision or for influencing changes in design. As the validity of the models used in the framework have already been shown by other research, there are two areas of the framework left to validate before it can be used confidently. The first step is to validate the novel integration of the chosen models, which is described in Section 4.1. Finally, the overall framework is validated against user studies in Section 4.2.
Figure 1: Graph G1 showing the support provided by each feature of each browser; taken from [23, 24].
4.1 The Integration of Models Validated by Group Consensus The novel integration of Bates’ and Belkin’s models described above is constructed of a non-trivial mapping, as each Tactic (Bates) cannot be obviously or clearly connected with any specific value of Belkin’s dimensions. Further, as well as being difficult to state that a Tactic x is associated with Dimension A, we cannot easily calculate the amount that Dimension A is supported. Consequently, it is important that the chosen mapping be validated so that the margin for error in the non-trivial integration is reduced. As there is no fixed process or metric to produce the mapping, it can only be discussed with and confirmed by others researchers. For this validation process, 3 search experts and 3 unschooled researchers, with little or no knowledge of information seeking, have been involved in assessing the existing mapping.
4.1.1 Method Figure 3: Graph G3 showing the support provided by each interface for the 16 known user types; taken from [23, 24]. chosen to clearly reveal the patterns, even though the data points are not continuous. Any differences in the alternate halves, quarters, eighths or sixteenths are attributed to the Method, Goal, Mode, and Resource dimensions respectively. A full analysis of the Figures 1-3 is in Wilson et al. [23, 24].
To formalize the mapping assessment, rather than simply having structured discussions, an analysis method was designed to: clearly present the models, collect mapping suggestions, and automatically produce a refined mapping. The process of formalizing a correlated mapping between the two models is one of the contributions of this paper, as it can be reused each time new mappings or refinements are suggested. To collect mapping suggestions from participants, an online form was generated that clearly presented each of Bates’ Tactics, one at a time, along with a clear description from the original publications. Below the Tactics was a description of each of
Technical Report 1513520080128
Belkin’s dimension values. For every Tactic (Bates), the participant was asked to select a dimension value (Belkin) that it most, second-most, and third-most supported. The decisions for each Tactic were stored in a database and added to a spreadsheet when the participant had completed the full set of Tactics. To process the assessments provided by the participants, the number of times each dimension value was selected for each Tactic was counted and the most popular choices were presented. This process provides three types of information. First, it identifies parts of the mapping that are unanimous across all participants, including the original mapping. Second, the process identifies parts of the mapping that were in close competition, so that they could be discussed. Preference, in this second case, was given to the opinion of experts. Third, the process identified parts of the mapping that varied widely and required investigation. The results of this validation are discussed below.
4.1.2 Results The process of producing a mapping was successful, but in evidence that producing a mapping between the two models is non-trivial, only 34% of the tactics could be immediately agreed upon without need for discussion or investigation. The rest of the tactics, as planned, were investigated by either assessing the difference in expert and novice opinion, or by revisiting literature to inform discussion. Almost a third of the tactics had to be carefully researched and discussed. In the worst case, the suggested mapping of one Tactic was different for almost every participant. Finally, the correlation between the new and old mappings is only around 60%, showing, in this case, that the validation process was both successful and important for the validity of the overall framework.
4.1.3 Discussion The process of validating the integration of the two models has provided opportunity to produce and refine new mappings. In particular, these mappings affect the information conveyed by Graph G3, as it controls the way that the information from Graph G2 is summarized for each user type. In Figure 4 we see a revised version of Graph G3 on the information reported by Wilson et al. [23, 24]. As mentioned above, Graph G3 is read in patterns. In comparison with the previous graph (Figure 4) we can see three specific improvements in what Graph G3 tells us. First, instead of suggesting that Flamenco has enhanced support
for Searching for known items over Scanning for items that may or may not exist, we see that the emphasis has moved to support users who will need to Recognize their results over being able to Specify. This pattern appears because the presence of facets allows users to recognize search terms rather than having to know them in advance to specify queries in a keyword search. Further, this notable improvement for Flamenco is inline with its facet optimization, where used facets are minimized to give more space to unused facets. This reorganization means that more meta-data can be recognized. One of the reasons that mSpace is notably higher in the Specifying conditions (even eighths) is that it offers both Boolean keyword searches and interactive spelling suggestions, which were not present in the other browsers at the time of evaluation. The second notable refinement is the missing rise in the RB++ browser for user types 13 and 14, who are Searching to Select by Recognizing. This difference is most likely to be because the other two browsers progressively filter results with each selection. RB++, however, requires users to explicitly ask for results after any number of selections. Consequently, users cannot recognize that their selections have found the right results as easily. The third notable refinement is that in mSpace, there is slightly better support for Information over Meta-Information, which can be attributed to the fact that, although each browser presents facets, only mSpace has a facet specifically for Information items. Combined with the more expressive results in Graph G3, we can be confident in the refined mapping that has been produced in collaboration through consensus and discussion.
4.2 The Framework’s Overall Results Validated by User Studies To be confident that the refined framework ultimately produces accurate results, we must formally check them against results that have been statistically proven, or not, by user studies. Two such studies are discussed below.
4.2.1 Method The method used for both user study examples below is the same. The designs or systems used in the studies are reviewed and entered into the framework. The three output graphs of the framework are used to show that the user study results could have been predicted. Further, we show how the study results can be explained and evaluated in more detail than the user studies.
4.2.2 Results of the Backward Highlighting Study Wilson et al. report on a study that examined a new feature of mSpace called Backward Highlighting [22]. In brief, the new feature was designed to enhance facets in directional columnfaceted browsers such as iTunes and mSpace. As such browsers only filter from left-to-right, in order to provide additional data and options to the user, it means that relationships are not conveyed from right-to-left, like in traditional faceted browsers, such as Flamenco and RB++; more detail on this problem is included in [22]. Backward Highlighting was designed to improve the directional column-faceted browsers to highlight the right-toleft relationships (backwards up the columns) so that the user receives a faceted experience that includes the best of both styles.
Figure 4: Graph G3 showing he support provided by each interface for the 16 known user types; using the refined mapping.
Technical Report 1513520080128
In designing the best implementation of Backward Highlighting, the authors provide two designs, where the second is referred to as Bucket Highlighting. The design of Bucket Highlighting is different in that it groups the highlighted, and thus related, items together. In this study, the value of L1 (number of interfaces) is 2, as there are two designs of the new feature. The value of L2 (number of features) is 1, which is the Backward Highlighting technique alone. The move data (main step) for each tactic (L3) was entered for the one feature in both designs. As there is only one feature, Graph G1, shown in Figure 5, only shows one feature (the new technique) and suggests that Bucket Highlighting design is slightly stronger. Graph G2, shown in Figure 6 shows us in which tactics the Bucket Highlighting design is stronger. In particular, it supports tactics such as WEIGH and SURVEY, as all of the highlighted items are together and so the user can assess the set of highlights more easily. This difference provides better support for four separate tactics in total. Graph G3, is shown twice: Figure 7 shows the original mapping and Figure 8 shows the refined mapping. First, the new mapping (for both design options) puts more emphasis on meta-information, which is important because the tool specifically highlights backwards up the facets that show meta-information. Further, this meta-information rise is sharper for times when the user is recognizing (users 2, 6, 10 and 14), which is important as a user who is knowledgeable enough to specify the items to select does not necessarily need the new technique other than to guide her eye. The original mapping (Figure 8) incorrectly indicates that backwards highlighting is in general better for users searching for a known item (right half of the graph) where as it actually well supports users who do not already know the relationships (scanning) even to recognize them. Further, the new mapping puts a more even balance on the odd and even quarters (learning and selecting), which is better than the old mapping, as it acknowledges that users can simply learn about the data from the tool and also use the highlights to make selections. Arguably a user can more easily learn from the highlights, as it does not involve any further actions, and so the slight downward slope, from left to right, in the new mapping (Figure 9) may also be more accurate. In terms of the two designs, the results of the study indicated that there was very little difference between the two designs; we see that the two lines do follow a very similar pattern. Statistical evidence was provided to show that slightly more about the meta-
information could be learned with the Bucket Highlighting condition. This is shown in Figure 9, by the most significant gaps being on the left of the graph, where users are scanning and learning more often. The increased gaps in the first and third quarters, compared to their second and fourth counterparts, supports the study results that participants did not necessarily make more selections. Finally, the overall increased support described by the graphs could have predicted that the users, overall, would have preferred the Bucket Highlighting technique; this preference was another finding in the user study.
4.2.3 Results of Faceted Browser Study Similar to the analysis of faceted browsers by Wilson et al. [23, 24], Capra et al. report on a user study of two faceted browsers and the original website of the source data [6]. The original website was the Bureau of Labor Statistics, which presents a hierarchical classification on its homepage that categorizes US government reports. The website is compared to both the RB++ browser and an un-configured or ‘vanilla’ version of Endeca; both with faceted classifications over the same goal object: government reports on labor. Two studies were carried out: one between participants and one within participants. The first study to provide empirical results and the second to provide a qualitative to gain further insights. In both studies participants were asked to carry out three types of task: 1) a simple look up task where the answer could be found
Figure 5: Graph G1 showing the support provided by the two different designs of Backward Highlighting.
Figure 6: Graph G2 showing the support for each tactic by the two designs of Backward Highlighting.
Technical Report 1513520080128
Figure 7: Graph G3 showing the support for each type of Belkin's user by the two designs, using the original mapping.
Figure 8: Graph G3 showing the support for each type of Belkin’s user by the two designs, using the new mapping.
using just one facet; 2) A complex lookup task that required the use of multiple facets in conjunction; and 3) an exploratory task where participants were asked to learn about a given topic and report on the most interesting or important facts.
were to be found given certain selections (10). It provided this in two forms, specific values (NVIs in Figure 9) and previews of affect before clicking (Preview cues in Figure 9).
The types of task used break up into two types of user according to Belkin’s dimensions. The two lookup tasks are both user type 13, where the user knows the answer lies within the systems (Searching) and their Goal is to select the answer to show they have completed to the task. As they do not know all the facts about the report, they cannot specify which report they want but can recognize reports that may contain the answer. Finally, the user is looking for an answer in the reports, rather than in the classification schemes, and so they are looking for Information. User types 1 and 2 represent the exploratory task, as the facts that they find could also be produced from the meta-information in the classifications or the information in the reports. As there is no specific answer to the question, the participant will be scanning in order to learn more about the topic. Again they will only be able to recognize interesting reports as they see them. The results of the study were not as expected, when no browser performed particularly well compared to the others. Even the original website performed equally well if not slightly better in the results. By applying the framework to the same three interfaces, we can see from Graph G3 (Figure 11) that the point where the three browsers perform most evenly is at user 13 - the user type that represents the simple and complex lookup tasks. Further, we can see that for the exploratory tasks (user types 1 or 2) the website even outperforms the RB++ browser. As part of the qualitative analysis from the second study, participants were asked to label their most and least favorite aspects of the three browsers; summarized in Table 1. By referencing Graph G1 (Figure 9) we can show that the analysis by feature could have predicted these results too. According the results of the framework, the original website provided the strongest keyword search function (1); the RB++ browser does not provide keyword search at all (11). The second strongest feature of the website was the clearly presented facets (2), although the facets in RB++ are more powerful (9). Of the three browsers, the website provided the least strong search results (3). The website was also the only browser not to provide some means of filtering or sorting the results (4). Although providing both facets and keyword search, neither implementation was as strong as the other browsers (7). The RB++ Browser was the only browser to provide numbers to indicate how many documents
Table 1: Table showing the most and least favorite aspects of each faceted browser Pros Original Website Cons Pros ‘Vanilla’ Endeca Cons Pros RB++ Browser Cons
1. Keyword Search 2. Clear Facets 3. Poor Search Results 4. Manipulating Data 5. Useful Facets 6. Narrowing Results 7. Limited Search 8. Poor Search Results 9. Powerful Facets 10. Numeric Indicators 11. Limited Search Ability 12. Poor facets
There are some results that cannot be so clearly revealed by Graph G1 (Figure 9). For example, our analysis shows that the results listings in Endeca were quite strong, which is in contrary to (8). One explanation could be that the feelings towards Endeca were quite neutral. A rating of how favorable the features were perceived was not reported, and so we cannot tell if this feature was specifically disliked. Another comment that was not predicted was that the participants did not like the structure of the facets in RB++. In the paper, Capra et al. suggest that the number of facets in the items were uneven. There is not a metric for this sort of aspect in the framework, but Hearst reports that the careful construction of facets is important in the design of faceted browsers [9]. Finally, an explanation for the dislike of the RB++ facets could be in comparison to the clear representation on the original website’s front page. We can see from Graph G2 (Figure 10) that the original website was particularly strong for tactics such as SURVEY, WEIGH, and CHECK. In particular, the clear layout of the classification on the front page of the website supports the ability to SURVEY a wide range of options. This less clear
Technical Report 1513520080128
Figure 10: Graph G2 showing the support for each of Bates’ tactics provided by each interface.
Figure 9: Graph G1 showing the support provided by each feature of the three interfaces. representation in RB++ faceted browsers could explain its mention in the least favorite features (12). Regardless of the potential explanations for these unpredicted results, we perceive them as remaining challenges for the development of the model, discussed further below. Finally, another overall comment, that was not included in the most and least favorite features, was that, once selected, the participant had to leave the two faceted browsers to view an individual report. Users of the original website, however, can simply view the reports on the website. This disconnect is also shown in Graph G1 (Figure 10).
5. CONCLUSIONS In this paper we have presented a validation of a model that has been proposed to help evaluate the designs of information systems to best support the needs of known user types. The validation has been on two fronts. First, the novel mapping used in the framework was validated and strengthened through a formalized correlation of multiple expert and novice opinions. Second, the accuracy of the whole framework has been assessed against the results of previously reported user studies. Further, we note that the application of the framework takes significantly less time to apply than performing user studies. The BH study involved 18 hours with participants and the faceted browser study reported
Figure 11: Graph G3 showing the support for each of Belkin’s user types provided by each interface; using the new mapping. around 40 hours with participants, excluding planning and analysis. The application of the framework to both studies, and interpreting the graphs, took between a half and whole day. Given the accuracy of the strengthened framework shown in the validation above, and the relatively small amount of time required to get results, we propose that the framework be used in the early design of information systems in preparation for users studies. There are two ways the framework can support user studies. First, early designs can be systematically and thoroughly analyzed to identify areas for improvements. This can prevent time consuming and possibly expensive user studies being performed on designs with overlooked flaws. Second, the analysis can help inform the design of studies. There are user types that are supported particularly well by faceted browsers like RB++, and they could have been shown clearly in a user study given the right types of tasks. Although it would have been hard to predict, the types of users represented by the tasks in the study by Capra et al. happened to be supported well by all of the browsers. The validation above has strengthened the framework and has shown that it can be used accurately to evaluate designs, but it has also identified some results that could not have been predicted.
Technical Report 1513520080128
We perceive these as remaining challenges in the design of the framework. We have also noted that the model by Belkin has been validated and extended to produce a much larger model of users. The switch from the old model to the new model by Belkin is part of our future work. The remaining future work will be aimed at identifying an opposing measure in the framework to make sure that designs do not become too complicated as the number of strong search features increases. The evaluation framework has been shown to provide an accurate and structured approach to assessing the designs of information systems, in terms of both the range of known information search tactics and the range of known types of information seeking users. Not only can it show that one search interface is stronger than another for different types of users, the tactic analysis can explain why they are well supported and the feature analysis can be used to show which design aspects provide the additional strength. We believe that the framework can support information retrieval and seeking researchers in designing stronger new features and help them analyze the extent that they support different types of users.
12. 13. 14.
15.
16.
6. ACKNOWLEDGEMENTS Thanks to the participants of the mapping validation. We also greatly appreciate the insights provided by Rob Capra and Gary Marchionini about their study of faceted browsing.
17.
7. REFERENCES
18.
1. 2. 3.
4.
5. 6.
7.
8.
9. 10.
11.
Bates, M.J. Idea tactics. Journal of the American Society for Information Science, 30 (5). 280-289. Bates, M.J. Information search tactics. Journal of the American Society for Information Science, 30. 205-214. Belkin, N.J., Cool, C., Stein, A. and Thiel, U. Cases, scripts, and information-seeking strategies: on the design of interactive information retrieval systems. Expert Systems with Applications, 9 (3). 379-395. Belkin, N.J., Marchetti, P.G. and Cool, C. Braque: design of an interface to support user interaction in information retrieval. Inf. Process. Manage., 29 (3). 325-344. Buckland, M.K. Design for an Adaptive Library Catalog. Proceedings of the ASIS Mid-Year Meeting, 165. 71. Capra, R., Marchionini, G., Oh, J.S., Stutzman, F. and Zhang, Y. Effects of structure and interaction style on distinct search tasks. Proceedings of the 2007 conference on Digital libraries. 442-451. Cool, C. and Belkin, N.J., A classification of interactions with information. Proceedings of the 4th International Conference on Conceptions of Library and Information Science, (2002). 1-15 Croft, W.B., Turtle, H.R. and Lewis, D.D. The use of phrases and structured queries in information retrieval. Proceedings of the 14th annual international ACM SIGIR conference on Research and development in information retrieval. 32-45. Hearst, M.A. Clustering versus faceted categories for information exploration. Commun. ACM, 49 (4). 59-61. Hsieh-Yee, I. Search Tactics of Web Users in Searching for Texts, Graphics, Known Items and Subjects: ASearch Simulation Study. Electronic Resources: Use and User Behavior. Huvila, I. and Widén-Wulff, G. Perspectives to the classification of information interactions: the Cool and
19. 20.
21.
22. 23.
24. 25.
26.
Belkin faceted classification scheme under scrutiny. Proceedings of the 1st international conference on Interaction in context. 144-152. Järvelin, K. and Ingwersen, P. Information seeking research needs extension towards tasks and technology. Information Research, 10 (1). 10-11. Moody, M.K. Documents search strategies and general reference search strategies: an analysis and comparison. The Reference librarian (32). 57-69. Pharo, N., Web information search strategies: A model for classifying web interaction. Proceedings of the 3rd International Conference on the Conceptions of the Library and Information Science, (1999). 207–218 Ruthven, I. Re-examining the potential effectiveness of interactive query expansion. Proceedings of the 26th annual international ACM SIGIR conference on Research and development in informaion retrieval. 213220. schraefel, m.c., Wilson, M.L., Russell, A. and Smith, D.A. mSpace: improving information access to multimedia domains with multimodal exploratory search. Communications of the ACM, 49 (4). 47-49. Shute, S.J. and Smith, P.J. Knowledge-Based Search Tactics. Information Processing and Management, 29 (1). 29-45. Smith, P.J., Shute, S.J., Galdes, B. and Chignell, M.H. Knowledge-based search tactics for an intelligent intermediary system. ACM Transactions on Information Systems (TOIS), 7 (3). 246-270. W3C. RDF/XML Synctax Specification (Revised) http://www.w3.org/TR/2004/REC-rdf-syntax-grammar20040210/. Accessed on: 31st October 2007. White, H.D. and McCain, K.W. Visualizing a discipline: An author co-citation analysis of information science, 1972-1995. Journal of the American Society for Information Science, 49 (4). 327-355. Wildemuth, B.M., de Bliek, R., He, S. and Friedman, C.P. Search moves made by novice end users. Proceedings of the 55th annual meeting on Celebrating change: information management on the move: information management on the move table of contents. 154-161. Wilson, M.L., André, P., Smith, D.A. and schraefel, m.c. Spatial Consistency and Contextual Cues for Incidental Learning in Browser Design, 2007. Wilson, M.L. and schraefel, m.c., Bridging the Gap: Using IR Models for Evaluating Exploratory Search Interfaces. First Workshop on Exploratory Search and HCI at SIGCHI07, (2007). Wilson, M.L., schraefel, m.c. and White, R.W. Evaluating Advanced Search Interfaces using Established Information-Seeking Models. JASIST. Yee, K.-P., Swearingen, K., Li, K. and Hearst, M., Faceted metadata for image search and browsing. Proceedings of the SIGCHI Conference on Human Factors in Computing Systems, (New York, NY, USA, 2003), ACM Press. 401-408 Zhang, J. and Marchionini, G., Evaluation and evolution of a browse and search interface: relation browser. Proceedings of the 2005 National Conference on Digital Government Research, (2005), Digital Government Research Center. 179-188
Technical Report 1513520080128