describe the rationale for a visual parallel language and. its use through all ... gram consists rather of a bunch of components inter- ..... Meander Library (MEAL).
A Visual Approach for Developing, Understanding and Analyzing Parallel Programs Guido Wirtz FB Elektrotechnik und Informatik, Universit¨at–GHS–Siegen, Siegen, GERMANY, H¨olderlinstr. 3, W-5900 Abstract Programming languages based solely upon plain textual representations inherit the textual linearization drawback. When writing parallel programs this shortcoming places an additional burden on the programmer because the most interesting parts of a parallel system are not linear. The bunch of existing visualization systems justifies the overall need for graphical methods in parallel programming. We argue that graphical support for all phases – namely program development, analysis and visualization – results in a more useful programming environment than a textual language supplemented by a set of isolated visualization tools. We describe the rationale for a visual parallel language and its use through all phases of program development in the Meander programming environment.
1
Introduction
The overall goal of the Meander project is to provide a helpful programming environment for explicit parallel programming of distributed memory machines. Parallel programming is harder than writing sequential code. This is especially true when working in an explicit message passing paradigm where the user takes full responsibility for detecting parallelism, process system design, managing sequential and parallel control as well as synchronization and provision of data, mapping and overall correctness and efficiency. Besides all those additional steps not needed in a sequential program, the real problem is the inherent complexity of parallel control which is primarily due to the change from a strict linear flow of control to a partially ordered set of events only ordered through explicit synchronization. Essentially, a parallel program consists rather of a bunch of components interconnected by a complex system of relations describing causal ordering, dependencies, communication channels etc. than a linear list of executable blocks. Because of its inherent need for linearization, the traditional textual representation of programs is by no means adequate for describing parallel systems in a
manner which is easily understood by the programmer or useful for communicating a parallel program to a colleague. There do exist many tools which support some steps in the development of explicit parallel programs, especially in the area of visualizing the concrete race of a program, e.g. [6], [8], or [1]. Most of these tools put their focus on performance measurement, not on a better program understanding. Even worse is the fact that almost all approaches start with the parallel program coded in a textual manner, give no direct support for the core program development and share a common drawback: the representation used to develop a program is completely different from those of the tools which are needed to understand the program. We argue that a language which relies on graphical representations for the parallel aspects of a program provides a better basis for all steps of parallel program development, because the original representation of the program developed by the programmer, (i) eases the formulation of interacting, partially ordered program parts, (ii) makes complex relations between parallel tasks more understandable, (iii) displays results of the program analysis, (iv) visualizes a concrete run of the program and (v) displays performance data. The need for graphical representations during all steps of parallel program development has been recognized by some authors for years (cf. [5] for an overview). Some approaches use graphical formalisms close to that of Meander. In [12], a graphical basis for visualization is obtained by program analysis and no support is given for program development. For the Petri-net based work of [3], the focus lies in performance prediction. PFG [11] models control flow as well as data access in a graphical manner. The control flow part seems to be close to our approach although PFG works on shared data and hence uses a different underlying computation model. The Schedule environment [2] is explicitly dedicated to the development of large scale numerical programs but unfortunately restricted to shared-memory machines and based on Fortran.
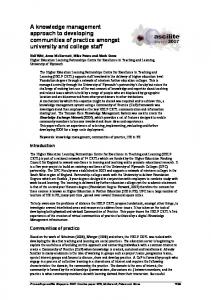
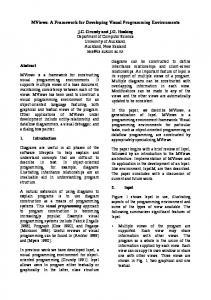
Figure1: Meander graph editor In contrast to various approaches for visual programming dropping the textual metaphor as far as possible, we do not propose the use of graphical representations for all aspects : purely sequential parts should be formulated in a textual imperative language. A clear guideline built into the language distinguishing isolated sequential program parts from parts which have observable effects for the entire parallel system is of great help for the programmer. It permits the abstraction from details and makes graphical representations more readable. There is no absolute need for graphical methods in small sequential code fragments because the textual representation seems to be adequate. Moreover, there is an acceptance problem w.r.t. purely visual languages, at least in a community like that of supercomputing. Poor acceptance must not be answered by increased puritanism but by methods supplying helpful tools today.
2
The Meander language
The Meander language is a hybrid language built up from a fixed set of graphical nodes. The graphical constructs are quite similiar to the building blocks of the CSP [7] language (although deterministic). The core of a Meander program, the so-called specification graph, is a finite, directed, loosely connected graph which consists of graph fragments connected by typed edges. A graph fragment is a subgraph which is embedded into its host graph by at most one incoming and one outgoing arc of type causal in a directionrespecting manner. Edges of this type model the sequential flow of control and data. The graph syntax is simple: each correct specification graph is strictly hierarchical. That implies that all causal path forked at the same node join at the same unique corresponding node. Parallelism is introduced by means of a cc/wc (stands for create-child/wait-child) graph fragment. Between these nodes there has to be (i) exactly one graph fragment which is embedded by causal arcs
and (ii) at least one additional graph fragment embedded via the process creation (causal) arcs. Fragment (i) specifies the amount of work to be done by the process which executes the process creation; each fragment (ii) specifies an additional process. All these fragments will be executed in parallel and the creating process is delayed after executing its fragment until all created processes have been terminated. Each maximal chain of graph fragments reachable by causal arcs only, constitutes a process of its own. Sequential aspects are formulated in ANSI--C. The annotation function defines an appropriate sequential code fragment for each node of the specification graph (executable statements, storage manipulation or expressions). Data structures are handled in the C manner but visibility and environment rules are extended to allow restricted subgraphs and modules to form nested blocks. The global base environment holds all parts of a program which are not directly executable, i.e. typedefs and function definitions. This environment is available at the start node of each process and propagated along the causal edges. There is no environment sharing between processes. Communication is represented explicitly via special snd/rcv-nodes and directed communication edges starting (ending) at the sending (receiving) node, respectively. Each communication node is annotated by a reference to the data which are to be sent (where data are to be received) and the sizeof the message. Communication edges block both nodes (and, hence the processes) until communication takes place. We use explicit communication edges because communication between two processes introduces additional constraints on the execution order of the entire system. Conditionals and loops are similiar to Dijkstra’s guarded commands as used in CSP [7] but locally deterministic by introducing unique priorities. Each alternative of an alt or do consists of a special guard-node controlling the execution of the following sequential graph fragment. Boolean conditions are permitted as well as communication nodes1 . The screenshot in Fig.1 presents a Meander specification graph defining a process system consisting of five processes: after some initialization in the master process (node 1), the cc starts four additional processes (chains starting at the X–marked outgoing arcs to 20, 50, 60 and 70) and executes its own chain (3–5). The middle chain (20–32) models a buffer 1 Graphical support for the modular design of programs and for data parallel process systems with lots of replicated processes having a regular internal communication structure (e.g. grid or torus) is also available in Meander. We confine our representation here to the plain language.
process which serves write requests from the procducer process (50–55) and read requests from two consumer processes (60–64 and 70–76). The buffer is initialized by receiving (21) it’s intended buffersize from the master (3) (thick communication line), afterwards allocating its buffer (22) and entering a service do–loop (23–30 fragment) consisting of three guard lists: each guard controls the connection to one of the producer/consumer-processes; whenever the buffer is not empty and a consumer is blocked by its rcv (62 or 73), the next buffer item is send out (vice versa for the producer connection (53-24)). The producer and the consumers do some iterative work in a simple do–loop controlled by a single boolean guard (52, 61,73). If the boolean become false during execution, the loops are left and the processes become ready to terminate. Only iff all three processes have left their loops and no more communication with the buffer is possible, the communiation guards of the service loop become false and the buffer leaves its loop (distributed termination). Afterwards, the buffer checks its content w.r.t. unused items, reports them to the master (325) and is also ready to terminate. Because all childs started at the cc are now ready to terminate, the master is able to execute the corresponding wc (6) and terminates itself afterwards. Besides the specification graph itself, Fig.1 displays a typical situation when using the Meander graphical editor: files with annotated code (file names correspond to the node numbering) are opened via a context menu in order to edit sequential code, communication scripts or expressions.
3
Benefits of the visual language
We now stress the benefits of Meander by sketching it’s use during all phases of parallel program development. The most significant improvements achieved, are due to the easy understood language in early phases of program development and coding and the overall uniformity of formalisms for program specification as well as for displaying results of program analysis and tracing program runs.
3.1
Program development and coding
The graph editor (see Fig.1) supports a flexible method of building pieces of the final program, performs incremental analysis based on graph fragments and links wellformed pieces to complex process systems. This approach resembles the way in which a programmer draws sketches of the system, implements parts of it step by step in a top-down or bottom-up manner. The graphical view of the program shows clearly the structure of the so far developed process system in each stage.
Folding and unfolding of the specification graph eases focussing on interesting new developed parts of the program or changing the focus arbitrarily. The most useful abstraction levels to work with when trying to understand a complete process system are the task view and the phase view (both supported by the graph editor). The former collapses the specification graph to a hierarchical task graph where each node represents one process. If the user is interested in the communication connections between processes, all communication edges between two processes in the task graph are collapsed. Based on this view, it is easy to perceive which processes interact and which processes are rather independent. The phase view is somewhat more detailed by breaking all processes in a chain of phases where the different phases in a process are defined by nested parallelism. Whenever a process executes a cc (or a wc), it enters a new phase in the sense that the set of processes running in parallel with that process changes. Because communication is only meaningful between phases which are executed in parallel, such errors are perceived in an early phase of program development.
3.2
Static program analysis
Errors w.r.t. graph syntax are ignored until the user asks the system to analyze a fragment (no syntaxdirected editing). Illformed parts are marked and selected to permit the user to incorporate suitable corrections. Errors detected by the static analysis of C code are displayed by marking the node to which the code is annotated and displaying the code as well as the C environment available at this point in a textual editor window. Much more complex work has to be done when searching for possible deadlock constellations. The system uses the phase graph structure as the starting point to find simple structural communication errors automatically. A more in-depth analysis is based on the partial order defined by the edges of the specification graph. Thus, approximate information about structural possible errors of the program obtained solely from the graphical structure while ignoring the C-Code (e.g. expressions in guards) is available before transforming the specification and trying a run on the parallel machine. Clearly, this kind of analysis often results only in warnings about situations which may be ok but the analysis component is not able to disprove the error because it depends on the C-code (conservative analysis). Such errors and/or warnings are displayed by colouring the communication edge(s) and relevant phases in the phase graph as well as in the original specification graph.
3.3
Logical stepping
In order to give the user a chance to investigate possible deadlocks in more detail, a sort of logical stepping based on the partial order defined by the specification graph and a simple nondeterministic-interleaving semantics for the language is supported, too. The user may, for example, look at all nodes which are concurrently enabled with a set of previously selected nodes or fix a node as a barrier and look for the maximum progress the entire system can do without executing the fixed node. The interface used here is the same as for tracing runs post-mortem (see below). Although only a vague approximation of a real race, this kind of symbolic execution is very useful to get a better understanding of the program under development. Moreover, it is an ideal setting for explaining typical parallel program bugs like illegal assumptions on the execution order which are not explicitly coded into the system by means of synchronizing communication.
3.4
Mapping
The task view is also used in the next step of development as the source of the process–processor– mapping. The target of the mapping is the socalled hardware–interconnection view, a graph holding a node for each processor available, connected via annotated edges describing the communication facilities between the processors. In the case of the Transputer target system, this graph is generated by parsing the HeliosT M resource map [10]. Typical node attributes are processor type, available memory or access to external facilities like disks. Edges may be used in two ways: only processors are connected by edges which are also connected via a direct transputer link; alternatively, all nodes are connected by an edge but the edge is annotated by the link-distance, i.e. the number of nodes to be crossed in order to establish the connection. At the current state of the system, mapping is supported by combining the task view and the hardware view to a mapping view which is used by the programmer to specify the intended mapping by colouring the nodes of both graphs in a consistent way. Alternatively, a brute-force algorithm is used by the system and the result is displayed by means of the mapping view.
3.5
Program enhancement after a run
The steps described so far are prior to the generation of compilable and executable source-code. A major benefit of our approach is that the specification graph view (as well as the additonal views described above) is also utilized for the entire bunch of visualization methods which can be applied after a concrete program runs on the parallel target ma-
chine. A well known problem with visualization of parallel systems is the fact that instrumenting the original code by statements which store and output timing/performance information may have a significant influence on the concrete race. Decreased performance is one of the points to be mentioned here. More serious are effects where the situation to be analysed is heavily based on the timing and load of the target system. Instrumenting the code may prevent the system from entering exactly that trouble state of a previous non-instrumented run one is looking for. Instrumentation of the code for tracing is only performed iff requested by the programmer. This is done in the graph editor by supplying single nodes or entire graph fragments with visualization attributes. The low I/O–performance of the Transputer target system was the primary cause for not supporting onlinetracing. The trace facility may be configured by the user w.r.t. the number of messages the trace storage of each user defined process may hold before it is written as a single block onto the external file system. If the user expects the program (during the test phase) to crash, each single message may be written onto file in order to run a visualization of the program afterwards as close as possible to the critical point. However, our trace facility is not a debugger and its use for this kind of problems is restricted. On the other hand, if memory is not critical the entire trace information may be put into the file prior to the termination of all user processes in order to minimize communication overhead.
3.6
Run-based tracing and stepping
In contrast to logical stepping, the visualization of a trace based on the data of a concrete run gives much more precise information about the divergence between expected and real behaviour of a parallel program. Especially, the decisions taken in guarded commands, the number of loop iterations, the size and number of messages as well as the concrete timing is known and may be visualized on the basis of the specification graph. Because the information present after a run may be too detailed, comfortable and easy-touse ways to rule tracing are essential. The general interface for tracing is a restricted graph editor view only permitting changes w.r.t. visualization but no structural changes of the specification graph supplemented by a recorder-like controller. The Meander trace facility supports two general strategies: continuous play mode and stepping. Using the play mode, the tracefile is executed in execution time ordering. Granularity of time steps and the scaling of the execution time to a trace time are user-controlled via global trace parameters. The
play mode can be controlled by user-defined breakpoints and the recorder interface (play, stop, pause, ff, rew). The start time and end time of a visualization may be changed by the user as long as both values are within the range of the overall execution time. Parts of the specification graph may be collapsed and/or marked as being of no interest for the visualization and displayed in a disabled mode. Executing events of this kind in a trace has no visible effect on the display. Past, present and future of a trace are presented by different node colours. Communication is shown by highlighting the corresponding communication edges as well as the nodes. Play mode is useful to get a first insight into the details of a run. Afterwards breakpoints may halt the visualization and give the user a chance to change granularity and scaling of visualization time steps. If the user is interested in a specific situation, changing the mode to stepping at a breakpoint is a good idea. Stepping permits additional control over the visualization by selecting nodes in the specification graph, stepping to the next execution of a selected node (iff any) or its direct successor. This mechanism is also used in nested do fragments in order to step over an entire iteration by selecting the do node etc. The most useful kind of information obtained in this way is an insight into constellations w.r.t. guarded communication and chosen alternatives in conditionals because these statements tend to be rather complicated in practice. Moreover, if a part of the program is stuck in a deadlock or some nodes are blocked over an unexpected time period, such errors and performance bugs are easily recognized in the original specification.
3.7
Performance visualization
If the overall behaviour of a program is understood and interpreted to be correct, a more close look at performance is needed. A normal trace file holds information about the time consumed by single nodes, transmission of data etc. This data are processed by the visualization component and annotated to the specification graph as attributes (absolute and relative values w.r.t. a single process or the entire process system). A user is able to inspect the graph and read this information. Most of the time, coarse-grained data are of more interest, e.g. the entire time spent by a process, the overall communication/computation time ratio and so on. The task view and the phase view will often deliver sufficient details so that we also support these views during visualization. Besides the data extracted from the program run directly, data of the target hardware like cpu load or link usage are of
additional interest. This information could be used to improve the mapping strategy. We use here the already available mapping view. Because the focus of our work in visualization is on the aspects of program logic, not on performance, we have built an interface between our trace files and the Paragraph system [6]. Thanks to the authors which made this tool available, we can provide a great variety of additional displays for performance debugging with low cost using a compatible trace format. The Paragraph system is not integrated into our system but can be used independendly after using an extra program to transform our tracefiles.
4
Additional Meander components
Besides the parts already sketched in the previous sections, there are two components of further interest. The analysis/transformation unit checks specifications and performs a source-to-source transformation. Program analysis is done incrementally. We use the public domain C-frontend lcc [4] as the basis of our own analysis. The transformation component translates correct specifications into a bunch of source code for the processes, generates a makefile to compile all sources and a script file which is used to load the compiled executables onto the target architecture. Code generation is strongly supported by the Meander Library (MEAL). It provides a couple of units to organize process systems as well as the communication services which are not directly present in the used target software architecture. The most important points here are mechanisms for communication handling which are implemented in Meander using the socket level of HeliosT M [10]. All components (except the libraries, clearly) work interactively based on a common user interface which is controlled by the Graph Editor (see Fig.1). Besides the back-end, all parts are hosted on DecStations (using C++, X11R5 and the InterViews-3.1 toolkit [9]). Communication between the front-end and backend (a Sun–Transputer–interface) is done via NFS– mounted file systems.
5
Conclusions
We have presented the overall rationale and design for a visual parallel language and discussed it’s benefits during the main phases of parallel program development. The experiments with the already functioning prototype show that our strategy to mix up textual and graphical formalisms is a promising way to go. At the current state of the system, enhancing the prototype and adding functionality is of primary interest for the near future. Work on the design of
more iconic constructs and displaying graphs at different folding levels in a manner which looks always nice to the user and still provides realistic response times is under way.
References [1] Bemmerl,T., and Braun,P. Visualization of message passing parallel programs. In CONPAR92 - VAPP V, Lyon, France (Sep 1992), LNCS 634, pp. 79–90. [2] Dongarra,J., Sorensen,D., and Brewer,O. Tools to aid in the design, implementation, and understanding of algorithms for parallel processors. In Software for Parallel Computers (Jan 1992), R. H. Perrot, Ed., UNICOM Applied Information Technology, pp. 195–220. [3] Ferscha, A. A petri net approach for performance oriented parallel program design. Journal of Parallel and Distributed Computing 15, 4 (Aug 1992), 188–206. [4] Frase, C. W., and Hanson, D. R. A code generation interface for ANSI C. Software— Practice & Experience 21, 9 (Sep 1991), 963–988. [5] Glinert, E. P. Visual Programming Environments – Paradigms and Systems. IEEE Society Press, Los Alamitos, CA, 1990. [6] Heath, M. Visual animation of parallel algorithms for matrix computations. In Proc. 5-th Distr. Memory Conf. (Apr 1990), D. Walker and Q. Stout, Eds., IEEE, pp. 1213–1222. [7] Hoare, C. A. R. Communicating Sequential Processes. CACM 21, 8 (Aug 1978), 666 – 677. [8] Hollingsworth, J., Irvin, B., and Miller, B. P. IPS Users Guide Version 5.0. Univ. of Wisconsin-Madison, Sep 1992. [9] Linton, M. A., Vlissides, J. M., and Calder, P. R. Composing user interfaces with InterViews. Computer 22, 2 (Feb 1990), 8–22. [10] Ltd., P. S. The Helios Operating System. Prentice-Hall, Englewood Cliffs, N.J., 1989. [11] Stotts, P. D. The PFG language: Visual programming for concurrent computation. In Proc. Int. Conf. on Parallel Processing (1988), pp. 72– 79. [12] Zernik, D., Snir, M., and Malki, D. Using visualization tools to understand concurrency. IEEE Software 9, 5 (May 1992), 87–92.