8th International IEEE EMBS Conference on Neural Engineering Shanghai, China, May 25 - 28 , 2017
A Wearable EEG-based Drowsiness Detection System with Blink Duration and Alpha Waves Analysis ∗ DEI,
V. Kartsch∗ , S. Benatti∗ , D.Rossi∗ , L.Benini∗‡ University of Bologna, Italy. Email: {victorjavier.kartsch, simone.benatti, davide.rossi,luca.benini}@unibo.it ‡ Integrated System Laboratory, ETHZ, Zurich, Switzerland. Email:
[email protected]
Abstract—Drowsiness is one of the most prevalent causes of accidents in mining, driving and industrial activities carrying high personal risks and economic costs. For this reason, automatic detection of drowsiness is becoming an important application, and it is being integrated in a large variety of wearable and deeply embedded systems. Relevant effort has been spent in the past to quantify the drowsiness level from behavioral features exploiting eye tracking systems, dermal sensors or steering wheel movements. On the other hand, all these approaches lack of generality, they are highly intrusive and can only be applied in specific circumstances. A promising alternative approach is based on the extraction and processing of physiological features from the EEG using Brain Computer Interfaces (BCI). This work describes a wearable system capable of detecting drowsiness conditions and emitting alarms using only EEG signals, with three levels of alarm based on the blink duration and on the spectral power of alpha waves. This implementation aims to replace or complement the use of cameras and other sensors, extracting drowsiness information exploiting both behavioral and physiological features from EEG sensors only. The system was validated with 7 test subjects achieving detection accuracy of 85%, while being much more lightweight and compact than other state of the art methods.
is PERCLOS (percent of time with eyelid closed at least 80%, measured in a minute-long time window). The extraction all these parameters is usually done exploiting high-resolution cameras. The inconvenience of these computer-vision methods resides on the high computational power and complex hardware required to process the images, without forgetting that these systems just work in specific angle and illumination conditions. Also, portability is difficult since the cameras are fixed and require careful tuning of the position [9].
I. I NTRODUCTION
Taking this in consideration, this work introduces a system capable to provide drowsiness alerts using only the information coming from the EEG signals, combining physiological with behavioural features analysis, significantly improving the generality, accuracy and compactness with respect to previous solutions. The proposed approach relies on three different level of alarms. The first level is extracted from the EEG eye-blink artifacts, taking in consideration that the increase of the blink duration have been proven to be a good indicator of drowsiness [13][14]. The second level is coming from the presence of small alpha waves bursts that are present in drowsy conditions as proven by previous investigations [15]. The third level, also related to the presence of alpha waves, detects the complete closure of the eyes [16] by considering the constant presence of alpha waves for a given time.
Accidents involving human-driven vehicles are one of the main safety challenges in several fields, such as transportation, automotive, and manufacturing, causing more than 1500 fatalities and 71,000 injuries in the USA alone [1]. Fatigue has emerged as one of the most prevalent causes of earth-moving equipment accidents within the mining industry (large vehicles such as bulldozers and excavators), public transportation (buses, trains, planes, etc) and manufacturing industry (production line, crane operations, industrial soldering, etc.) [2]. During the last years, technology enhancement has enabled several techniques for addressing fatigue monitoring and drowsiness detection in deeply embedded systems. The automotive industry is exploring solutions based on invehicle sensors to monitor and prevent dangerous situations, making the vehicles smarter. For instance, lane detector systems [3] or semi-autonomous drive supports [4] have been proposed as indirect indicators of the driver’s level of fatigue by scanning driving profile changes. Other systems focus on the physical behavior of the driver to determine drowsiness level, for example, analyzing eye movements. The studies carried in [5] indicate the correlation between eye parameters (frequency and duration of blinks) with drowsy conditions. According to [6], the blink duration is increased when drowsiness is appearing and the test subject can be cataloged as Drowsy if the duration is longer than 500 ms. Also, in [7] and [8], a long blink is used as an indicator for micro-sleeps. Another important eye parameter
978-1-5090-4603-4/17/$31.00 ©2017 IEEE
The analysis of physiological features extracted by the EEG is proposed to overcome these problems. Indeed, it has been demonstrated that the accuracy of driver drowsiness detection by using physiological signals is very high compared to other methods such as vehicle-based measures [10]. Different rythms (Alpha, Beta, Theta, Gamma) can be separated and used to determine drowsiness conditions. However, the variability of the brainwaves levels among subjects suggests that a purely physiological analysis is not sufficient to generalize the drowsiness detection [11], [12].
Other more complex techniques are currently investigated in laboratory conditions, mostly in offline mode, achieving accuracy between 80-90% [17][18]. The inconvenience of these techniques resides on the computational power required. Instead, the simplicity of the proposed implementation, where multiple parameter are extracted only from EEG, allows the correct identification of the drowsiness with 85% of accuracy, comparable with the mentioned methods while using a fully wearable device. Thanks to these features, the proposed system can be either used as stand-alone component or in conjunction with cameras or other methods to push energy efficiency and accuracy higher.
251
Fig. 1. Hardware Block Diagram
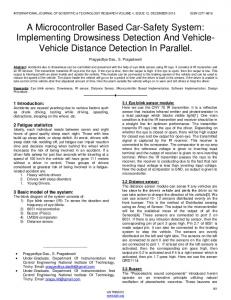
II. S YSTEM S ETUP The technique for drowsiness detection presented in this work is based on the behavioral and physiological study of the subjects through the use of EEG signals. To evaluate the behavior of the EEG signals and the extraction algorithms, raw data from three test subjects was taken. After this, the working principle of each level of the algorithm was evaluated separately for calibration using the hardware presented on Fig. 1. The final alarm system was validated with 7 test subjects. In this section we will detail the 3-Level Alarm systems, discussing at each level the selection of the corresponding feature and detection method, to finally expose the embedded implementation. A. 3-Level Alarm System The selection of the features is performed considering the information provided by previous research projects where large number of test subjects were involved [19]. The following sections present the three levels of alarms, explaining in detail the selection and extraction of the corresponding feature. In this regard, current systems can have binary [19] or multiple [1] indicators of drowsiness. The selection of three level of alarms balances this to keep low computational complexity, still providing clear indicators of increasing drowsiness as the same as extending the range of detection to overcome inter-individual differences. LEVEL 1 - Blink duration (BD) Alert: The estimation of the blinking time is done by analyzing the EEG signal in the frequency domain, since it has more easily identifiable patterns than in the time [20], where only the 1 Hz spectrum power is of interest since it gives the most significant difference between open/close events during a blink. For each blink a presence of two peaks is highlighted (high and low) in correspondence to the opening and closure of the eyelids (Figure 2). The blinking time is calculated considering the distance and difference in amplitude between the two peaks. The algorithm detects these peaks and calculates the time value. This approach relies on the calculation of the Short Time Fast Fourier Transform (FFT length is 512 samples with Hamming window at 500Hz of sample rate). During a series of blinks, it is possible to see the presence of a high and a low peak for each blink, in correspondence to the potential changes induced by the eyelid movements, due the drifted DC to the subsequent frequencies. Another observed parameter is the amplitude of the two peaks in between an eye blink. To quantify these parameters, EEG signals containing short blinks (SB)(< 400ms), medium blinks (MB)(< 650ms), large blinks (LB)(> 650ms) and eyes open while moving the eyeball (NB) were evaluated. The results of the evaluation are presented in the table I. This experiment confirmed that the amplitude increases for longer blinks. Although the algorithm uses the time difference to determinate the duration, the
Fig. 2. Blinks in time and frequency domain (STFT at 1Hz)
amplitude difference served as a filter to eliminate artifacts (fast eye movements, saccades, etc), since they have smaller amplitude than the regular-long blinks. For the integration with the final algorithm, the extracted blinking time is evaluated in a window of 20 seconds, as suggested by previous investigations [19]. The time of every blink occurrence in this window is then summed and averaged. The alarm is triggered only if the average time goes over a given threshold (>500ms [6]). Only the peaks with a normalized amplitude difference greater than 0.02 are counted. The blink duration serves as a mechanism to provide an early alert before the sudden sleep occurs. This is the motivation for leaving this at the first level on the alert hierarchy. LEVEL 2 - Cumulative Alpha Waves (CAW) Alert: This level detects small bursts of alpha waves (7.5−13Hz) caused by drowsy conditions. The detection of the alpha waves is done by using a threshold detector. This is applicable since the alpha waves have a typical amplitude higher that other brain waves [16]. Two features were compared for this purpose. The former is obtained in the time domain by filtering the alpha waves from the other signals. After that, the envelope (Root Mean Square Envelope) of the resulting signal is calculated. The latter is extracted in the frequency domain by calculating the Power Spectral Density (PSD) of the alpha waves. Finally, the event detection is done comparing the extracted features with given thresholds tuned up by studying the produced alpha waves while open/close the eyes. This evaluation also decreases the inter-individual differences in term of AW amplitude. Table II presents the values of sensitivity and specificity for the optimal threshold values in both approaches. The PSD method was finally used for the embedded implementation since it shows better performance. This allows also to reduce computational load since the PSD is already calculated in the previous level. Finally, in order to decrease the effects of noise and artifacts using PSD, the algorithm was adapted to detect alpha waves only if no other smaller frequencies (0-7 Hz) have energy above the selected threshold.
252
TABLE I N ORMALIZED A MP. DIFFERENCE FOR DIFFERENT BLINKS AND D ETECTION ACCURACY TSn SB MB LB NB Accuracy* % TS1 0.03 0.168 0.308 0.01 92 TS2 0.03 0.168 0.290 0.009 93 TS3 0.03 0.167 0.302 0.01 87 Avg. time 0.367ms 0.61ms 1.174ms *The accuracy was calculated taken into consideration the difference between the measured value and the definition of blink duration for EOG [21].
DSP libraries provided by ARM, where the FFT calculation is performed after the acquisition of the required 512 samples. Later, the magnitude of the FFT vector is calculated and used by the feature extraction algorithm at the corresponding frequency of interest (1 and 7.5 − 13Hz). The memory footprint required for the execution of the complete algorithm is less than 10kB. Finally, it is possible to stream the outputs to an external device to plot and store the results using a BT module connencted via UART to the microcontroller.
Fig. 3. PSD and RMS method of extraction TABLE II C OMPARISON OF THE RMS AND PSD METHOD FOR ALPHA WAVES DETECTION USING OPTIMAL THRESHOLD
Method Threshold Sensitivity Specificity RMS 0.4 0.882 0.934 PSD 0.2 0.900 0.997 The metrics used here were selected considering their common use in other investigations [22] [23].
For the integration with the final algorithm, as previously mentioned, the time of presence of the alpha waves is captured and accumulated in a 20 second window. The cumulative occurrence of alpha waves for more than 5 second is considered as an indicator of a intermediate drowsy state, following the standards given by the Objective Sleepiness Scoring (OSS)[15]. This gives the motivation to locate it at the second level. LEVEL 3 - Alpha waves 3 seconds(AW3S) Alert: The presence of alpha waves for more than 3 seconds is detected here, since it indicates the complete closure of the eyes [16], caused by a sudden sleep or total loss of attention. The alpha waves are extracted using the same methodology presented at the level 2 but without considering any window for emitting the alarm, aiming to provide a shortcut for a fast notification. Given the risk that represents this behavior, it was located at the maximum level. Figure 4 shows a block diagram that summarizes the algorithm implementation. B. Embedded Architecture The proposed setup is designed to optimize the tradeoff between performance and power consumption, since the target is the embedded implementation of a wearable BCI. A block diagram of the proposed setup is presented in Fig. 1. A low power STM32F407 ARM Cortex M4 microcontroller, an ADS1298 (8Ch, 24-bit, 0.25-32KHz S/r, PGA:1-12) deltasigma ADC designed for bio-medical acquisition [24] and a Bluetooth module are integrated on a single board, as presented in [25]. The MCU acquires data from the ADC through the SPI peripheral, using a state machine structure that collects and process the data containing the sampled values of 2 wet electrodes (Fpz - Oz) connected to one differential channel. Once finished, it executes the detection algorithm and manages the system. The code was implemented in C language using the STM32 Workbench IDE. The calculation of the PSD is done making use of the CMSIS-
III. E XPERIMENTAL R ESULTS A. System Validation The behavioral and physiological features used on this work allowed the validation of the system using simulated conditions. This approach has the advantage of not exposing the subject to dangerous conditions and has been used extensively in other researches [28][26]. For this purpose, 7 test subjects have participated. The test was performed in the late night, when the test subjects were already tired and more prone to drowsy conditions. Each test subject simulated the different alarm conditions 5 times. To assess the first and the second levels of alarm, the test subject was asked to maintain the alarm condition for the duration of the evaluation window (20 sec). If the condition was not detected (threshold not reached) it was categorized as a fail. In the case of the third level, the test was considered a fail if the detection was not done within 5 seconds. Figure 5 shows the results for each level of alarm where the average accuracy is equal to 85%. From this, it is also possible so see that the Levels 2 and 3 have lower values of accuracy. Many factors can be attributed to this situation (environmental noise, artifacts, individual differences). A test with a larger number of test subjects, planned for a future research, can clarify this behavior. In order to assess the efficiency of the final hardwaresoftware implementation, energy consumption parameters were extracted while the device was running. Due to the low duty cycle of the microcontroller (10%), energy saving was possible by putting the device in sleep mode when possible. Table IV summarizes the results. Similarly, the prediction time was extracted. The alarm outputs were available 0.7 ms after the reception of the required samples. These results were achieved thanks to the software architecture presented on II-B, where all the features are extracted only from the PSD. Table III presents a comparison between the proposed implementation and others the State of Art (SoA) models. Most of the new implementations use bench-top PC to evaluate the drowsiness indicators since they require more computational effort, like in the case of Neural Networks
Fig. 4. Algorithm Block Diagram
Fig. 5. Detection accuracy of the different levels
253
TABLE III C OMPARISON BETWEEN THE DIFFERENT S OA SYSTEMS AND THE CURRENT IMPLEMENTATION Author [22] [17] [18] [26] [27] This Imp
Method EEG, Pw variations EEG, Neural Network EOG, Neural Network Cam, Eye parameters NIRS, EEG, Alpha Pw EEG, Blink Dur and Alpha Pw
Advantage No training, online Single EEG Channel Automatic Training Real Time Portable Mult. features, Reduced. HW, No training
[17]. This approach cannot be implemented on embedded systems due to the high computational requirements. The proposed solution oversees these problems since it leverages much simpler algorithms exploiting behavioral parameters. Many of the presented approaches are obtained in laboratory conditions in offline mode [17][18][29], while the proposed implementation is fully online, wearable and tested in a real environment. Moreover, by using the current technique for the blinking duration is possible to replace or complement computer vision methods [26][9] with a significant reduction in energy consumption. Concerning other wearable approaches, [27] introduced a low power device capable to operate for 5 hours with a 200mAh battery. The system fuses EEG signals and NIRs classification to measure only brain activity not exploiting behavioral features. Our implementation, thanks to the extraction of behavioral and physiological features only from the EEG signal, is capable to obtain a better accuracy with a simpler algorithm and fully portable hardware, achieving 42% more energy efficiency. Still, some improvement can be done in terms of electrode interface. Wet electrodes may not be suitable for day-today use. Also, noise reduction is an important issue, since EEG signals can be easily distorted. Recent developments have proposed earplugs for EEG detection [30] as well as small flexible dry electrodes [31] to overcome these issues. Future research will focus on these issues and on improving algorithmic robustness. IV. C ONCLUSIONS This work presents a drowsiness detector for a minimally invasive wearable system based on a single EEG channel. The combination of behavioral and physiological indicators allows the design of an energy efficient algorithm, that reaches 85% accuracy in drowsiness detection, with a performance comparable to the SoA camera based systems. Furthermore, as opposed to ASIC solutions, the system is fully implemented using a Commercial Of The Shelf (COTS) microcontroller, hence it maintains the versatility of programmable devices combined to the low power consumption of embedded platforms, achieving 7.1 hs of operation with a 200mAh battery. Future works will target sensor fusion techniques to further improve accuracy and the optimization of the sensor interface. ACKNOWLEDGMENT The research contribution presented in this paper has been supported by the European project EuroCPS (grant n. 644090). TABLE IV P OWER C ONSUMPTION OF THE DEVICE Device ADS1298 STM32F407vgt6
Frequency(Mhz) 2.048 168
Power(mW) 12.5 79.2
Disadvantage Only one feature Training, Offline Complex Arq, Offline Fixed, not wearable, Comp. Hungry Noise, Redundant Measurements Noise, Wet electrodes
Accuracy 85 83 73 94 88-65 90-81
Platform NS L. Computer L. Computer NS Microcontroller Microcontroller
Intrusive % NO YES NO NO NO
R EFERENCES [1] Q. Ji et al., “Real-time nonintrusive monitoring and prediction of driver fatigue,” Transactions on vehicular technology, 2004. [2] “Guide for managing the risk of fatigue at work.” [3] MOBILEYE, http://www.mobileye.com, 2016. [4] Mercedes-Benz, https://www.mbusa.com/, 2016. [5] G. Borghini et al., “Measuring neurophysiological signals in aircraft pilots and car drivers for the assessment of mental workload, fatigue and drowsiness,” Neuroscience Biobehavioral Reviews, 2014. [6] R. Schleicher et al., “Blinks and saccades as indicators of fatigue in sleepiness warnings: looking tired?” Ergonomics, 2008. [7] M. Johns et al., “The amplitude-velocity ratio of blinks: a new method for monitoring drowsiness,” Sleep, vol. 26, p. A51, 2003. [8] Johns et al., “Monitoring eye and eyelid movements by infrared reflectance oculography to measure drowsiness in drivers,” Somnologie, 2007. [9] M. Flores, et al., “Driver drowsiness warning system using visual information for both diurnal and nocturnal illumination conditions,” EURASIP, vol. 2010, no. 1, p. 438205, 2010. [10] A. Sahayadhas et al., “Detecting driver drowsiness based on sensors: A review,” Sensors, vol. 12, no. 12, p. 16937, 2012. [11] H. V. Huikuri, et al., “Heart rate variability in systemic hypertension,” The American journal of cardiology, pp. 1073–1077, 1996. [12] B. H. Friedman et al., “Autonomic balance revisited: panic anxiety and heart rate variability,” Journal of psychosomatic research, 1998. [13] P. P. Caffier et al., “Experimental evaluation of eye-blink parameters as a drowsiness measure,” European Journal of Applied Physiology, 2003. [14] K. Sugiyama et al., “Method of detecting drowsiness level by utilizing blinking duration,” JSAE Review, vol. 17, no. 2, pp. 159 – 163, 1996. [15] A. Muzet et al., “Awake pilot study no. 2: Testing steering grip sensor measures,” CEPA, Tech. Rep. IST-2000-28062, 2003. [16] I. William O. Tatum, Handbook of EEG Interpretation, Second Edition. Springer Publishing Company, 2014. [17] A. G. Correa et al., “Automatic detection of drowsiness in {EEG} records based on multimodal analysis,” Medical Engineering Physics, 2014. [18] X. Zhu et al., “Eog-based drowsiness detection using convolutional neural networks,” in IJCNN, July 2014, pp. 128–134. [19] A. Picot et al., “Drowsiness detection based on visual signs: blinking analysis based on high frame rate video,” in 2010 IEEE Instrumentation Measurement Technology Conference Proceedings, 2010. [20] S. M. A. Delorme, T. Sejnowski, “Enhanced detection of artifacts in {EEG} data using higher-order statistics and independent component analysis,” NeuroImage, vol. 34, no. 4, pp. 1443 – 1449, 2007. [21] A. Anund et al., “Pilot 15—report: Vti,” Swedish National Road and Transport Research Institute, 2004. [22] A. Picot et al., “On-line automatic detection of driver drowsiness using a single electroencephalographic channel,” in EMBC, Aug 2008. [23] J. Park et al., “Wireless dry eeg for drowsiness detection,” in EMBC, Aug 2011, pp. 3298–3301. [24] Y. Zhang et al., “12-lead ecg data acquisition system based on ads1298,” Procedia Engineering, vol. 29, pp. 2103 – 2108, 2012. [25] M. Tomasini, S. Benatti, B. Milosevic, E. Farella, and L. Benini, “Power line interference removal for high-quality continuous biosignal monitoring with low-power wearable devices,” IEEE Sensors Journal, 2016. [26] A. Rahman et al., “Real time drowsiness detection using eye blink monitoring,” in NSEC. IEEE, 2015, pp. 1–7. [27] U. Ha et al., “A multimodal drowsiness monitoring ear-module system with closed-loop real-time alarm,” in BioCAS, Oct 2016. [28] A. Sahayadhas et al., “Detecting driver drowsiness based on sensors: a review,” Sensors, vol. 12, no. 12, pp. 16 937–16 953, 2012. [29] T. Silveira et al., “Automated drowsiness detection through wavelet packet analysis of a single {EEG} channel,” Expert Systems with Applications. [30] K. B. Mikkelsen, S. L. Kappel, D. P. Mandic, and P. Kidmose, “Eeg recorded from the ear: Characterizing the ear-eeg method,” Frontiers in Neuroscience, vol. 9, p. 438, 2015. [31] H. L. Peng et al., “Parylene-based flexible dry electrode for bioptential recording,” Sensors and Actuators B: Chemical.
254