GEODYNAMICS & TECTONOPHYSICS PUBLISHED BY THE INSTITUTE OF THE EARTH’S CRUST SIBERIAN BRANCH OF RUSSIAN ACADEMY OF SCIENCES
2014 VOLUME 5 ISSUE 2 PAGES 387–399
ISSN 2078-502X
http://dx.doi.org/10.5800/GT-2014-5-2-0134
ACCELERATED SYNERGISM ALONG A FAULT: A POSSIBLE INDICATOR FOR AN IMPENDING MAJOR EARTHQUAKE
1
National Key Laboratory for Earthquake Dynamics, Institute of Geology, China Earthquake Administration, Beijing, China 2 Institute of the Earth’s Crust, SB RAS, Irkutsk, Russia
Abstract: It is generally accepted that crustal earthquakes are caused by sudden displacement along faults, which rely on two primary conditions. One is that the fault has a high degree of synergism, so that once the stress threshold is reached, fault segments can be connected rapidly to facilitate fast slip of longer fault sections. The other is sufficient strain accumulated at some portions of the fault which can overcome resistance to slip of the highstrength portions of the fault. Investigations to such processes would help explore how to detect shortterm and impending precursors prior to earthquakes. A simulation study on instability of a straight fault is conducted in the laboratory. From curves of stress variations, the stress state of the specimen is recognized and the metainstability stage is identified. By comparison of the observational information from the press machine and physical parameters of the fields on the sample, this work reveals differences of temporalspatial evolution processes of fault stress in the stages of stress deviating from linearity and metainstability. The results show that due to in teraction between distinct portions of the fault, their independent activities turn gradually into a synergetic activity, and the degree of such synergism is an indicator for the stress state of the fault. This synergetic process of fault activity includes three stages: generation, expansion and increase amount of strain release patches, and connection between them.. The first stage begins when the stress curve deviates from linearity, different strain variations occur at every portions of the fault, resulting in isolated areas of stress release and strain accumulation. The second stage is associated with quasistatic instability of the early metainstability when isolated strain release areas of the fault increase and stable expansion proceeds. And the third stage corresponds to the late metainstability, i.e. quasidynamic instability as both the expansion of strain release areas and rise of strain level of strain accumulation areas are accelerated. The synergism is accelerated when the quasistatic expansion transforms into quasidynamic expansion, with interaction between fault segments as its mechanism. The essence of such transformation is that the expansion mechanism has changed, i.e. expansion of isolated fault segments is replaced by linkage of the interacting segments when the fault enters the critical state of a potential earthquake. Based on the experimental re sults, coupled with data on the temporalspatial evolution of earthquakes along the LaohushanMaomaoshan fault, west of the Haiyuan fault zone in northwestern China, the synergism process of this fault before the 6 June 2000 M6.2 earthquake is analyzed.
Tectonophysics
Ma Jin1, Guo Yanshuang1, S. I. Sherman2
Key words: metainstability stress state, accelerated synergism, information indicative of sure earthquake occurrence, short term and impending precursor.
Recommended by K.Zh. Seminsky
Citation: Ma Jin, Guo Yanshuang, Sherman S.I. 2014. Accelerated synergism along a fault: A possible indicator for an impending major earthquake. Geodynamics & Tectonophysics 5 (2), 387–399. doi:10.5800/GT201452 0134.
УСКОРЕННЫЙ СИНЕРГИЗМ ВДОЛЬ РАЗЛОМА: ВОЗМОЖНЫЙ ИНДИКАТОР НЕИЗБЕЖНОГО КРУПНОГО ЗЕМЛЕТРЯСЕНИЯ Ма Дзинь1, Гуо Яншуань1, С. И. Шерман2 1
Национальная ведущая лаборатория динамики землетрясений, Институт геологии, Администрация Китая по землетрясениям, Пекин, Китай 2 Институт земной коры СО РАН, Иркутск, Россия
387
Ma Jin et al.: Accelerated synergism along a fault…
Аннотация: Обычно принято считать, что причиной землетрясений земной коры является внезапное смещение вдоль разлома при наличии двух основных условий. Первое условие связано с высоким синергизмом разлома, когда при достижении предельного уровня напряжений отдельные участки разлома очень быстро соединяются друг с другом, способствуя быстрому смещению более длинных участков данного разлома. Второе условие заключается в значи тельном напряжении, накопленном на отдельных участках разлома, при котором может быть преодолено сопротив ление смещению высокопрочных участков разлома. Исследование таких процессов может помочь в выявлении крат косрочных неизбежных предвестников, проявляющихся перед землетрясениями. В лабораторных условиях прово дится моделирование состояния нестабильности прямого разлома. Полученные кривые вариаций напряжений позво лили установить состояния напряжений модели и выявить стадию метанестабильности. В данной работе проведено сравнение данных, полученных путем наблюдения процесса на модельной установке, с физическими параметрами полей образца и выявлены различия процессов пространственновременного развития разломных напряжений по стадиям, когда отмечены отклонения напряжений от линейности и метанестабильности. Результаты исследования показали, что вследствие взаимодействия отдельных участков разлома их независимая активность постепенно пере ходит в синергетическую активность, и такой синергизм является показателем состояния напряжений разлома. Про цесс синергетической активности разлома проходит три стадии развития: возникновение небольших участков, где высвобождаются напряжения, расширение и увеличение размеров таких участков высвобождения напряжений и соединение участков, где идет высвобождение напряжений. Первая стадия начинается, когда кривая напряжений отклоняется от линейности, при этом на каждом участке разлома имеют место вариации напряжений, в результате чего появляются отдельные изолированные участки, где происходит высвобождение и накопление напряжений. Вторая стадия связана с квазистатической нестабильностью ранней метанестабильности, когда отдельные участки разлома, где идет высвобождение напряжений, увеличиваются в размерах и продолжается их стабильное расшире ние. Третья стадия соответствует поздней метанестабильности, т.е. квазидинамической нестабильности, поскольку ускоряются как расширение участков высвобождения напряжений, так и усиление уровня напряжений на участках накопления напряжений. Синергизм ускоряется, когда квазистатические трансформации переходят в квазидинами ческое расширение, при этом действует механизм взаимодействия между участками разлома. Суть такой трансфор мации заключается в изменении механизма расширения участков – расширение изолированных участков разлома сменяется на слияние таких участков при их взаимодействии, когда разлом входит в критическую стадию потенци ального землетрясения. На основе данных, полученных экспериментальным путем и дополненных информацией о пространственновременной эволюции землетрясений вдоль разлома ЛаохушанМаомаошан в западной части разломной зоны Хайюань в СевероВосточном Китае, проанализирован процесс синергизма данного разлома перед землетрясением магнитудой 6.2, которое произошло 6 июня 2000 г.
Ключевые слова: метанестабильность, состояние напряжений, ускоренный синергизм, информация, свидетельст вующая о неизбежном наступлении землетрясения, краткосрочный неизбежный предвестник.
1. INTRODUCTION In recent years, due to disaster threat on human caused by major earthquakes, it is increasingly desired that scien tists should offer definite information on seismic hazard to public. However, it is often noted that “the predicted quake is reluctant to come, while unexpected seismic events caught Earth scientists off guard” [Zhang Guomin, 2013]. For example, after the December 2004 Sumatra Mw9.1 earthquake, China Earthquake Administration held a meet ing on future earthquake trends in mainland China in early 2005, and all the researchers attending the meeting ac cepted that major events would occur on the NorthSouth seismic zone in central China in view of the geodynamic context. Intensified studies and monitoring were conducted along this potentially hazardous zone. But such expected shocks did not happen in the following three years. An other regular meeting of the Administration was held in early 2008, when some people began to doubt the previous prediction and thought that an expected major event was unlikely to occur in the near future. Unfortunately, several months later, the 12 May 2008 Wenchuan Ms8.0 (Mw7.9) earthquake hit Longmenshan, the central part of this zone. Among the complicated reasons for this failure in the ef 388
fort of earthquake prediction, one is that the experts usu ally provide answers as “possible or impossible” rather than “yes or no”, i.e. cannot determine which fault will surely generate a major quake, or what time such predicted events will take place given its location and magnitude can be estimated in advance. Actually, people know little about regularities of earth quakes as seismology is a young science. During the past nearly 30 years, models of quasiperiodicity and character istic earthquakes for some faults were suggested [Fedotov, 1968; Sykes, 1971; Shimazaki, Nakata, 1980; Nishenko, 1991] and served as a primary basis for longterm earth quake prediction, i.e. forecasting the occurrence time of an event in the future. The actual events did not, however, coincide with the expected cases. For instance, M7 events occurred at Tokai, Japan in 1707 and 1845, respectively, showing an interval 138 years. Following the assumed re currence model, in 1978 Japanese scientists inferred that a M7 or greater shock should occur at any time in Tokai [Mogi, 1981; Matsumura, 1997; Science…, 2007]. In fact such an event, however, did not appear by now more than 30 years since then. In the Parkfield area, California, US, six M6 events were recorded with a maximum interval 38 years and minimum 12 years, 22 years on average or larg
Geodynamics & Tectonophysics 2014 Volume 5 Issue 2 Pages 387–399
est variation +45 % ~ –72 % [Schwartz, Coppersmith, 1984; Bakun, Lindh, 1985; Shearer, 1958; BenZion et al., 1993]. This observation led to the characteristic earth quake model and a forecast in 1984 that claimed a M6 shock would happen in Parkfield before the year 1993. In fact, such an event did not come till 2004, implying an er ror as big as 11 years. So many similar examples reveal such a common truth that the prediction of the occurrence time for a future quake based on quasiperiodicity has a large uncertainty, although it can help estimate the earth quake trend for a longterm period. Laboratory research shows that in the same conditions, including driving force, loading rate, fault plane and experimental sample, the yielded quasiperiodicity of fault stickslip has errors 5~11 %, which corresponds to errors 15~33 years for a 300year cycle in nature. In fact, recurrence intervals of earthquakes are affected by many factors, of which the most important is that a fault is not an isolated existence, instead merely a boundary of a block, so its motion is jointly controlled by other boundaries of the block. For crustal motion, such errors are tiny, while too big to be acceptable for hazard reduction in human society, much less the errors in nature should exceed far more than that in the laboratory. With hindsight to previous earthquakes, it was stated that some abnormal phenomena appeared before earth quakes, which were summarized as “seismic precursors”. Unfortunately, such claimed precursors did not occur in subsequent events, instead other distinct phenomena were observed. Is it possible to find out diagnostic precursors that are bound to appear prior to earthquakes? To answer this question, much effort was invested in studies involv ing many observational items such as crustal deformation, underground water, seismicity, geomagnetism, geoelectric ity, and gravity. But the diagnostic precursors that have been rigorously confirmed are quite a few [Wyss, 1991, 1997; Cicerone et al., 2009; Chen, 2009; Johnson, 2009; Beroza, Ide, 2009]. The possible seismic precursors that can appear at one place are associated with geological set ting and stress field conditions there. From other angle of view, the stress field will change correspondingly after a major earthquake takes place on a fault, so that the next event on the same site may be different from the last one. Probably this is just one of the reasons why the search for diagnostic precursors is highly challenging. “In spite of extreme difficulties in earthquake prediction, people do not stop or give up their efforts toward this goal” [Chen, 2009]. It is widely accepted that earthquake prediction can be made in long, intermediate, and shortterm and impen ding time scales. It is, however, not clear how to define such scales using a certain criterion. As different faults have their specific recurrence intervals, they can have dif ferent behaviors in the same time scale. In laboratory ob servations, on a stressstrain curve, the metainstability stage begins from the peak stress point and ends at the in stability point, which is the key period prior to the fault rupture [Ma Jin et al., 2012]. For some faults with long
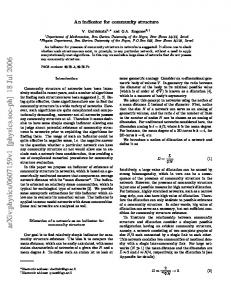
recurrence intervals, the metainstability stage can exceed one year; while for other faults with very short recurrence intervals, one year may account for 1~10 % of the interval which contains the stages of stress deviating from linearity and metainstability as well as the transform process into instability. Therefore, it is more reasonable to study the seismic risk of a fault from its stress state than from its time scale. The key problem is how to link the field infor mation with the critical moments during the stressstrain process in time. The laboratory research has such an advantage that in formation from the press machine can be compared with observed information of physical quantities of a field, which allows us to find out the features of the metainsta bility stage from observations of multiple physical fields. Following this approach, we have conducted observational studies on temperature, fault slip and strain fields in the laboratory. Several individual experiments [Ma Jin et al., 2012; Zhuo Yanqun et al., 2013; Ren Yaqiong et al., 2013; Liu Yuanzheng et al., 2014] show that like specimen analysis, description of the regional overall stress state should not be based on data from single stations, instead the overall evolution of the deformation field should be considered. The instable slip of a fault is a transform proc ess from independent activity of each fault part into syner gism activity of all parts of the fault. When such synergism reaches a certain degree, the fault enters the meta instability stage. Meanwhile deviating of the stresstime curve from linearity marks the start of stress release. From this moment, isolated weakening patches begin to appear on the fault and increase gradually. In the metainstability stage of the fault, stress release becomes gradually domi nant, and synergism is accelerated and tends to be com pleted. The precursor prior to the impending instability is one of the target issues in earthquake research. The laboratory studies mentioned above are of importance for understand ing mechanisms of faults and earthquakes as well as seis mic precursors. When the stressstrain curve deviates from linearity, stress release on the fault begins and increases with time gradually. The key issues include how to recog nize characters of stress release in different deformation stages, how to determine the information indicating that the earthquake is inevitable, and how to combine these research results with data on real seismic precursors. In the following sections of this paper, these issues are addressed based on our laboratory experiments and field observa tions. 2. EXPERIMENTAL CONDITIONS Experimental specimen and arrangement of measure ment sites: The experimental specimen is a 300 mm × × 300 mm × 50 mm granodiorite from Fangshan district, Beijing. It is cut along the diagonal to simulate a straight fault plane. Thirty strain gauges are stuck nearby along the 389
Ma Jin et al.: Accelerated synergism along a fault…
σy
mm 300 S1
250
σx
200 150 100 50 0 0
S2 S4 S3 S6 S5 S8 S7 S10 S9 S12 S11 S14 S13 S16 S15 S18 S17 S20 S19 S22 S21 S24 S23 S26 S25 S28 S27 S30 S29
50
100
150
σy
200
250
σx
300 mm
Fig. 1. Specimen structure, loading directions and arrangement of strain gauges. Small blackandred boxes along fault denote strain gauges. Black numbers S1 to S30 are serial numbers of strain measurement points.
Рис. 1. Структура модели, направления приложения нагрузки и расположение датчиков напряжений. Датчики напряжений, установленные вдоль разлома, показаны как черные прямоугольники с красной полосой. Номера S1S30 означают серийные номера точек замера напряжений.
fault to measure variations of the strain field (Fig. 1), which have resolution 1 με and a sampling rate 100 Hz. These measurements enable us to analyze the temporal spatial process of strain nearby the fault prior to its insta bility. We define that shortening (compressive strain) and elongation (extensional strain) of gauges are positive and negative values, respectively. Loading conditions: Experiments are conducted on a dualdirection servo press machine, of which pressure and displacement are controllable. During tests, a constant pressure (5 MPa) is applied in X direction and controllable displacement at a constant rate (0.1 μm/s) is applied in Y direction. As the included angle between the fault trend and the loading direction is 45°, an average shear stress on the fault is
τ=
σ y −σ x 2
,
where τ is an average shear stress on the fault plane, σy and σx are average stresses at either end of Y and X direc tions, respectively.
390
Measurements during tests on the press machine yield data on the average shear stresstime process of the fault (lower right in Fig. 2). An enlarged curve of its last stage is given below to show details of its deformation from the time 660s to 700s (Fig. 2), on which point O is stress peak, NO denotes the stage seriously deviating from linearity, OAB2 is the metainstability stage of which OA is quasi static release stage, AB2 is quasidynamic release stage, and B2 marks the beginning of real instability. 3. FEATURES OF STRAIN VARIATIONS ALONG THE FAULT IN METAINSTABILITY STAGE The curve of average shear stress with time (Fig. 2) il lustrates several critical moments, N, O, A, B1 and B2, of deformation on the specimen. It is noted that this curve based on data from the press machine represents variations of all portions of the whole fault, while each site records strain processes of different portions. Below we analyze strain measurements of different sites at the critical mo ments on the curve of the average shear stress versus time.
Geodynamics & Tectonophysics 2014 Volume 5 Issue 2 Pages 387–399
N
13.94
A B1 B2
13.92 14.0 Shear Stress τ (MPa)
Shear Stress τ (MPa)
O
13.90
13.88 660
670
13.6 13.2 12.8 0
680 Time t (s)
200 400 600 Time t (s)
690
700
Fig. 2. Curve of mean shear stress versus time (lower right) and enlarged view of the final stage (small red box with blue arrow above). Letters denote moments of significant deformation. See text for detail.
Рис. 2. Кривая среднего напряжения сдвига относительно времени (график в нижнем правом углу) и увеличенный график последней стадии (красный квадрат с голубой стрелкой в верхней части графика). Буквами обозначены моменты значительной деформации (см. пояснения в тексте).
Overall, all site strains (hereafter abbreviated as SS) along the fault accumulate in the beginning stage (positive, compression). After the average shear stresstime curve deviates from linearity (about 500 s), strain variations at different sites begin to diverge. Some sites are of acceler ated compression, while other portions turn into relaxation (negative, extension). Their variation amplitudes range from 0 to 65 με. Profound differences among the sites ap pear relatively later. After ~660 s, the stresstime curve is in proximity to serious deviation from linearity. Therefore, the strain value at moment 660 s is set to be zero to high light variations of strain increments of different portions of the fault in the metainstability stage. After moment 660 s, strains of all portions along the fault can be observed in 4 segments: sites 1 to 8, 21 to 24, 9 to 19, and 25 to 30. In terms of similarity, sites 1 to 8 and 21 to 24 are in one category, and sites 9 to 19 and 25 to 30 are in another category. In the upper segment of the fault (sites 1 to 8), com pression strain is observed as slowly increasing and accel erating; then it rises up suddenly, and this sudden increase is followed by inversion and final instability (Fig. 3, a). Specifically, as shown by curves 6 and 7, compression rates increase at moment N, and continue increasing fur ther at moment O. At moment A, the distance between curves 4 and 5 reduces. At moment B, curves 1, 2, and 3
all rise nearly vertically. By moment B2, curves of all sites exhibit instability with large stress drops, of which insta bility of sites 1 and 2 is behind that of sites 4 and 5 by about 0.2~0.3 s with small stress drops. As sites 6 and 7 begin to release strain, strain accumulation at sites 4 and 5 accelerates. And when site 5 turns into strain release, strain accumulation at sites 2, 3, and 4 speeds up. These proc esses imply that compressive strain between the sites propagates along the fault at a rate that accelerates after the stress peak (see Fig. 3, a). On the middle segment of the fault (sites 9 to 19) (Fig. 3, b), strains rise (sites 9 to 13) or are stationary (sites 14 to 19); then they drop slowly, invert, rise fast close to instability, and finally reach complete instability (except site 19). At moment N, when deviating from linearity, compression strain accumulation on sites 9 to 13 changes into strain release. More sites experience strain drops at moment O. Moment A is the time that many sites begin to speed up their strain release, among which site 19 is most obvious. By moment B1, strain on most of the sites, except site 19, lowers to the minimum and then rises again. And after the culminating moments, the sites enter instability state (see Fig. 3, b). The lower segment of the fault can be subdivided fur ther into upper and lower parts. In the lower part, i.e. sites 25 to 30, strain declines steadily and does not recover till
391
Ma Jin et al.: Accelerated synergism along a fault…
Fig. 3. Variations of strain increments (SS) along fault after moment 660s with time at points in the upper (a), middle (b) and lower segment (c). Numerals above each curve denote measurement sites. Letters are moments.
Рис. 3. Изменения прироста напряжений (SS) вдоль разлома после 660й секунды с течением времени в точках на верхнем (a), среднем (b) и нижнем участках разлома (c). Цифры на каждой кривой означают участки, где производились замеры. Буквами обозначены моменты значительной деформации.
392
Geodynamics & Tectonophysics 2014 Volume 5 Issue 2 Pages 387–399
a
b
Fig. 4. Variations of strains (SS) at points along the fault in the time intervals 660–702 s (a) and 690–702 s (b).
Рис. 4. Вариации напряжений (SS) на точках вдоль разлома с течением времени в периоды с 660 по 702 сек. (a) и с 690 по 702 сек. (b).
instability. Strain of sites 20 to 24 of the upper part, like that of the upper segment (sites 1 to 8), rises slowly, and this increase is followed by slow decline, then sudden rise and abrupt drop take place, in which the amplitude of de cline is larger than that of rise (Fig. 3, c). Before instability, amplitudes of strain variations differ in the specified segments of the fault. They are the largest in the upper segment, up to 37 με. The rise amount of the upper part of the lower segment is comparable with maxi mum 12 με, and decline amplitude of the lower segment is also relatively large with maximum –25 με. Such ampli tude of the middle segment is the least, merely 5~6 με for both rise and decline. The sequences of strain variations between the neighboring sites are also variable in the spe cified segments of the fault. At the early time, increasing compression is observed on all the sites. When deforma tion intensifies to some degree, differential variations ap pear on the fault.
4. STRAIN SYNERGISTIC PROCESS OF THE |METAINSTABILITY STAGE As evidenced by our laboratory observations and analy ses, it is difficult to recognize the stress state of the whole fault from strain processes of its single sites. Variations of
the stress state of the fault can be more clearly revealed by integral observation of all the segments of the fault. In the time interval from 660 s to702 s, sites 26 to 30 of the lower segment are the earliest to start strain release (665 s) (Fig. 4, a). This process firstly begins on sites 29 and 30, propagating leftward to site 26. With more release, its range also expands gradually (1.25 mm/s). Meanwhile, the upper segment, centered at site 8, starts to accumulate compressive strain. With increasing accumulation degree, the compressive area expands firstly and reduces after wards, with gradual leftward shift of the compressive cen ter (1.34 mm/s). Afterwards, the second strain release area appears on site 19 of the middle part of the fault. And from moment N, its range also expands toward the left (2.47 mm/s). From moment O, onsite 10 in the previous strain accumulation area, compression is replaced by extension, implying one more strain release areas. At moment A, this new area expands to the right rapidly (74.1 mm/s) and links with the strain release area centered by site 19. Meanwhile, the earliest strain release areas centered by sites 29 and 30 also expand at moment A. With a further increase of compressive strain, the compression center mi grates from site 8 to the left, rapidly reaching sites 5, 6, and 7, and, finally, instability occurs at these sites. It is clear that as early as the stress curve deviating from linearity, slow release of local strain begins. At mo
393
Ma Jin et al.: Accelerated synergism along a fault…
Fig. 5. LaohushanMaomaoshan fault and distribution of earthquakes since 1920. Red square is the 1920 Haiyuan M8.5 earthquake. Pink, yellow, blue, and red circles show locations of M6, M5, M4 and smaller events.
Рис. 5. Разлом ЛаохушанМаомаошан и распределение землетрясений после 1920 г. Красный квадрат – землетрясение Хайюань магнитудой 8.5, произошедшее в 1920 г. Точки розового, желтого, голубого и красного цвета – землетрясения магнитудой 6, 5, 4 и более слабые.
ment N, when the curve deviates more from linearity, strain release areas increase gradually. From moment O, the strain release areas start to expand. Such a process ac celerates at moment A, leading to linkage of the release areas. By this time, instability is irreversible. We use the term ‘synergism’ to denote the phenomenon comprising expansion of the strain release areas on the fault and their linkage with each other. The occurrence and increase of such areas indicate that the fault begins to re lease strain. Their expansion represents the start of the fault’s synergistic process. And the accelerated synergism marks that the fault enters the quasidynamic metainsta bility stage, which is also an indicator that an earthquake is inevitable. 5. TESTING THE FIELD CASE As stated above, the laboratory experiments of faulting reveal a synergistic process including expansion, acceler ated expansion and linkage of strain release areas. It is de rived from strain measurements in the laboratory condi tions that instability slip occurs on a strikeslip fault simu lated by a cut rock specimen. The LaohushanMao maoshan fault, being a part of the Haiyuan fault zone, is a strikeslip fracture whereat an M6.2 earthquake took place on 6 June 2000. Here we attempt to review and analyze
394
small quakes before the major event to explore the syner gistic process of this fault. The Haiyuan fault zone is a largescale strikeslip struc ture located west of the Ordos block. It comprises nine fault segments in the NW direction. It can be subdivided into three sections that differ in terms of active behaviors and geomorphology [The Haiyuan fault zone, 1990; Zhang et al., 2005]. Of them the middle and western sections are left lateral strikeslip, and the eastern section is leftslip with thrust component. The 16 December 1920 M8.5 earthquake ruptured the middle section. In the same month, an M5 event occurred at Baiying northwest of Hai yuan, followed by a M7 shock in southeast. Another group of faults arranged in a left step manner is located west of the Haiyuan fault zone, nearby Jingtai (Fig. 5). It includes Laohushan, Maomaoshan, and Jinqianghe faults that are reviewed below as comprising the LaohushanMaomao shan fault zone. These faults are striking nearly eastwest, with an included angle about 5° with respect to the Hai yuan fault zone, and also a leftstep pattern with a 10 km distance between fault ends parallel and perpendicular to the overall strike. In view of their proximity to the Hai yuan fault zone (also left slip), the impact of the 1920 Hai yuanmajor earthquake on the LaohushanMaomaoshan fault zone and its seismic hazard are issues of high con cern.
Geodynamics & Tectonophysics 2014 Volume 5 Issue 2 Pages 387–399
Fig. 6. Temporalspatial distribution of earthquakes along LaohushanMaomaoshan fault zone. Red, rose, dark blue, cyan and open circles denote M6, M5, M4, M3 and smaller earthquakes, respectively.
Рис. 6. Пространственновременное распределение землетрясений вдоль разломной зоны ЛаохушанМаомаошан. Точки красного, розового, темносинего, голубого и белого цвета – землетрясения магнитудой 6, 5, 4, 3 и более слабые, соответственно.
Seismic activity of the LaohushanMaomaoshan fault zone in the period from 1920 to 1958 is unknown as earth quake records are lacking. From 1959 to 1961, three M5 events occurred at the extensional jog area of the right part of the fault zone. As the earthquake catalogue since 1970 is continuous and complete, the following analysis is pri marily based on this dataset. From 1960, both the Haiyuan and LaohushanMaomaoshan fault zones were character ized by moderate seismic activity, except two M6.2 events in 1990 and 2000, respectively. In the period from 1970 to 1990, seismic activity of this region gradually increased, while after 2000, it continued to decline. The relatively active period started with the M5.1 event at the Jinqianghe fault on 7 December 1984; afterwards, moderatesize events migrated from west to east. A seismic swarm with maximum M6.2 occurred in the Laohushan fault zone on 20 October 1990. Afterwards, M6.2 and M5.2 took place
in the jog area of the right side of the Laohushan fault on 6 June 2000 and 27 December 2000, respectively, in ad dition to several M4 events during the same period. And since 2000, seismicity of this region turned into de cline. The temporalspatial migration of epicenters (Fig. 6) shows low seismicity along the Haiyuan fault zone, while seismicity at the Laohushan fault and in the jog area east ward of the fault was relatively active in the decade of 1990–2000. Before and after this period, frequent seismic events took place at same locations, very few migrating along the fault, which is indicative of independent activity of individual fault segments. But close to the relatively active period of seismicity, especially before the 2000 M6.2 event in the extensional jog area, there was a syner gistic process of fault activity. Around 1990, an M3 earth quake belt (shown in cyan in Fig. 6) propagated from
395
Ma Jin et al.: Accelerated synergism along a fault…
southeast (Laohushan) toward northwest with time. After 1997, an M3 and M4 belt striking from west to east ap peared at the Jinqianghe fault; its pattern of epicenters was dense. Thus, activity along the MaomaoshanLaohushan fault entered the synergistic state, which provided the in stability condition for a strong earthquake, and the M6.2 event occurred on 6 June 2000. After this earthquake, the activity level of the jog area east of Laohushan became relatively higher. It can be inferred that the synergism, that propagated westward at a stable rate along the Laohushan Maomaoshan fault, commenced earlier and was acceler ated by the eastward propagation of seismic activity at the Jinqianghe fault after 1996. As a consequence, the M6.2 earthquake occurred on 27 December 2000. This process is very similar to the strain variations prior to instability which were observed in the laboratory studies described above. 6. DISCUSSION 1. One of most profound characters of faults is com plexity of their geometry and heterogeneity and anisotropy of rock as their host media, which yields the complex me chanic nature of faults at any scale [Konca et al., 2008]. Like other materials, rocks obey laws of mechanics, but exhibit highly variable behaviors [Jaeger, Cook, 1979]. Usually, in a nonuniform medium, a fault consists of rela tively weak and strong segments. Under stress, its weak segments are first to become area of strain release, while its strong segments accumulate strain and, finally, become the areas where instability starts fast. Nucleation of a fault might begin by connection of multiple points, rather than necessarily from one point toward outside. 2. The laboratory research shows that as strain accumu lates to the stage deviating from linearity, strains on the fault begin to diverge, resulting in segmentation, i.e. seg ments characterized by high and low strain values are formed. Our studies indicate that when a small quake or slip occurs at one segment of the fault, no matter a quasi static action [Stein, 1999] (displacement) or a dynamic ac tion [Gomberg et al., 2003; West et al., 2005], it can cause strain changes in other segments of the fault. Usually, the process of deformation and instability of a fault takes place in three stages as follows: generation of strain release ar eas, expansion and increase amount of these areas, and their linkage. In the first stage, smallsize strainrelease areas are formed. As stresses become more intense, the strainrelease areas are expanded, and this is indicative of the second stage. Such expansion proceeds slowly within a limited range. When the stress reaches a certain level, the strainrelease areas become sufficiently long, distances between these areas become very short, and these areas begin to link up with each other, and this marks the third stage. In the stage of deviation from linearity, both the strainrelease and strainaccumulation areas are generated along the fault. And steady expansion and increase of the 396
strainrelease areas are associated with quasistatic insta bility stage. When subsequently the fault enters the quasi dynamic instability stage, the number of the strainrelease areas is sufficient, expansion of the existing strainrelease areas reaches some degree, and interaction between these areas is enhanced, such factors jointly make them expand at an accelerated rate [Du Yijun et al., 1989].According to the laboratory experiments, in the three abovementioned stages, the rates of expansion of the strainrelease areas along the fault are ~1 mm/s, ~2.5 mm/s, and ~74 mm/s, respectively. Apparently, the rates of the former two stages represent a stable increase, while that of the third stage is an increase of orders of magnitude. The accelerated syner gism begins when the quasistatic expansion transforms into quasidynamic expansion. Its essence is that the ex pansion mechanism changes which means that independ ent expansion of isolated weak fault segments is replaced by linking of the fault segments during their interaction. And from this moment the fault enters the stage within which an earthquake will be surely generated. 3. As stated above, the temporalspatial evolution of the earthquakes along the LaohushanMaomaoshan fault zone shows that the fault remains in the stage of deviation from linearity within which dense moderate and small quakes that occurred at many places were not associated with each other at the fault. As these events propagated steadily to ward northwest along the fault from Laohushan, the fault should have entered the early metainstability stage, i.e. the stage of quasistatic instability. The accelerated propa gation of moderate and small events at the fault from Jin qianghe to northeast marks the later metainstability stage, or the quasidynamic instability stage. The accelerated synergism of the fault is the indicator of entering the later metainstability stage. It implies that this fault will surely generate an instability event, probably manifested as a ma jor earthquake, although its time of occurrence is unknown yet. 4. Our experimental results demonstrate that during strain release at some fault segments, strain accumulation takes place at other fault segments. With the expanding range of strainrelease areas and enhancement of release degree, the range of strainaccumulation areas reduces while strain accumulation degree increases. As the range and degree of strain release reaches the maximum, mean while the strainaccumulation areas become reduced to the least range with the maximum accumulation degree, dy namic instability takes place nearby highgradient zones of strain. It indicates that the synergism and instability proc ess is just the interaction between the fault segments, that have different mechanical properties, and during such a process, high strainaccumulation areas are not of pre existence. Besides, the length of the fault segments that cause dynamic instability is much less than that of the fault in the state of instability [Jordan et al., 2011]. 5. Such events take place in a cascade mode, i.e. they are triggered by previous ones in a continuous sequence. Through many episodes of stepwise amplification, an ori
Geodynamics & Tectonophysics 2014 Volume 5 Issue 2 Pages 387–399
ginally weak input signal changes into a very strong output signal [Ellsworth, Beroza, 1995; Ma Shengli et al., 2002, 2003]. In the experiments, the weak segments of the fault firstly release strain, which cause stress variations in the neighboring segments through stress adjustment. The strain release of some weak segments of the fault can lead to strain release in other weak segments as well as increase of the strain level of strong segments of the fault. Under such repeated chainmode reaction, the total length of strainrelease segments reaches the critical value and the stress level of the strainaccumulation segments becomes extremely high, so that intense instable slip occurs along the fault. Due to extreme complexity of faults and their behavior in the cascade mode [Noda et al., 2013], many factors are uncertain, but need to be taken into account in earthquake prediction. 7. SUMMARY In this publication, we focus on deformation features of a fault in its metainstability stage and draw the following conclusions: 1. There exist relatively weak and strong segments of a fault. The former are usually firstly weakened, as ex pressed by preslip, slow temblors, or small shocks, indica tive of the start of strain release; while the latter are the places where the fault is locked and ruptured fast in an in stable manner. 2. The difference between the stage of deviation from linearity and the metainstability stage is as follows: once the stresstime curve deviates from linearity, strain release and strain accumulation areas occur successively on the fault, which are relatively independent from each other. In the early metainstability stage, strainrelease areas expand and their number increases, while the ranges of strain accumulation areas are reduced and their strain level be comes higher. In the late metainstability stage, the strain release areas accelerate to expand, link with each other, and finally occupy the entire fault. The accelerating expan
sion of strainrelease areas is an indicator for an impending earthquake. 3. The expansion and linkage of strainrelease areas of the fault exhibit the synergism degree of fault activity and indicate instability of the site and temporal proximity of a seismic event. But, actually there are two kinds of insta bilities during stickslip of the fault, of which the former is related with strain release of weak portions of the fault, while the latter results from fast strain release of strong portions, exhibiting a major earthquake. And accelerated expansion of the former facilitates the occurrence of the latter. Our research is still underway, and many problems re main to be studied further. For instance, we suggest that identification of the metainstability stage and accelerated synergism can indicate that the instability event is impend ing, but it cannot specify its location and/or magnitude. The occurrence moment of a major quake means a dy namic burst, while neither the rupturing velocity of the fault nor inertia conditions required for seismic velocity are clear yet. Faults are not isolated features; interaction between different boundaries of a block can influence in stability; different dynamic conditions may cause distinct variations, and these are only a few problems requiring further, more detailed studies. 8. ACKNOWLEDGEMENTS This work was supported by the National Natural Sci ence Foundation of China (Grant 41172180), Basic Re search Funds from the Institute of Geology, China Earth quake Administration (Grant IGCEA1203), NSFCRFBR (Grant 41211120180) and the Russian Fund for Basic Re search (Grant 120591161GFENa). Zhuo Yanqun par ticipated in the experimental work. We thank Liu Liqiang, Liu Peixun, Ma ShengLi, Gao Xianglin, Chen ShunYun and other colleagues for their technical support and useful discussions. We are also grateful to reviewers for their comments.
9. REFERENCES Bakun W.H., Lindh A.G., 1985. The Parkfield, California, earthquake prediction experiment. Science 229 (4714), 619–624. http://dx.doi.org/10.1126/science.229.4714.619. BenZion Y., Rice J.R., Dmowska R., 1993. Interaction of the San Andreas fault creeping segment with adjacent great rupture zones, and earthquake recurrence at Parkfield. Journal Geophysical Research 98 (B2), 2135–2144. http://dx.doi.org/ 10.1029/92JB02154. Beroza G.C., Ide S., 2009. Deep tremors and slow quakes. Science 324 (5930), 1025–1026, http://dx.doi.org/10.1126/ science1171231. Chen Y.T., 2009. Earthquake prediction: Retrospect and prospect. Science China: Earth Sciences 3912, 1633–1658 (in Chi nese). Cicerone R.D., Ebel J.E., Britton J., 2009. A systematic compilation of earthquake precursors. Tectonophysics 476 (3–4), 371–396. http://dx.doi.org/10.1016/j.tecto.2009.06.008. Du Yijun, Ma Jin, Li Jianguo, 1989. Interaction and stability of en echelon cracks. Acta Geophysica Sinica 32 (1), 218–231 (in Chinese). 397
Ma Jin et al.: Accelerated synergism along a fault…
Ellsworth W.L., Beroza G.C., 1995. Seismic evidence for an earthquake nucleation phase. Science 268 (5212), 851–855. http://dx.doi.org/10.1126/science.268.5212.851. Fedotov S.A., 1968. On seismic cycle, opportunities of quantitative seismic regionalization and longterm seismic forecast. In: Seismic zoning in the USSR. Nauka, Moscow, p. 121–150. Gomberg J., Bodin P., Reasonberg P.A., 2003. Observing earthquakes triggered in the near field by dynamic deformations. Bulletin of the Seismological Society of America 93 (1), 118–138. http://dx.doi.org/10.1785/0120020075. Jaeger J.C., Cook N.G.W., 1979. Fundamentals of Rock Mechanics, Third Edition. Chapman and Hall, London, 593 p. Johnson B.F., 2009. Earthquake prediction: gone and back again. Earth 4, 30–33. Jordan T.H., YunTai Chen, Gasparini P. et al., 2011. Operational earthquake forecasting–state of knowledge and guidelines for utilization. Annals of Geophysics 54 (4), 315–391. http://dx.doi.org/10.4401/ag5350. Konca A.O., Avouac J.P., Sladen A., Meltzner A.J., Sieh K., Fang P., Li Z.H., Galetzka J., Genrich J., Chlieh M., Natawidjaja D.H., Bock Y., Fielding E.J., Ji C., Helmberger D.V., 2008. Partial rupture of a locked patch of the Sumatra megathrust during the 2007 earthquake sequence. Nature 456 (7222), 631–635. http://dx.doi.org/10.1038/nature07572. Liu Yuanzheng, Ma Jin, Ma Wentao, 2014. The role of the Zipingpu reservoir in the generation of the Wenchuan earthquake. Earth Science Frontiers 21 (1), 150–160 (in Chinese). Ma Jin, Sherman S.I., Guo Yan Shuang, 2012. Identification of metainstable stress state based on experimental study of evo lution of the temperature field during stickslip instability on a 5 bending fault. Science China: Earth Sciences 55 (6), 869–881. http://dx.doi.org/10.1007/s1143001244232. Ma Shengli, Liu Liqiang, Ma Jin et al., 2003. Experimental study on nucleation process of stickslip instability on homoge neous and nonhomogeneous faults. Science China: Earth Sciences 46, 56–66. http://dx.doi.org/10.1360/03dz0005. Ma Shengli, Ma Jin, Liu Liqiang, 2002. Experimental evidence for seismic nucleation phase. Chinese Science Bulletin 47 (9), 769–773. http://dx.doi.org/10.1360/02tb9174. Matsumura S., 1997. Focal zone of a future Tokai earthquake inferred from the seismicity pattern around the plate interface. Tectonophysics 273 (3–4), 271–291. http://dx.doi.org/10.1016/S00401951(96)002776. Mogi K., 1981. Earthquake prediction program in Japan. In: Simpson D.W., Richards P., eds. Earthquake prediction – An International Review. Maurice Ewing Monograph Series 4. American Geophysical Union, Washington DC, p. 635–666. Nishenko S.P., 1991. CircumPacific seismic potential: 1989–1999. Pure and Applied Geophysics Topical Volumes. Aspects of Pacific Seismicity, p. 169–259. http://dx.doi.org/10.1007/9783034856393_2. Noda H., Nakatani V., Hori T., 2013. Large nucleation before large earthquakes is sometimes skipped due to cascadeup – implications from a rate and state simulation of faults with hierarchical asperities. Journal of Geophysical Research: Solid Earth 118 (6), 2924–2952. http://dx.doi.org/10.1002/jgrb. 50211. Ren Yaqiong, Liu Peixun, Ma Jin, Chen Shunyun, 2013. An experimental study on evolution of thermal field of en echelon fault during the metainstability stage. Chinese Journal of Geophysics 56 (5), 612–622. http://dx.doi.org/10.1002/cjg2. 20057. Schwartz D.P., Coppersmith K.J., 1984. Fault behavior and characteristic earthquakes – examples from Wasatch and San Andreas fault zones. Journal of Geophysical Research 89 (B7), 5681–5698. http://dx.doi.org/10.1029/JB089iB07p05681. Science of Earthquake Prediction, 2007. Review Committee for Earthquake Prediction of Japan Seismological Society. Uni versity of Tokyo Press, Tokyo, 218 p. (in Japanese). Shearer C.F., 1958. Southern San Andreas fault geometry and fault zone deformation: implications for earthquake prediction. National Earthquake Prediction Council Meeting, March, 1985. US Geol. Surv. Openfile. Rep. 85–507, USGS, Reston, Virginia, USA, p. 173–174. Shimazaki K., Nakata T., 1980. Timepredictable recurrence model for large earthquakes. Geophysical Research Letters 7 (4), 279–282. http://dx.doi.org/10.1029/GL007i004p00279. Stein R.S., 1999. The role of stress transfer in earthquake occurrence. Nature 402 (6762), 605–609. http://dx.doi.org/10.1038/ 45144. Sykes L.R., 1971. Aftershock zones of great earthquakes, seismicity gaps and prediction // Journal of Geophysical Research 76 (32), 8021–8041. http://dx.doi.org/10.1029/JB076i032p08021. The Haiyuan fault zone, 1990. State Seismological Bureau, Ningxia Seismological Bureau. Seismological Press, Beijing (in Chinese). West M., Sa´nchez J.J., McNutt S.R., 2005. Periodically triggered seismicity at Mount Wrangell, Alaska after the Sumatra earthquake. Science 308 (5725), 1144–1146. http://dx.doi.org/10.1126/science.1112462. Wyss M., 1991. Evaluation of Proposed Earthquake Precursors. Eos, Transactions American Geophysical Union 72 (38), 411. http://dx.doi.org/10.1029/90EO10300. Wyss M., 1997. Second round of evaluations of proposed earthquake precursors. Pure and Applied Geophysics 149 (1), 3–16. http://dx.doi.org/10.1007/BF00945158.
398
Geodynamics & Tectonophysics 2014 Volume 5 Issue 2 Pages 387–399
Zhang Guomin, 2013. Selected Research Papers on Earthquake Prediction. Seismological Press, Beijing (in Chinese). Zhang Peizhen, Min Wei, Deng Qidong, Mao Fengying, 2005. Paleoearthquake rupture behavior and recurrence of great earthquakes along the Haiyuan fault, northwestern China. Science China Series D 48 (3), 364–375. http://dx.doi.org/ 10.1360/02yd0464. Zhuo Y.Q., Guo Y.S., Ji Y.T. et al., 2013. Slip synergism of planar strikeslip fault during metainstable state: Experimental research based on digital image correlation analysis. Science China: Earth Sciences 56 (11), 1881–1887. http://dx.doi. org/10.1007/s1143001346234.
Ma Jin, academician of Chinese Academy of Sciences, Geologist and Tectonophysicist State Key Laboratory of Earthquake Dynamics, Institute of Geology, China Earthquake Administration Beijing 100029, China
email:
[email protected] Ма Дзинь, академик Китайской академии наук, геолог, тектонофизик Государственная центральная лаборатория геодинамики Земли, Институт геологии, Администрация по землетрясениям Китая 100029, Пекин, Китай
email:
[email protected]
Guo Yanshuang, assistant researcher, focus on Engineering and experimental mechanics State Key Laboratory of Earthquake Dynamics, Institute of Geology, China Earthquake Administration Beijing 100029, China email:
[email protected] Гуо Яншуань, ассистентисследователь, специалист в области техники и экспериментальной механики Государственная центральная лаборатория геодинамики Земли, Институт геологии, Администрация по землетрясениям Китая 100029, Пекин, Китай email:
[email protected] Sherman, Semen I., Academician of the Russian Academy of Natural Sciences, Doctor of Geology and Mineralogy, Professor, Chief Researcher Institute of the Earth’s Crust, Siberian Branch of RAS 128 Lermontov street, Irkutsk 664033, Russia Tel.: (3952)428261; email:
[email protected] Шерман Семен Иойнович, академик Российской академии естественных наук, докт. геол.мин. наук, профессор, г.н.с. Институт земной коры СО РАН 664033, Иркутск, ул. Лермонтова, 128, Россия Тел.: (3952)428261; email:
[email protected]
399