computer is mobility; since a wearable computer is worn as ... Further, we call a set of virtual objects context. ... center of the world, and shows what objects or.
Accessing Context in Wearable Computers Juha Lehikoinen and Riku Suomela Nokia Research Center, Tampere, Finland
Abstract: We present an easy interaction technique for accessing location-based contextual data shown on a head-worn wearable computer display. Our technique, called Context Compass, is based on a regular compass metaphor. Each object belonging to the user’s current context is visualised on a linear compass shown on the screen. The object directly in front of the user is shown in the middle of the compass and can be activated. Whenever the user turns his or her head, the objects on the screen move accordingly. Therefore, an object can be selected by simply turning one’s head towards it. Context Compass consumes a minimal amount of screen space, making it ideal for usage with see-through head-worn displays. An initial pilot study, applying a newly developed usability method customised especially for Context Compass, revealed that Context Compass can be learned virtually immediately. Further, the method itself proved to be successful in evaluating techniques such as Context Compass. Keywords: Augmented reality; Interaction technique; Navigation; Wearable Computer
1. Introduction
64
One of the most essential aspects of a wearable computer is mobility; since a wearable computer is worn as clothing, it goes wherever the user goes. A wearable computer should also be as unobtrusive as clothing. The challenge in designing wearable systems is to maintain the usability in the varying using conditions, without decreasing functionality. The mobility implies a potential application area for wearable computers – navigation. A navigation application usually either assists the user in finding his or her way from the origin to the destination, or prevents him or her from getting lost when exploring the environment. A typical navigation application consists of a geographical map shown on the screen, coupled with some additional information such as directional instructions and landmarks. In addition to the regular geographical and point-of-interest information, the map can be augmented with arbitrary digital objects. These objects could include a YAH (You-Are-Here) symbol denoting the user’s current location and orientation (or that of some other user), documents and media files that are tied to a certain location, and so forth. We call such a digital object a virtual object, no matter whether it has a real-world equivalent or not (in fact, the objects that act as navigational aids can be considered just another species of virtual objects, and treated equally).
# Springer-Verlag London Ltd Personal and Ubiquitous Computing (2002) 6:64–74
Further, we call a set of virtual objects context. The context is constrained by the user’s personal preferences and state, current location, time of day, and so forth. Only the objects that match all the criteria belong to the context and can be accessed by the user. There are various ways to present the contents of the context to the user. The most straightforward way, as described above, is to display a map on the screen, and draw one icon for each object on its actual location on the map. However, with an excessive number of objects, it will be difficult to distinguish between individual objects and access them. In the present paper, we describe the user interface design of a straightforward interaction technique for accessing the context, called Context Compass, first introduced in Suomela and Lehikoinen [1]. With Context Compass, the user can access the objects belonging to the context in an easy and natural way. We will also present an evaluation method designed specifically for Context Compass. Even though the metaphor behind this interaction technique is compass, it resembles more the heading indicator used in avionics [2] than the traditional compass. The traditional compass indicates where north is, whereas Context Compass always places the user at the center of the world, and shows what objects or compass heading is in front of the user. The paper is structured as follows. First, the
related work is presented, followed by the design of the user interface. We then describe the design of the usability evaluation method, along with the pilot evaluation and results. The results are then discussed and the work is concluded.
2. Previous Work Context-awareness has been studied extensively. Context-aware computing and context-aware applications were described by Schilit et al. [3]. Context-aware systems know and adapt to the location of use, people nearby, hosts, devices and changes to these over time. Pascoe [4] presented a set of core capabilities for context-aware applications. Contextual sensing requires that the device detect various environmental states that are used to aid the user. Contextual adaptation means that the device can adapt to the current usage environment. The ability of the device to discover and use other resources in this context is called contextual resource discovery. Finally, the environment can be augmented with additional context information; this is called contextual augmentation. Of these capabilities, Context Compass implements contextual sensing and contextual augmentation: it downloads a location dependent set of objects that form the context, which is augmented with the compass UI. Augmented Reality (AR) enhances the user’s senses by overlaying a perceptible virtual layer on the physical world [5]. When combined with head-worn displays commonly found in wearable computing systems, augmented reality can offer the user additional information on the surrounding area in visual form. Augmented reality has been studied widely within wearable computing research. One such system is the Touring Machine [6]. It augments data onto the real world, supports a large space for users, and combines multiple display and interaction techniques. Another system for outdoor augmenting was presented by Azuma et al. [7]. They address the problems currently occurring in such systems, particularly that the location is not known accurately enough. An augmented system where objects can be created is discussed in Augmentable Reality [8], a system which is used indoors. The user can store digital content that is stored along with its contextual information. The objects can be later accessed; the user is notified when such content
is present. This kind of augmenting needs very accurate information on location and head orientation in order to work properly. Thomas et al. [9] introduced an interesting navigation system, ‘‘map-in-the-hat’’. The main focus of the work is on navigation and guiding people from point A to point B. The system uses waypoints to help the user find the final destination. The system augments the waypoints on the user’s see-through head-worn display; a compass showing the walking direction is also shown at the top of the screen. Context Compass is related to systems with a map as the user interface metaphor. One such system is Cyberguide [10], a handheld tourist assistance system. It runs on a commercially available PDA and its goals are to provide information on where the tourist is, what he or she is looking at, to answer questions, and to interact with the environment and people. Manipulation and creation of virtual objects should be possible while in motion. Creating virtual objects while moving depends on the available input devices. An instance of this is the Field assistant prototype [4], a set of tools that help a fieldworker while observing the environment. Its Stickepad application creates Stick-e notes, which contain the GPS position. The notes are created from a template and the values can then be edited. Head-worn displays have been used in creating an information space around the user [11]. There are three different ways to present information to the user according to the capabilities of the tracking technology used. The simplest way is the head-stabilised information display. Information is fixed to the user’s viewpoint, and does not react to orientation or position changes. In body-stabilised information displays, the information is fixed to the user’s orientation and changes when the user’s orientation changes. It does not react to position changes. World-stabilised information displays provide a rich information space, where the location can be used to determine the context and the data is spread around the user. The information is fixed to real world locations, and it changes as the user’s location and position changes. The user is inside an information cylinder that spreads around him or her. Of the information displays described above, the visual user interface in Context Compass resembles the world-stabilised approach. Simi-
Accessing Context in Wearable Computers
65
larly, the user is in the centre, and objects are arranged relative to the user. In addition to an interaction technique, Context Compass is a complete system. It defines the storage and access of virtual objects, a user interface for showing context data, and opening the virtual object contents. It does not try to augment data on their actual positions in the real world, but it hints at the directions in which the objects can be found. The user interface is clearly separated from the real world. This approach is easy to implement with the current sensor technologies.
3. The Design The user of a navigation application is either exploring the neighbourhood, or trying to find his or her way to a certain location. These are two separate tasks that usually require different features from the application. In some cases, there should be a good map presentation of the local area available, while sometimes only a small amount of visible information will suffice. The different requirements for these tasks need
to be taken into consideration when designing such a navigation system. Context Compass is one part of the user interface of a complete navigation application for a wearable computer. The user interface has several different visualisation styles with a different amount of information. These styles have to balance between the amount of information displayed and the portion of the display blocked. There are advantages and disadvantages in both ends; either the amount of information is high, in which case the user is hardly able to see due to the fully blocked vision, or there is only a very limited amount of information in the periphery of the screen, in which case the user can move more freely. Context Compass belongs to the latter end: it is designed to give the user maximum seethrough capabilities while displaying some key information on the surroundings. It is designed for a walking wearable computer user. In our navigation system, there are three primary hardware devices required by Context Compass. The user has an electronic compass attached to his or her headgear, providing information on the absolute orientation of the user’s head. The display device is a see-through
66
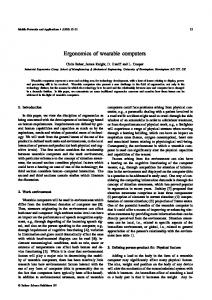
Fig. 1. A view as seen through the display. Context Compass is shown on top. The user is oriented towards a real-world object (a hotel) directly in front. The virtual object, representing the hotel, is displayed on the Context Compass. The hand icon in the bottom right corner displays the possible actions for this object.
J. Lehikoinen and R. Suomela
head-worn display. We also have a four-button input device for discrete commands, called NFingers [12]. N-Fingers is a ‘‘finger-worn’’ device that has one button in the index finger, two buttons in the middle finger, and one button in the ring finger. These buttons can be clicked by the thumb. A hand image is displayed on the screen, visualising the current actions associated with each button. In Context Compass, a linear compass is drawn on top of the field of view (see Fig. 1, where a synthesised screenshot showing the view seen through the head-worn display is depicted). The compass shows the accessible objects in front of the user as well as objects around the user, along with compass points. The object directly in front of the user is highlighted and can be easily accessed with a press of a button. A short note is in order. Even though the interaction technique is based on the regular compass metaphor, it is not intended to be used
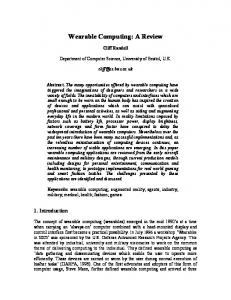
Fig. 2. The layout of the user interface on the screen. Most of the field of vision is retained (cf. Fig. 1).
as a traditional compass in navigation. Certainly the compass, along with the compass points displayed on the screen, can be used for navigation; however, the metaphor was chosen due to its familiarity and close relation to directions. In basic usage, Context Compass differs from a regular compass in one remarkable aspect – it is used relative to the user, not to the North Pole. Hence the directions associated with Context Compass are ‘‘in front of’’ and ‘‘behind’’ rather than ‘‘north’’ and ‘‘south’’. The visual user interface components are composed of the linear compass, target information area, and button functionality area (see Fig. 2). The core of the on-screen user interface is the linear compass, showing the objects in front of the user and 55 degrees on both sides. The linear compass is one-dimensional, i.e. the objects are always on the same vertical position on the screen regardless of their actual vertical location. The idea is to extend the use of traditional compass to view information in the current context. To achieve this, the orientation, determined by an electronic compass attached to the user’s headgear, is continuously measured, and the changes are reflected on the linear compass on the screen. Therefore, pointing at an object requires only that the user turn his or her head towards the desired object (see Fig. 3). This is a natural way of showing interest towards an object. The object directly in front of the user is targeted. Its icon is also framed on the user interface. The objects that are not in front can be accessed by turning into the direction of the object. In case an object is not within the 110 degree area, it is drawn on either edge of the
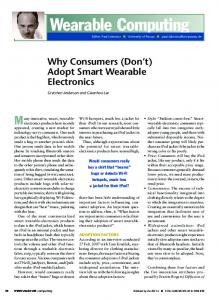
Fig. 3. In the leftmost part, the user is looking at an ellipse object. In the rightmost part, he is turning his head to the right, showing interest towards a lightning bolt object. Observe the equivalent change on the screen, shown below both cases.
Accessing Context in Wearable Computers
67
68
linear compass, showing the preferred turning direction to reach the object. Whenever an object is selected, the available functions are shown on the button area. The button icons represent the physical button on the input device; the function associated with a button may change dynamically, according to the available function set. This set, in turn, depends upon the object being selected. The Context Compass visualisation makes it easy to access the objects without blocking the field of vision. The visualisation of a context acts as a preview stage for the objects in the area. All the objects are drawn on the user interface and when any of them is pointed at, the associated information (e.g. name and distance) is also shown. The objects are presented in the user interface by a bitmap attached to them, or by a predetermined shape that helps users recognise the object. In the case of several objects in the same direction, the activation does not open any of the objects, but presents a list showing all objects in the line of sight, sorted by distance in an ascending order. The desired item can then be chosen from the list using N-Fingers to navigate through the list and make a selection. The context itself is composed of virtual objects that are stored in a point of interest database, be it local or remote. The database is accessed (with a wireless connection in the case of a remote database) and a collection of virtual objects is downloaded automatically when needed. The context database has a large number of objects; only a small set of these is downloaded at once, based on two criteria: the objects need to be within a certain range, and they have to specified as being of interest by the user. All virtual objects have a geographical location in the real world, no matter whether they stand for a real world object or a purely virtual one. The Context Compass has two primary purposes. First, it is designed to aid the user when he or she is navigating in an unknown environment. Secondly, Context Compass gives the user easy access to the current context. The user can quickly access any object close to him or her by simply looking at it. In this paper, we are primarily considering the context access. It is important to know if the users find the system natural to use and if they understand the underlying working principle – that is, Context
J. Lehikoinen and R. Suomela
Compass shows the locations of virtual objects in relation to the user. Next, we will consider the issues associated with usability evaluations for wearable interaction techniques such as Context Compass.
4. The Pilot Experiment Evaluating a user interface targeted at wearable computers, or any mobile computer for that matter, imposes numerous challenges. Particularly, one has to balance between the accuracy of the quantitative results (i.e. how tightly the experiment should be controlled) and the environment of use (i.e. how closely should the evaluation environment match the actual using environment). In most cases, accurate quantitative results cannot be achieved in a real using environment, and authentic using experiences cannot be collected in tightly controlled laboratory experiments. Hence, in many cases at least two different experiments are required to assess the usability of an interaction technique. Context Compass is a novel interaction technique, not familiar to any user. Further, it is a complete system, consisting of several components. The functionality of each of these components affects the overall perceived and measured usability of the system. Hence, our opinion is that each part should be accounted for in the evaluation. In the case of an unfamiliar technique, there are two fundamental issues that should be evaluated above all: 1. Are there any specific usability problems with the technique. 2. What are the users’ personal experiences. To be able to evaluate the aforementioned questions, one has to have an appropriate usability method at hand. Hence, one significant question remains: what usability method should be applied when evaluating a novel technique such as Context Compass? After all, most existing methods are optimised for desktop user interfaces, assuming a stationary working place. Obviously, these methods do not apply well to mobile usage. In fact, finding such a method would most probably appear to be invaluable in future experiments. With these questions in mind, we began to design a pilot experiment for Context Compass. The purpose of the experiment was two-fold:
first, we wanted to develop a specific evaluation method and assess its appropriateness; secondly, we planned to run a pilot experiment, applying that method to find out design flaws and usability problems within Context Compass. In this way, we would be able to evaluate both the method and the initial impressions on the technique together. Due to the purpose of the pilot evaluation, we decided to arrange a controlled laboratory experiment. In this section, we will describe the method in detail, as well as the course of the experiment. 4.1. The method When designing the method, we identified two primary concerns. First, to be able to accurately control the experiment, the test supervisor should be able to see what the user is seeing on his or her display. Secondly, we needed a way to distinguish between accessing pure virtual objects and those that have real-world equivalents. There could probably appear to be problems specific to only either of the cases. Further, in both cases the controlled environment should reflect the essential characteristics of the respective real world task. To overcome the first challenge, we further developed our technique for controlling usability studies, described in Suomela et al. [13]. In short, we had a video camera attached to the user’s headgear, pointing to the direction of sight. The VGA output of the computer was converted into composite video, and the feed from this camera was mixed in, resulting in a composite video feed that showed fairly accurately the actual view through the head-worn display as seen by the
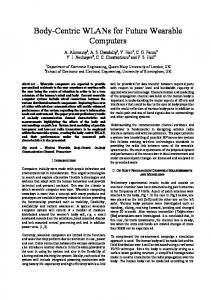
user (see Fig. 4, where two frames from the video are shown). The test supervisor was able to observe this view through a separate video monitor. This helped both to follow the course of the evaluation, and to make notes on user’s behaviour when performing the test tasks. Further, the test sessions were videotaped for later analysis. In case a problem might occur, we could then use the video to locate the problematic tasks. As for the second concern, we developed the method as follows. The test context consisted of five capital alphabetic characters (A–Z). After each task, the user was told the next target letter, after which he or she loaded the context by clicking a button. At this point, the letters belonging to the context were displayed on the linear compass screen at predetermined positions. The subject located the target by turning his or her head towards it, and selected it with another button. After the task was completed, the user turned towards the alignment sign on the wall, after which the next target item was told. The test had two sections: in the first section, all the letters were virtual (i.e., there were no real-world counterparts to the letter objects). The user had to find the correct object by just looking around. This section simulated the browsing case (i.e., the user does not know exactly the contents of the context, but is looking around to find potentially interesting objects). For the second section, we attached sheets of paper (A4 size) on the walls; each sheet contained one alphabetic letter printed in a
Fig. 4. Two frames from the test videotape. In the leftmost frame, a virtual object ‘‘K’’ has been targeted. In the rightmost picture, an object ‘‘K’’, which represents a real-world object, has been targeted and selected. Note that the Object Information area is not used in the evaluation application, but the selected letter is shown in large font on the bottom left corner.
Accessing Context in Wearable Computers
69
large sans serif font. These sheets represented the real world objects that would belong to the context. There were six of these sheets, with randomly selected letters A,C,H,K,O and U. The sheets were hidden during the first section, and shown when the second section started. Before the second section started, we asked users to look around for a while to memorise the locations of the letters. This simulates a use scenario outdoors, when the user sees several points of interest, and probably remembers the locations of some. The targets in the second test were always among the letters shown on the wall. In other words, this test simulated the pointing case (the user knows which object he or she is interested in, and selects that object). 4.2.The pilot experiment
70
The evaluation was arranged inside, in a large room filled with laboratory equipment. The dependent variables included the number of incorrect selections, and the number of times the user had to change the direction of movement (i.e., the user moved past the desired object and had to turn back). In addition, we measured the learning effect, i.e., the development of the task execution time during the evaluation. The independent variable was the test type (pure virtual or real world objects). Participants Six subjects took part in the evaluation. They were higher-educated engineers and students. One user was a bachelor of arts. Three of the users were male and three were female. None of the subjects had used Context Compass before. However, five out of the six users had at least tried head-worn displays. Each subject was paid a movie ticket (worth approx $7) for taking part in the experiment. It should be noted that generally there should be more than six users in usability evaluations; it is commonly agreed that at least 12–15 users are required in quantitative experiments. However, in the pilot evaluation, we found six users adequate for our purposes. The equipment Context Compass was implemented and tested on our wearable computer. The system consists of a Plug’n’Run Mobile Pentium II processor and PCMCIA CardPC board by Cell Computing [14]
J. Lehikoinen and R. Suomela
Fig. 5. The wearable computer CPU. The dimensions are 153 mm (width) 6 111 mm (depth) 6 46 mm (height).
running Windows 98. The computer has 128 MB of RAM and a 340 MB IBM MicroDrive. It has two serial ports, one parallel port, and two USB ports to connect the external devices. There are two PCMCIA slots. Sony Glasstron PLM-S700E is used as a display. The compass is Leica DMCSXZ. The central unit is shown in Fig. 5. The video camera used in the user’s headgear was an analogue ‘‘lipstick’’ miniature model by MicroVideo [15]. It was connected to a standard desktop video mixer. Procedure The test session began with an introduction: the user was demonstrated the working principle of Context Compass on a desktop display. The user was then assisted in putting on the wearable system. He or she was asked to stand exactly on a marked location on the floor and to look straight ahead at a mark on the wall. At this point, we aligned the head-worn camera. The introduction was followed by the two actual test sections as described above. There were 25 tasks in both sections. The first task in both sections was a practice task that was not measured. After the test, the user was asked questions concerning the ease of use, naturality and opinions. Each subject performed exactly the same tasks.
5. The Results The results can be divided into two sections: the results on the evaluation method, and the results on the pilot study. We first briefly consider the success of the method.
The method As described above, the method itself consisted of three key elements: 1. Approximating and monitoring the user’s view and actions. 2. Simulating exploring the environment. 3. Simulating accessing known real-world objects. Monitoring the user’s view worked flawlessly. The image provided by the mixed VGA and video signals was accurate enough to allow precise observation. The only issue in this respect concerned the camera alignment that was required after each task; this caused undesired interruptions in the flow of experiment. The simulation on environment exploration was the least successful part of the method. This was mostly due to the artificial set of objects that did not relate in any way to the using environment. Even though the users were able to browse the context by looking around and the method worked as such, it was not clear that the objects are indeed tied to certain locations. It would have been better to run the experiment in a real living room, for instance, and use virtual objects that belong to the environment, such as virtual TV guides or newspapers. It would have been much more easier to see a virtual TV guide near the TV set than a letter floating in the air. The third part, simulating accessing known real-world objects, performed better. Even though the problem described above concern this part as well, it was still easier to understand the meaning of the letters once the equivalent real-world object was also visible. The technique The most interesting results can be found in the passing analysis (i.e., how many times did the user move back and forth around the target object before selecting it). The results for all users are shown in Fig. 6. It can be seen that each user had less passings in the second (real-world objects) test. The optimal number of passings for each task is 0. We also analysed the significance of the difference in passings within the two test sections. A t-test returned a p-value of 0.008 (t = 2.77), showing statistically significant difference. It seems to be easier to focus on an object that can be seen in the real world as well. The
Fig. 6. The passings made by all users in both test sections.
video analysis confirmed this – the users also moved their heads in the vertical direction when looking at real world objects on different height levels. There is a slight negative correlation between the number of passings and the task number (i.e., as the test progresses the number of excess passings decreases). However, it is not significant. It shows that virtually no learning has appeared during the test sessions in this respect. Speed wise, we measured the average task completion times. The results, along with standard deviations, are shown in Fig. 7. Even though the second test is clearly faster, the results should not be compared head to head: as far as speed is concerned, the two test are fundamentally different, since in the second test, the users could immediately turn towards the known real world object. This reduces the time needed to complete the task significantly. There are also fewer objects to choose from in the second test.
Fig. 7. The task completion times and standard deviations. The shorter the bar, the faster.
Accessing Context in Wearable Computers
71
Fig. 8. The speed in both test sections. The lower the bar, the faster.
72
We also calculated the relative speed, i.e. how long does it take to perform a one-degree turn. The results are shown in Fig. 8. It can be seen that the relative speed is faster in the second test section in all but the last tasks. The t-test returned a p-value of 0.001 (t = 3.24) showing significant statistical difference. There is no evident explanation for the low performance in virtual tasks 1,4 and 5. The user satisfaction query showed that overall, user’s think that Context Compass is easy and natural to use. We asked users to rate the following attributes in the scale of 1–5: speed, accuracy, pleasantness, naturality of use, easiness, and physical strain. The results are shown in Table 1. The worst problems seem to be the accuracy and physical strain. The video analysis showed that these are mainly due to the inaccuracy in the compass hardware (even if the user kept his or her head still, the compass had slight jitter that brought the object out of focus). This, in turn, caused extra strain when trying the keep the object in focus for a prolonged amount
of time. The most preferred factors were the easiness and pleasantness.
6. Discussion Above all, the experiment described above was a pilot study, evaluating both the evaluating method and the technique itself. Therefore, the results should be interpreted as trend setting and a basis for further research. The evaluation method worked fine indoors, but it is not suitable for outdoor use as it is. The user was hardwired to the video mixer, which does not allow moving. To make the system usable outdoors, the test subject should be able to move freely. The enabling technology here is the transfer of the video signal from the test subject to the test supervisor wirelessly. There are several suitable ways to do this. A battery powered video mixer coupled with a wireless composite signal transmitter would allow the test subject and test supervisor to move freely and independently of each other. The other
Table 1. The results of the opinion survey. The scale is 1–5. The higher the rate, the more the respective attribute is perceived to describe Context Compass Speed
Accuracy
Pleasantness
Naturality
Easiness
Strain
U1 U2 U3 U4 U5 U6
4 2 4 4 4 4
4 4 3 4 4 2
5 4 4 2 5 4
5 2 4 4 5 3
5 5 5 4 5 4
5 2 2 4 3 5
Average
3.67
3.50
4.00
3.83
4.67
3.50
J. Lehikoinen and R. Suomela
possibility would be to transfer the video signal digitally over the WLAN and create the view of the test subject in software. In addition to the indoor vs. outdoor issue, one should also consider the artificial nature of the icons used in the current version of the method. On the one hand, the letters are unambiguous and easy to distinguish from each other, and therefore ideal as evaluation objects. On the other hand, even in controlled laboratory evaluations, the objects should in a way or another be related to the evaluation environment. This would make the user motivation much easier. One just has to design the objects so that they are easy to tell apart while still resembling the contents. One might justifiably argue that the results on the passings analysis is negligible. First, the jitter caused by the compass affected the results, and secondly, it is self-evident that selecting a real world objects is easier. We will consider both these potential claims. As for the jitter, we think that even though it clearly affected the results, the effect was equal in every task. Therefore, it should not significantly affect the differences found in the passings analysis, but rather the absolute number of misses. What it does affect, however, is the personal experience, as stated above. Even though the passings analysis results seem self-evident, we think it is not. It is clear that locating an object that can be seen in the real world is easier; however, once the object is displayed in Context Compass on the screen, the ease of selection should be equal no matter whether the object is seen in the real world or not. Actually, since a system like this is not absolutely accurate when it comes to the realworld positions of the objects, one might consider it harder to try and select an object by looking at the real-world object; most probably the selection will fail. In the end, in both cases the objects are equally accessed once the object becomes visible on the display. The results showed that Context Compass is best suited for pointing at known objects, especially when there are real-world counterparts to those objects. The passings analysis showed that it is easier to fixate on a real world target, and the speed analysis proved that known real world objects are faster to locate. Further, the analysis of the time needed per one degree turn showed that virtually no learning had occurred
during the test. Therefore, it can be concluded that the users learned to use Context Compass immediately. This was also confirmed by the results of the opinion survey.
7. Conclusion We have designed and implemented a system for accessing contextual information in a wearable computer. Our system, called Context Compass, is based on a regular compass metaphor; by orienting towards the point of interest, the user can bring that object into focus to be easily selected and viewed. Our context accessing system supports the fundamental basics behind the wearable computing paradigm. It takes into account the natural ways humans are accustomed to showing their focus of attention, and it does not prevent the user from performing other tasks. We have also developed an evaluation method for Context Compass. A pilot study applying the new method showed that the method is appropriate, and that Context Compass suits especially well for accessing virtual objects that appear on the real world as well. Acknowledgements The authors wish to thank Aino Ahtinen, Timo Koskinen, Ilkka Salminen and Mika Ro¨ykkee from Nokia Research Center. The first author is associated with TaUCHI (The CHI group at The University of Tampere, Finland) and wishes to thank Kari-Jouko Ra¨iha¨, the head of the group, for support. This project is partly funded by Tekes Technology Development Centre, Finland. References 1. Suomela R, Lehikoinen J. Context Compass. Proceedings of the Fourth International Symposium on Wearable Computers. IEEE, 2000; 147–154 2. MIL-STD-1787B (USAF) Military interface standard: Aircraft display symbology. 5 April 1996 3. Schilit B, Adams N, Want R. Context-aware computing applications. Proceedings of the IEEE Workshop on Mobile Computing Systems and Applications. 1994; 85– 90 4. Pascoe J. Adding generic contextual capabilities to wearable computers. Proceedings of the Second International Symposium on Wearable Computers (ISWC). 1998; 92–99 5. Azuma RT. A survey of augmented reality. Presence 1995; 6(4): 30–145 6. Feiner S, MacIntyre B, Ho¨llerer T, Webster A. A touring
Accessing Context in Wearable Computers
73
7.
8.
9.
10.
11.
machine: prototyping 3D mobile augmented reality systems for exploring the urban environment. Proceedings of the First International Symposium on Wearable Computers (ISWC). 1997; 74–81 Azuma R, Hoff B, Neely H, III, Sarfaty R. A motionstabilized outdoor augmented reality system. Proceedings of Virtual Reality. 1999; 252–259 Rekimoto J, Ayatsuka Y, Hayashi K. Augment-able reality: situated communication through physical and digital spaces. Proceedings of the Second International Symposium on Wearable Computers (ISWC). 1998; 68 – 75 Thomas B, Demczuk V, Piekarski W, Hepworth D, Gunther B. A wearable computer system with augmented reality to support terrestrial navigation. Proceedings of the Second International Symposium on Wearable Computers (ISWC). 1998; 168 –171. Abowd GD, Atkeson CG, Hong J, Long S, Kooper R, Pinkerton M. Cyberguide: A mobile contextaware tour guide. Wireless Networks 1997; 3(5): 421–433 Billinghurst, M, Bowskill J, Dyer N, Morphett J. An
74
J. Lehikoinen and R. Suomela
12.
13.
14. 15.
evaluation of wearable information spaces. Proceedings of the Annual International Symposium on Virtual Reality. 1998; 20–27 Lehikoinen J, Ro¨ykkee M. N-Fingers: A finger-based interaction technique for wearable computers. Interacting with Computers. 2001; 13(5): 601–625 Suomela R, Lehikoinen J, Salminen I. A system for evaluating augmented reality user interfaces in wearable computers. Proceedings of the Fifth International Symposium on Wearable Computers (ISWC), 2001; 77–84 Cell computing. Online document, available at http:// www.cellcomputing.com/ (last checked October 3, 2001) Microvideo miniature video camera. Online document, available at http://www.microvideo.ca/ (last checked October 3, 2001)
Correspondence to: J. Lehikoinen, Nokia Research Center, PO Box 100, 33720 Tampere, Finland. Email: juha.lehikoinen@ nokia.com