Indian Journal of Science and Technology, Vol 8(10), 897–905, May 2015
ISSN (Print) : 0974-6846 ISSN (Online) : 0974-5645
Adaptability Resistances in ERP Implementation among Apparel Industry: An Empirical Study M. K. Gandhi1*, S. Gopalakrishnan2 and S. Gopalakrishnan3 IT, National Institute of Fashion Technology, Rajiv Gandhi Salai, Taramani, Chennai 600100, India;
[email protected] 2 Resource Centre, National Institute of Fashion Technology, Rajiv Gandhi Salai, Taramani Chennai 600100, India;
[email protected] 3 Emeritus (Asst. University Librarian), Anna University, Chennai, India;
[email protected] 1
Abstract Objectives: This paper identifies the limitations of ERP packages being used in Apparel industries and also identifies the crux in ERP in relation to the apparel industries. Methods/Analysis: Out of 117, 27 apparel industries were from Bangalore, 69 from Tirupur and 21 from Chennai have ERP packages. Out of 117, only 82 industries implemented fully of which 15 in Chennai, 46 in Tirupur and 21 are from Bangalore. The data thus received were analyzed using SPSS package. The statistical tools such as percentile, factor analysis, cluster analysis, Reliability test for the variables have been employed in the study. Findings: These apparel industries encounter various issues during implementation within the organization in the form of resistance, conflict, non-cooperation; indulge in activities against the interest of the organization etc., due to various reasons. Many of these issues are caused by internal employees of the organization which could have been averted. These external factors can overcome by the organization. Sometimes there exist functional limitations which can be identified only through utility. The sixteen variables thus used to evaluate the functional limitations of Apparel industry have been evaluated with Reliability test. The Cronbach alpha value for these 16 variables works out to 0.9677 which indicates that the variables taken up for the study is excellent. Majority of the companies indicated three areas that needs pruning in ERP packages. They are: Calculation of Manufacturing cost, Cost Analysis Report and Warehouse Management. These intrinsic issues are highly sensitive, challenging and it may lead to delay the ERP utilization process or sometimes leads to failure.Conclusion: The intrinsic issue raises adaptability resistances in other apparel industries that are planning to implement ERP system. To overcome these resistances, the add-on solutions will enable the apparel industries to implement the ERP packages.
Keywords: Adaptability of ERP, Apparel Cost Analysis Report, Apparel Industry, ERP in Apparel Industry, ERP Implementation, Warehouse Management
1. Introduction Textile and Clothing (T&C) industry plays pivotal role in Indian economy. The textile and apparel trade was estimated to be USD 662 billion in 2011 in which Indian textile and apparel exports has 3% share on the global market (USD 19.86 Billion). The value chain of Indian Textile and Clothing industry comprises of spinning, weaving, knitting and garmenting. The size of the Indian *Author for correspondence
textile and apparel domestic market was estimated to be Rs 2,73,000 crores (USD 58 billion) in 2011 and is projected to grow at 9% CAGR to Rs 6,64,000 crores (USD 141 billion) by 2021. The Indian textile and apparel sector provide direct employment to 45 million and with an additional employment of 60 million in allied sector1. Apparel Industry in India operates in major production centers namely New Delhi, Mumbai, Chennai, Bangalore, Tirupur and Ludhiana. Out of the 3000 apparel manufacturing units registered under Apparel Export
Adaptability Resistances in ERP Implementation among Apparel Industry: An Empirical Study
Promotion council in Bangalore, Chennai and Tirupur. These companies produce products of international standards with state of art technology and produced high quality garments majority of these companies are unorganized. Apparel manufacturing process is as good as any manufacturing processes such as automobile, pharmaceutical, steel manufacturing etc. Apparel Manufacturing has set of processes which are interrelated and share vital source of information from one another. These Enterprise Resource Planning (ERP) applications also find intrusion in fashion and apparel industries. Yet many of the established companies adhere to the best production practices and places state of art processes in place. The companies which believe in transparency use software to monitor the manufacturing processes. Many companies use automation processes for selective operations such as Marketing and Merchandising, Pattern Making, Production Planning, Finance, Supply chain, Human Resource etc. Selective companies use ERP software for integrated enterprise solution. Some of the ERP software used in the Apparel Industry are: Buyer Ease, Data tex, Fast React, Microsoft Navision/ Dynamics from Microsoft, REACH ERP, SAP Apparel Footwear and Solution, Simparel, Stage, Visual Gems and World Fashion Exchange. ERP manages, through integration, all aspects of a business including production planning, purchasing, manufacturing, sales, distribution, accounting and customer service1. Other possible decisions of implementation practices include process standardization2, package customization3,4, degree of information sharing and centralization, accessibility to ERP information, and the degree of centralization5. Those are practices believed to be critical the success of implementation6. Some researchers investigated critical factors such as top management support, sufficient training, proper project management, communication, etc. to the success of ERP implementation7–12. Others studied tactical issues such as process and organizational adaptation, measurement of the benefits, and resistance to change13–15. The domain specific ERP implementation studies have not been attempted especially in fashion and apparel industries. Therefore, an attempt has been made to identify the adaptability resistances in ERP implementation. An ERP implementation is considered a failure if it does not achieve a substantial proportion of its potential organizational benefits.
898 Vol 8 (10) | May 2015 | www.indjst.org
This leads to adaptability resistances in ERP implementation in other industries. Therefore this study also wishes to identify the adaptability resistances from the 82 apparel industries those who have implemented successfully.
2.
Data Analysis
There are number of apparel industries in Tamil Nadu and Bangalore. In these industries only few industries have implemented or concentrated in implementing ERP in their industry. Out of which, industries in three cities in Chennai, Tirupur and Bangalore were identified. There exist 3200 apparel industries registered in Chennai, Tirupur and Bangalore with Apparel Export Promotion Council of India in this around 380 are active apparel manufacturing business which has automation and ERP implementation. Out of the 380 apparel industries nearly 200 industries have been identified in the proportion of 50 in Chennai, 100 in Tirupur and 50 in Bangalore. The questionnaires were distributed among these 200 industries and only 117 industries were responded. The response rate is 58.5%. Out of 117 industries 27 industries were from Bangalore, 69 industries from Tirupur and 21 industries from Chennai (Table 1). Table 1. Implementation of ERP in Apparel Industry S.No
Place
Implemented
In progress
Total
1
Bangalore
21 (77.8%)
6 (22.2%)
27 (100.0%)
2
Tirupur
46 (66.7%)
23 (33.3%)
69 (100.0%)
3
Chennai
15 (71.4%)
6 (28.6%)
21 (100.0%)
Total
82 (70.08%)
35 (29.92%)
117 (100.0%)
In the case of apparel industries, there may be differences on: Expectations from ERP software, Merchandising and Analytics as a major changes comparing to other industries. Therefore these three factors alone evaluated among the apparel industries.
3. Expectations from ERP Software
Indian Journal of Science and Technology
M. K. Gandhi, S. Gopalakrishnan and S. Gopalakrishnan
Expectations on the ERP software has been analysed based on four factors such as Supplier and Customer satisfaction; Increase in Productivity; Reduction in Cycle time and reduction in inventory level. The satisfaction and non-satisfaction levels are shown in the Table 2.
The reliability test has been administrated for the variables taken up for the study using the formula Reliability is concerned with consistency of a variable. There are two identifiable aspects of this issue: external and internal reliability. Nowadays, the most common method of
Table 2. Satisfaction level of ERP in Apparel Industry S.No 1 2 3 4
Description Lead to supplier and customer satisfaction Increase overall productivity Reduced cycle time Reduced inventory levels
C
Satisfied T
B
C
Not Satisfied T
B
9 (60.0%)
38 (82.6%)
15 (71.4%)
6 (40.0%)
8 (17.4%)
6 (28.6%)
12 (80.0%) 12 (80.0%) 12 (80.0%)
46 (100.0%) 35 (76.1%) 46 (100.0%)
15 (71.4%) 12 (57.1%) 21 (100.0%)
3 (20.0%) 3 (20.0%) 3 (20.0%)
0 (.0%) 11 (23.9%) 0 (.0%)
6 (28.6%) 9 (42.9%) 0 (.0%)
In the case of supplier and customer satisfaction 40% are not satisfied in Chennai similarly 17.4% are not satisfied in Tirupur and 28.6% were not satisfied in Bangalore. In the case of Increase in Overall Productivity, 20% are not satisfied in Chennai and 28.6% are not satisfied in Bangalore. It is also interesting to note that all the industries in Tirupur are satisfied. Therefore it is inferred that Urban based industries looking more on the productivity than that of rural. This may be basically because of available resources on latest trends and curiosity in implementing it. In the case of Reduction (life) cycle time, 20% are not satisfied in Chennai, 11% are not satisfied in Tirupur and 42.9% were not satisfied in Bangalore. In the case of Reduction in inventory levels, 20% are not satisfied in Chennai whereas all are satisfied in Tirupur and Bangalore. ERP packages in apparel industries are expected to have Reduction in Cycle time. However supplier and customer satisfaction are to be concentrated.
3.1 Merchandising Out of 82 industries implemented further analysis was conducted on the satisfaction level on the ERP packages based on the features used in the merchandising module of the ERP software. The features such as Style Manager; Season; Colour; size; Pattern;. Tech Pack; Fabric; Accessories; Trims; Measurement; Wash Care details, Testing Report; finishing details; Buyer Details; Supplier information; and Product Categories.
Vol 8 (10) | May 2015 | www.indjst.org
C
Ratio T
B
0.66
0.21
0.40
0.25
0
0.40
0.25
0.31
0.75
0.25
0
0
estimating internal reliability is Cronbach’s alpha (α). The formula used is
K 1 − a = K −1
∑
K
2 i =1 Yi 2 X
s
s
A commonly accepted rules for describing internal consistency using Cronbach’s alpha (Cronbach, Lee and Shavelson 2004) are ἀ ≥ 0.9 (Excellent), 0.9 > ἀ ≥ 0.8 (Good), 0.8 > ἀ ≥ 0.7 (Acceptable), 0.7 > ἀ ≥ 0.6 (Questionable), 0.6 > ἀ ≥ 0.5 (Poor) and 0.5 > ἀ(Unacceptable).The concept “merchandising” taken up for the study, variables and the Cronbach alpha value works out to 0.9677 which indicates the variables taken up for the study is excellent. The Cronbach’s alpha value for all the variables are shown in annexureI.The satisfaction and non-satisfaction levels are shown in Table 3 Ratio of Satisfaction over non-satisfaction is calculated and same is shown on the Table 3. In the case of Chennai 20% are not satisfied in features such as Style Manager, Colour, size, fabric, accessories, trims, wash care, Finishing details, Buyer details and supplier details. However Tirupur and Bangalore had complete satisfaction on the Style Manager, Colour, size, fabric, accessories, trims, wash care, Finishing details, Buyer details and supplier details.
Indian Journal of Science and Technology
899
Adaptability Resistances in ERP Implementation among Apparel Industry: An Empirical Study
Table 3. Satisfaction level on Merchandising Module in ERP Software C 12 (80.0%)
Satisfied T 46 (100.0%)
B 21 (100.0%)
Not Satisfied C T B 3 0 0 (20.0%) (0.0%) (0.0%)
C
Ratio T
B
0.25
0.00
0.00
Season
15 (100.0%)
46 (100.0%)
21 (100.0%)
0 (0.0%)
0 0 (0.0%) (0.0%)
0.00
0.00
0.00
3
Colour
12 (80.0%)
46 (100.0%)
21 (100.0%)
3 (20.0%)
0 0 (0.0%) (0.0%)
0.25
0.00
0.00
4
Size
12 (80.0%)
46 (100.0%)
21 (100.0%)
3 (20.0%)
0 0 (0.0%) (0.0%)
0.25
0.00
0.00
5
Pattern
12 (80.0%)
38 (82.6%)
18 (85.7%)
3 (20.0%)
8 3 (17.4%) (14.3%)
0.25
0.21
0.17
6
Tech Pack
9 (60.0%) 12 (80.0%) 12 (80.0%) 12 (80.0%) 12 (80.0%)
38 (82.6%) 46 (100.0%) 46 (100.0%) 46 (100.0%) 38 (82.6%)
15 (71.4%) 21 (100.0%) 21 (100.0%) 21 (100.0%) 15 (71.4%)
6 (40.0%) 3 (20.0%) 3 (20.0%) 3 (20.0%) 3 (20.0%)
8 (17.4%) 0 (0.0%) 0 (0.0%) 0 (0.0%) 8 (17.4%)
0.67
0.21
0.40
7
Fabric
0.25
0.00
0.00
8
Accessories
0.25
0.00
0.00
9
Trims
0.25
0.00
0.00
10
Measurement
0.25
0.21
0.40
11
Wash Care Details
12 (80.0%)
46 (100.0%)
21 (100.0%)
3 (20.0%)
0 0 (0.0%) (0.0%)
0.25
0.00
0.00
12
Testing Report
9 (60.0%)
46 (100.0%)
15 (71.4%)
6 (40.0%)
0 6 (0.0%) (28.6%)
0.67
0.00
0.40
13
Finishing Details
12 (80.0%)
46 (100.0%)
21 (100.0%)
3 (20.0%)
0 0 (0.0%) (0.0%)
0.25
0.00
0.00
14
Buyer (Customer)
12 (80.0%)
46 (100.0%)
21 (100.0%)
3 (20.0%)
0 0 (0.0%) (0.0%)
0.25
0.00
0.00
15
Supplier
12 (80.0%)
46 (100.0%)
21 ((100.0%)
3 (20.0%)
0 0 (0.0%) (0.0%)
0.25
0.00
0.00
16
Product Categories
12 (80.0%)
46 (100.0%)
18 85.7%)
3 (20.0%)
0 3 (0.0%) (14.3%)
0.25
0.00
0.17
S.No
Description
1
Style Manager
2
In the case of Pattern details feature used in ERP software, 20% are not satisfied in Chennai. Similarly 17.4% are not satisfied in Tirupur and 14.3% were not satisfied in Bangalore. In the case of Technical Pack feature used in ERP software, 40% in Chennai and 17.4% in Tirupur and 28.6% in Bangalore were not satisfied. As in the case of Measurement features, 20% in Chennai, 17.4% in Tirupur
900 Vol 8 (10) | May 2015 | www.indjst.org
6 (28.6%) 0 (0.0%) 0 (0.0%) 0 (0.0%) 6 (28.6%)
and 28.6% in Bangalore are not satisfied. In the case of Testing Report feature used in ERP software, 40% in Chennai and 28.6% in Bangalore are not satisfied wherein 100% are satisfied in Tirupur. In the case of Testing Report feature used in ERP software, 20% and 14.3% in Chennai and Bangalore are not satisfied and 100% are satisfied in Tirupur.
Indian Journal of Science and Technology
M. K. Gandhi, S. Gopalakrishnan and S. Gopalakrishnan
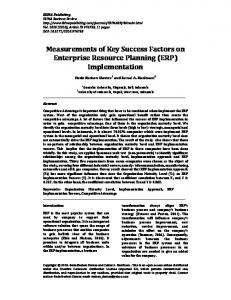
Hierarchical cluster test has been administrated and the dendrogram thus arose is shown in Figure 1.
At 50% level there exist two clusters. Cluster 1 comprises of Tech Park, fabric, measurement and technical report can be named as low level satisfaction on ERP package. Cluster 2 comprises of other variables that can be named as moderate level of satisfaction on ERP packages. Further factor analysis has been carried out to divide the variables into components using principle component analysis. The factor analysis is shown in Table 4. As can be seen from the table, the variables are grouped into three components. Eigen values greater than 1. “1” was the criterion for retention of a factor, which indicates that only the first three factors are to be extracted. It can be seen that the variances were more widely distributed in the rotated sum of the squared loading (44.449%, 26.932% and 23.309% respectively, Cumulative variance 94.689), which shows that the three factors are interpretable. The three components were extracted and named as “High Level Satisfaction”; “Moderate level Satisfaction” and “Low Level Satisfaction”. Thus the low level satisfaction variables “pattern”, “tech pack”, ‘measurement” and “testing report” needs much concentration while developing ERP application. The first three variables coincide with the cluster.
Vol 8 (10) | May 2015 | www.indjst.org
3.2 Analytics ERP software provides various reports and analytic for analyzing the progress of the organization. The reports are Daily Production report, Productivity Analysis, Rejection Analysis, Quality Control report, Manpower Report, Cutting Department Report, Sewing Department Report, Finishing Department Report, Shipment Details and Work in Progress Report. Satisfaction level on these reports were analysed from the industries implemented ERP allocation Table 5 shows that all the industries implemented ERP system are satisfied with the report generated by ERP software such as Daily Production Report, Production Analysis, Rejection analysis Quality Control, finishing Department report, report on shipment details and Work in progress. However little dissatisfaction in industries based at Chennai and Bangalore in Manpower Report, Cutting Department Report and Reports generated in Sewing Department.
Indian Journal of Science and Technology
901
Adaptability Resistances in ERP Implementation among Apparel Industry: An Empirical Study
Table 4. Component analysis for Merchandising Component
Variable code
Variables
O8BMERCH O8DMERCH O8GMERCH O8HMERCH O8IMERCH O8KMERCH O8MMERCH O8NMERCH O8OMERCH O8AMERCH O8CMERCH O8LMERCH O8EMERCH O8FMERCH O8JMERCH V52_A
Season Size Fabric Accessories Trims Wash Care Details Buyer (Customer) Supplier Product Categories Style Manager Colour Finishing Details Pattern Tech Pack Measurement Testing Report Eigenvalues Cumulative
1 .899 .856 .856 .856 .856 .856 .856 .856 .584
2
3
.884 .884 .884
7.112 44.449
.864 .936 .923 .795 3.729 94.689
4.309 71.380
Table 5. Satisfaction level on Analytics Module in ERP Software C 15 (100.0%) 15 (100.0%) 15 (100.0%) 15 (100.0%) 12 (80.0%)
Satisfied T 46 (100.0%) 46 (100.0%) 46 (100.0%) 46 (100.0%) 46 (100.0%)
Cutting Department Report
12 (80.0%)
46 (100.0%)
18 3 0 (85.7%) (20.0%) (0.0%)
7
Sewing Department Report
12 (80.0%)
46 (100.0%)
8
Finishing Department Report
9
Shipment Details
10
Work in Progress Report
15 (100.0%) 15 (100.0%) 15 (100.0%)
46 (100.0%) 46 (100.0%) 46 (100.0%)
S.No
Description
1
Daily Production
2
Productivity Analysis
3
Rejection Analysis
4
Quality Control
5
Manpower Report
6
902 Vol 8 (10) | May 2015 | www.indjst.org
B 21 (100.0%) 21 (100.0%) 21 (100.0%) 21 (100.0%) 21 (100.0%)
Not Satisfied C T B 0 0 0 (0.0%) (0.0%) (0.0%) 0 0 0 (0.0%) (0.0%) (0.0%) 0 0 0 (0.0%) (0.0%) (0.0%) 0 0 0 (0.0%) (0.0%) (0.0%) 3 0 0 (20.0%) (0.0%) (0.0%)
C
Ratio T
B
0.00
0.00
0.00
0.00
0.00
0.00
0.00
0.00
0.00
0.00
0.00
0.00
0.25
0.00
0.00
3 (14.3%)
0.25
0.00
0.17
18 3 0 (85.7%) (20.0%) (0.0%)
3 (14.3%)
0.25
0.00
0.17
21 0 (100.0%) (0.0%) 21 0 (100.0%) (0.0%) 21 0 (100.0%) (0.0%)
0 (0.0%) 0 (0.0%) 0 (0.0%)
0.00
0.00
0.00
0.00
0.00
0.00
0.00
0.00
0.00
0 (0.0%) 0 (0.0%) 0 (0.0%)
Indian Journal of Science and Technology
M. K. Gandhi, S. Gopalakrishnan and S. Gopalakrishnan
Table 6. Crux in ERP Implementation in Apparel Industry S.No 1 2
Description Calculation of Manufacturing cost / each order Cost Analysis report [Actual Vs. Projected]
3
Warehouse management
4
Dead stock
SA
SD
D
In progress NO
0 .0%
16 45.7%
14 40.0%
2 5.7%
2 5.7%
1 2.9%
34 44 2 1 1 41.5% 53.7% 2.4% 1.2% 1.2%
8 22.9%
24 68.6%
2 5.7%
0 .0%
1 2.9%
15 63 1 2 1 18.3% 76.8% 1.2% 2.4% 1.2% 16 63 0 2 1 19.5% 76.8% .0% 2.4% 1.2%
2 5.7% 3 8.6%
30 85.7% 29 82.9%
1 2.9% 1 2.9%
2 5.7% 2 5.7%
0 .0% 0 .0%
SD
Implemented D NO A
50 24 7 1 61.0% 29.3% 8.5% 1.2%
A
SA
Item-total Statistics Scale Mean if Item Deleted
Scale Variance if Item Deleted
Corrected ItemTotal Correlation
Alpha if Item Deleted
O8AMERCH
26.9829
22.9307
.8141
.9657
O8BMERCH
26.9829
23.2928
.6847
.9673
O8CMERCH
26.9829
22.9307
.8141
.9657
O8DMERCH O8EMERCH
27.0342 27.1966
22.1023 22.8145
.9292 .5305
.9636 .9710
O8FMERCH O8GMERCH O8HMERCH O8IMERCH
27.2991 27.0342 27.0342 27.0342
21.9873 22.1023 22.1023 22.1023
.6815 .9292 .9292 .9292
.9686 .9636 .9636 .9636
O8JMERCH
27.2735
21.9246
.7040
.9681
O8KMERCH
27.0342
22.1023
.9292
.9636
V52_A
27.2308
21.9549
.7160
.9677
O8LMERCH
26.9829
22.9307
.8141
.9657
O8MMERCH O8NMERCH
27.0342 27.0342
22.1023 22.1023
.9292 .9292
.9636 .9636
O8OMERCH
27.0342
22.4643
.8163
.9653
3.3 Major Crux in ERP Implementation in Apparel Industry Majority of the companies indicated that the following 3 areas needs pruning in ERP packages. They are: Calculation of Manufacturing cost, Cost Analysis Report and Warehouse Management. Opinions on these three variables are further ascertained using five point scale such as Strongly disagree, Disagree, No opinion, Agree and Strongly Agree. The opinions were shown in Table 6. R E L I A B I L I T Y A N A L Y S I S on Merchandising 1. 2. 3. 4. 5. 6. 7. 8. 9. 10. 11. 12. 13. 14. 15. 16.
O8AMERCH Style Manager O8BMERCH Season O8CMERCH Colour O8DMERCH Size O8EMERCH Pattern O8FMERCH Tech Pack O8GMERCH Fabric O8HMERCH Accessories O8IMERCH Trims O8JMERCH Measurement O8KMERCH Wash Care Details V52_A Testing Report O8LMERCH Finishing Details O8MMERCH Buyer (Customer) O8NMERCH Supplier O8OMERCH Product Categories
Vol 8 (10) | May 2015 | www.indjst.org
R E L I A B I L I T Y A N A L Y S I S - S C A L E (A L P H A)Analysis of Variance Source of Variation Between People Within People Between Measures Residual Total Grand Mean
Sum of Sq.DF
Mean
Square
184.1453
116
1.5875
109.6875
1755
0.0625
20.5849
15
1.3723
89.1026 293.8328
1740 1871
0.0512 0.1570
F
Prob.
26.7989
0.0000
1.8050
Indian Journal of Science and Technology
903
Adaptability Resistances in ERP Implementation among Apparel Industry: An Empirical Study
Reliability Coefficients N of Cases = 117.0 Alpha = .9677
N of Items = 16
3.4 Crux in Calculation of Manufacturing Cost It can be seen from Table 6 that those who have implemented the ERP packages indicated that the package causing an error in calculation of manufacturing cost nearly 90.3% indicated that either they are Disagree or strongly disagree on this aspect. 8.5% of the respondents not provided any opinion. Only one respondent indicated agreed that the manufacturing cost satisfactorily calculating the manufacturing cost for each order. Similarly the in the case of in progress respondents 85.7% indicated the same problem. 5.7% indicated no opinion. Only 8.6% indicated either agree or strongly agree that the manufacturing cost satisfactorily calculating the manufacturing cost for each order.
3.5 Crux in Cost Analysis between Actual and Project Manufacturing Cost In the case of Cost Analysis report between actual and projected 95.2% of the ERP implementers indicated that they either disagree or strongly disagree with the factor. 2.4 % has not accorded any opinion. The remaining 2.4% stated that they either agree or strongly agree that it provides complete cost analysis report between Actual cost and Projected Cost. In case of In-Progress ERP users indicated 91.5% mention they either disagree or strongly disagree on the cost analysis report. 5.7% of the respondents not provided any opinion. However 2.9% strongly that it provides complete cost analysis report.
3.6 Crux in Warehouse Management 95.1% of the ERP implementers indicated that they are either disagree agree or strongly disagree on the warehouse management part of the ERP. Only 3.6% of the respondents indicated that they agree and strongly with the warehouse management process. 91.4% of the In-progress implementers also indicated that they are either disagree or strongly disagree with the warehouse management part of the ERP. Only 5.7% of the respondents indicated that they agree and strongly with the functioning warehouse management process.
904 Vol 8 (10) | May 2015 | www.indjst.org
3.7 Crux in Dead Stock Account 96.1% of the ERP implementers indicated that they are either disagree agree or strongly disagree on the features available to track the dead stock at the warehouse. Only 3.6% of the respondents indicated that they agree and strongly with the features available to track the dead stock at the warehouse Management Process. 91.5% of the In-progress implementers also indicated that they are either disagree or strongly disagree with the features available to track the dead stock at the warehouse. Only 5.7% of the respondents indicated that they agree and strongly with the functional features available to track the dead stock at the warehouse management process.
4. Discussion “Acceptance” and “Adaptability “are correlated. End user “Adaptability” results in more acceptance. Organisation has to create a “Trust” among the users in order to reduce their concerns. IT skills of the user provides comfortable working environment which results in higher end user acceptance. End users concern is on the raise when they are less comfortable with the system due to marginal IT skills. It may be difficult to understand the configuration of ERP for a person with relatively strong understanding of technology, primarily due to complexity of the ERP system. Building the IT skills is the only solution to build end-users confidence in the acceptance of the new system, but they do not necessarily guarantee a successful implementation. The understanding of the system is essential for an employee that can help them to face new challenges and learn how to make good use of the technology. In order to make the end user, understanding the technical and functional aspects of the system, the organisation has to conduct periodic training to the end users. Therefore, training is the key to increase user acceptance and alleviate concern. It is also equally important to address end user concerns and enhance their confidence with their IT skills and understanding of the project.
5. Conclusion
Indian Journal of Science and Technology
M. K. Gandhi, S. Gopalakrishnan and S. Gopalakrishnan
ERP facilitates, if well-implemented, the integration of all the functional information flows across the organization into a single package with a common database. Today, many public and private organizations worldwide are implementing ERP systems in place of the functional legacy systems that are not anymore well-compatible with modern business environment. The implementation of ERP finds intrusion in textile industry especially in apparel industry. The barriers, while implementing ERP, which are commonly categorized as intrinsic and extrinsic. Extrinsic barriers such as huge capital incurred for software, poor planning or poor management, lack of perfection, lack of training and predetermined corporate goals, lack of risk assessment, lack of approach however can overcome. The intrinsic barriers as lack of data models (support), lack of system performance, lack of hierarchical attribute structure and lack of functional process of the domain of the industry will leads to adaptability resistances in ERP utilization. In other words, in order to increase user acceptance, organisation should ensure that the end users are confident with their IT skills, their understanding of the ERP project, and their ability to adapt to the new system. Few of the functions, in Apparel industry ERP packages are not fulfilling the standard minimum requirements. Ever growing needs of the organization and industry powered by technology that forces organization to expand the boundaries of the ERP system used. In order to expand the boundaries of existing ERP system organization needs to upgrade the software or add new modules in order to meet the growing needs. With the cost of the ownership available with the organization, Cost of ownership gives the wisdom to an organization to take a call on availing the services of the vendor or developing a module with the resources available in house or outsource the same.
Vol 8 (10) | May 2015 | www.indjst.org
6. References 1. Scalle CX, Cotteleer MJ. Enterprise Resources Planning (ERP). Boston, MA: Harvard Business School Publishing; 1999. 2. Bingi P, Sharma MK, Golda JK. Critical issues affecting an ERP implementation. Inform Syst Manag. 1999; 3921:7– 14. 3. Glass RL. Enterprise resource planning–breakthrough and/or term problem? Data Base. 1998; 29 (2):14–6. 4. Hong HK, Kim YG. The critical success factors for ERP implementation: an organizational fit perspective. J Inform Manag. 2002; 40(1):25–40. 5. Markus ML, Tanis C, Van Fenema PC. Multisite ERP implementations. Comm ACM. 2000; 43 (4):42–6. 6. Jacobs FR, Bendoly E. Enterprise resource planning: developments and directions for operations management research. Eur J Oper Res. 2003; 146:33–240. 7. Kumar L, Hillegersberg J. ERP experiences and evolution. Comm ACM. 2000; 43(3):22–6. 8. Griffith TL, Zammuto RF, Aiman-Smith L. Why new technologies fail? Ind Manag. 1999 May–Jun; 29–34. 9. Holland CP, Light B. A critical success factors model for ERP implementation. IEEE Software. 1999 May-June; 16(3):30–6. 10. Hong H K, Kim Y G. The critical success factors for ERP implementation: an organizational fit perspective. Journal of Information and Management. 2002; 40(1):25–40. 11. Verville JC, Halingten A. A qualitative study of the influencing factors on the decision process for acquiring ERP software. Qualitative Market Research. 2002; 5(3):188–98. 12. Willcocks JP, Sykes R. The role of the CIO and IT function in ERP. Comm ACM. 2000; 43(4):32–38. 13. Laughlin SP. An ERP game plan. J Bus Strat. 1999 Jan–Feb; 20(1):32–7. 14. Motwani J, Mirchandani D, Madan M, Gunasekaran A. Successful implementation of ERP projects: evidence from two case studies. Int J Prod Econ. 2002; 75(1):83–96. 15. Swan J, Newell S, Robertson M. The illusion of best practice in information system for operations management. Eur J Inform Syst. 1999; 8(4):284–93.
Indian Journal of Science and Technology
905