In the frame of turbine engine performance monitoring, system identification procedures are often ... Monitoring the engine health condition can be carried out by.
JOURNAL OF PROPULSION AND POWER Vol. 24, No. 4, July–August 2008
Adaptive Estimation Algorithm for Aircraft Engine Performance Monitoring Olivier Léonard,∗ Sébastien Borguet,† and Pierre Dewallef† University of Liège, 4000 Liège, Belgium DOI: 10.2514/1.34320 In the frame of turbine engine performance monitoring, system identification procedures are often used to adapt a simulation model of the engine to some observed data through a set of so-called health parameters. Doing so, the values of these health parameters are intended to represent the actual health condition of the engine. The Kalman filter has been widely used to achieve the identification procedure in real-time onboard applications. However, to achieve a proper filtering of the measurement noise, the health parameters are often assumed to vary in time relatively slowly, preventing any abrupt accidental events from being tracked effectively. This contribution presents a procedure called adaptive filtering. Based on a covariance-matching method, it is intended to automatically release the health parameters once an accidental event is detected. This enables the Kalman filter to deal with both continuous and abrupt fault conditions.
expressing mass, momentum, and energy balances inside the engine. They are capable of predicting most of the measurements taken along the engine gas path over its whole operating range. The nature of the parameters that are included in the model may vary from one manufacturer to another, but they usually consist of efficiency and flow-capacity correction factors of the main engine components. The simulation model is therefore able to predict the value of the measurements corresponding to specific ambient conditions (temperature, pressure, and humidity), control conditions (e.g., the power setting), and health conditions through a given set of health parameters. Doing so, the monitoring task is achieved by the resolution of an inverse problem in which the health-parameter deviations are determined based on the observation of the measurement drifts. System identification techniques provide a large set of methodologies intended to filter the measurements. In the turbine engine literature, the use of system identification techniques, together with measurements performed along the engine gas path, is usually referred to as gas-path analysis. The interested reader is referred to [1] for a simple yet complete introduction of the gas-pathanalysis approach to turbine engine monitoring. The Kalman filter is considered herein as an appropriate identification approach. The Kalman filter provides an optimal update of the health parameters (in the least-squares sense) each time new data are available, at the cost of a very low computational load. However, the correct filtering of the random measurement errors requires proper constraints to be set on the variation rate of the health parameters. In the frame of engine health monitoring, the transition model of the health parameters is based on the assumption of a relatively slow variation. Consequently, the Kalman filter tracks engine wear or compressor fouling with good accuracy. On the other hand, rapid deteriorations may also happen, caused by hot starts or foreign/domestic object damage, for instance. These brutal events impact one (at most two) component(s) at a time. The time of occurrence of the event, the impacted component, and the magnitude of the fault are typically unknown. The response of the Kalman filter to these short-time-scale variations of the engine condition is either a long delay in recognizing the fault and/or a spread of the estimated fault over several components, which is termed the smearing effect (see [2]). To overcome these deficiencies, a strategy that combines a socalled single-fault isolator with a Kalman filter is proposed in [3]. The single-fault isolator consists of a bank of specific Kalman filters corresponding to possible events that are examined whenever a residual is suspected to be representative of an abrupt fault. Provided that at least one of these specific filters correctly fits the situation at hand, the abrupt fault can be isolated and accommodated by the
Nomenclature k M N N �m; R�
= = = =
p0i Ti0 uk wk yk �k !k ^� :�
= = = = = = = = =
discrete time index size of the buffer rotational speed Gaussian probability density function with mean m and covariance matrix R total pressure at station i total temperature at station i control parameters health parameters observed measurements measurement noise vector process noise vector estimated value prior value
Introduction
I
N RECENT years, improving the availability of aircraft turbine engines and minimizing their maintenance costs have become key issues for airline companies. In this context, many research efforts are intended to dynamically adapt the maintenance planning based on the actual engine health condition, rather than using a fixed schedule based on the number of running hours. Monitoring the engine health condition can be carried out by observing the drifts from some reference values of a set of measurements performed onboard. However, because a deterioration of the engine condition generally involves a drift on nearly all of the measurements at the same time, the identification of the underlying component fault turns out to be difficult. Moreover, the measurements are corrupted by random errors for which the amplitude is comparable with the drifts induced by the faults of interest. To improve the significance of the measurement drifts, it is appropriate to translate them into a set of numerical parameters intended to represent the health condition of the engine. The link between the measurement drifts and the health-parameter deviations is established by an aerothermodynamic simulation model. Such models are based on the resolution of a set of equations Received 29 August 2007; revision received 14 March 2008; accepted for publication 18 March 2008. Copyright © 2008 by the American Institute of Aeronautics and Astronautics, Inc. All rights reserved. Copies of this paper may be made for personal or internal use, on condition that the copier pay the $10.00 per-copy fee to the Copyright Clearance Center, Inc., 222 Rosewood Drive, Danvers, MA 01923; include the code 0748-4658/08 $10.00 in correspondence with the CCC. ∗ Turbomachinery Group, Chemin des Chevreuils 1. † Turbomachinery Group, Chemin des Chevreuils 1. 763
764
LÉONARD, BORGUET, AND DEWALLEF
Algorithm 1 The extended Kalman filter
simulation model and the generic Kalman filter can be used again. Although very efficient, this solution implies the interaction between two different diagnosis tools. Moreover, the setup of the fault library requires significant knowledge and experience. A broader way to tackle the problem at hand is to view it in the realm of adaptive estimation [4]. The basic idea consists of momentarily increasing the mobility of the health parameters to recognize a rapid degradation. Mathematically, it leads to increasing the covariance of the health parameters on the basis of a statistical processing of the residuals. As an example, it is proposed in [5] to modify the transition model of the health parameters to account for possible jumps in the parameters. This technique has been successfully applied to engine health monitoring by the authors in [6]. Other techniques have been explored in the literature, such as autocorrelation [7,8] or covariance matching [9]. The present contribution investigates a similar approach in which the constraints on the health-parameter variation rate are adapted online such that they best fit the actual situation. Therefore, both abrupt and continuous faults can be processed by a single Kalman filter.
the prior covariance matrix P�w;k specifying the shape of this region. The second term reflects a weighted-least-squares criterion. To generate the a priori values of the health-parameter distribution ^ �k and covariance P�w;k ), a model describing the temporal (i.e., mean w evolution of the parameters must be supplied as well. Generally, little information is available about the way the engine degrades, which motivates the choice of a random-walk model.
Kalman-Filter-Based Diagnostics
w k � wk�1 � !k
The scope of this section is to describe the diagnosis tool that relies on the celebrated Kalman filter [10]. One of the masterpieces of this algorithm is a model of the jet engine. Considering steady-state operation of the gas turbine, these simulation tools are generally nonlinear aerothermodynamic models based on mass-, energy-, and momentum-conservation laws applied to the engine flowpath. Equation (1) represents such an engine model, in which k is a discrete time index, uk are the parameters defining the operating point of the engine (e.g., fuel flow, altitude, and Mach number), wk are the aforementioned health parameters, and yk are the gas-path measurements. A random variable �k 2 N �0; Rr �, which accounts for sensor inaccuracies and modeling errors, is added to the deterministic part G��� of the model to reconcile the observed measurements and the model predictions. Equation (1) is therefore termed the statistical model.
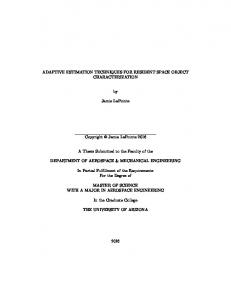
The random variable !k � 2 N �0; Rw;k � is the so-called process noise that provides some adaptability to track a time-evolving fault. In the present application, it is assumed that the health parameters vary independently, such that the covariance matrix Rw;k is strictly diagonal. Even if the transition model (5) appears quite simple, the covariance matrix Rw;k enables control of the stochastic character of the time series formed by the health parameters wk : low values mean slow variations, whereas high values suppose fast variations. Algorithm 1 summarizes the architecture of the Kalman filter in a pseudocode style. This algorithm has a predictor–corrector structure and involves only basic linear algebra operations. On line 2, prediction of the prior values of the health-parameter distribution are made through the transition model (5). Then the data are acquired and used for building the a priori residuals (lines 3 and 4). The Kalman gain Kk is then computed on line 5. Loosely speaking, it weights the uncertainty on the parameters versus the uncertainty on the measurements. Finally, the a posteriori distribution is assessed at the corrector step (line 6). To complete the picture, the block diagram in Fig. 1 shows the closed-loop predictor–corrector structure. The interested reader may consult [11] for an extensive derivation and additional details. The extended Kalman filter requires the Jacobian matrix Gk to be computed at each time step, which involves nw additional runs of the nonlinear model for forward or backward differences and 2 � nw for central differences. From a computational point of view, this situation is not favorable, because the processors currently available onboard aircraft engines are not able to achieve such tasks in real time. However, when small variations of the health parameters are considered, the matrix Gk does not change significantly with respect to wk , and an influence matrix computed for nominal health parameters often provides a sufficient accuracy (see [12] for a
y k � G�uk ; wk � � �k
(1)
In the frame of turbine engine diagnosis, the quantity of interest is the difference between the actual engine health condition and a reference condition. In this contribution, this reference value is represented by a so-called prior value, which designates a value of the health ^ �k that is available before the measurements yk are parameters w observed. Assuming a linear relationship between the measurements and the health parameters around the prior values, as well as given operating conditions, the statistical model is reformulated according to Eq. (2). ^ �k � � k � rk � Gk �wk � w
(2)
where ^ �k � r k ≜ yk � G�uk ; w
and
Gk ≜
� @G�uk ; wk � �� � @wk ^� wk �w
(3)
^ 0 , Pw;0 , Rr , Rw;k Require: w 1: for k > 0 do ^ �k � wk�1 and P�w;k � Pw;k�1 � Rw;k 2: w 3: acquire uk and yk ^ �k � 4: rk � yk � G�uk ; w 5: Kk � P�w;k GTk �Gk P�w;k GTk � Rr ��1 ^k �w ^ �k � Kk rk and Pw;k � �l � Kk Gk �P�w;k 6: w 7: end for
(5)
k
are, respectively, the a priori residuals and the Jacobian matrix of the ^ �k . engine model around the prior value w A common interpretation of the Kalman filter is that of a recursive Bayesian approach to parameter identification. Both the health parameters and the measurements are considered here as Gaussian random variables.‡ Within this framework, the estimated health parameters are obtained by minimizing the following objective function. ^ �k �T �P�w;k ��1 �wk � w ^ �k � � 12�Tk R�1 J �wk � � 12�wk � w r �k
(4)
The first term on the right-hand side of Eq. (4) forces the identified ^ �k , with parameters to remain in a neighborhood of the prior values w ‡ Statistically, they are hence thoroughly defined by their mean and covariance matrix.
yk
uk engine to monitor
simulation model
wk-
transition model
wk-1
-
rk
(u k,w-k)
unit delay
wk x Kalman gain
Fig. 1 Performance monitoring tool based on an extended Kalman filter for the case of a turbofan engine.
765
LÉONARD, BORGUET, AND DEWALLEF
discussion about the use of linear models in turbine engine diagnosis). Nonetheless, the matrix Gk also depends on the operating conditions uk and is still to be recomputed at each time step. However, when the model is used in small neighborhoods of some average flight conditions, the variation of the matrix Gk is often negligible and the influence matrix can be computed beforehand for those average flight conditions and nominal health-parameter values. This approach is further considered in the application presented. It has to be noted that if this situation dramatically improves the computational load, it is also preferable for stability purposes. Indeed, the operating conditions uk are also sensed and are hence noisy. The assessment of the matrix Gk based on data corrupted by random errors can lead to results worse than with average flight conditions.
From Kalman Filtering to Adaptive Estimation Because of its simplicity and moderate computational burden, the Kalman filter has been largely used for turbine engine performance ^ 0 can be chosen as the nominal monitoring. The initial values w values and the initial covariance Pw;0 can be chosen to be strictly diagonal with large terms, thereby allowing the parameters to vary in their whole range. On the other hand, the determination of the matrix Rw;k is more difficult and requires some experience. In normal operation, the health parameters are varying slowly and Algorithm 1 can be run effectively with a constant matrix Rw;k � Rmin w . It is interesting to point out that a physical meaning can be attached to the diagonal terms of Rmin w , which can help the selection of relevant values. Indeed, if �wk designates the maximum deviation of the parameters per time step for progressive 2 deterioration, the diagonal terms of Rmin w can be set to ��wk =3� . However, optimizing the performance tracking of gradual degradations also strongly deteriorates the behavior of the algorithm when accidental events occur (e.g., a foreign object ingestion). Indeed, the covariance matrix of the parameters Pw;k becomes small, which in turn makes the Kalman gain small, so that the most recent measurements contribute to a small extent in the estimation. The abrupt faults involve large deviations on a small subset of the health parameters in a very short period of time (typically less than 1 s), which translates into fast variations in the measurements. Consequently, the Kalman filter provides a sluggish response and spreads the fault over all of the health parameters. This effect is sometimes referred to as the smearing effect in the literature [2] and results in a poor diagnosis report. To improve the tracking abilities of short-time-scale events without sacrificing the reliability of the estimation of long-time-scale phenomena, adaptive estimation is considered. The adaptive algorithm is able to automatically cope with both abrupt and continuous engine degradations. The methodology investigated in this contribution is inspired by the work of Jazwinski [9] and is intended to ensure consistency between the predicted residuals rk and their statistics. Basically, the transition model of the health parameters (5) is updated online by increasing the magnitude of the process noise Rw;k whenever a sudden fault occurs. As a result, the covariance matrix Pw;k and, subsequently, the Kalman gain increase, so that more weight is given to the new measurements. In short, the adaptive algorithm provides an online feedback from the residuals in terms of process noise levels. The mathematical description follows. The implementation of the adaptive feature relies on a buffer of M � 1 residuals, denoted as frk�M ; . . . ; rk g. The estimation is hence delayed by M time steps, which means that at time step k, the most ^ k�M will be ^ k�M�1 and that the new estimate w recent estimate is w based on the residuals from the buffer. The residuals in the buffer are defined with respect to the most recent estimate available.
M X i�l
!k�i � �k�l
l � 0; . . . ; M
^ k�M�1 E �wk�M�1 jyk�M�1 � � w
(6)
E��k � � 0 8 k
E�!k � � 0 8 k
so that E �rk�l jyk�M�1 � � 0 This conditional mathematical expectation indicates that the residuals are computed using the most recent health-parameter estimate. Similarly, it can be proved after some algebraic steps that E�rk�l rTk�m jyk�M�1 � � Gk�l Pw;k�M�1 GTk�m � Rr �m;l � �M � 1 � m�Gk�l Rw;k GTk�m
m�l
(7)
where �m;l is the delta-Kronecker symbol. Practically, the offdiagonal terms of the matrix rk�l rTk�m are extremely sensitive to the measurement noise. To make sure that the data are statistically representative, it is chosen to restrict the present method to the diagonal terms of the previous matrix equality. Therefore, ensuring consistency of the residuals with their statistics is done by determining Rw;k such that diag �rk�l rTk�m � � diag�E�rk�l rTk�m jyk�M�1 ��
(8)
where the operator diag��� designates the vector made of the diagonal values of a square matrix. The left-hand side of Eq. (8) is computed from the buffer of residuals, and the right-hand side is the expected theoretical value that does not depend on the data. In a previous publication by the authors (see [13]), the delay M is set to zero to avoid a delayed health-parameter estimation. In this way, the matrix Rw;k is determined such that the squared residuals r2k match the diagonal terms of the right-hand side of relation (8) when M � m � l � 0. However, such an approach neglects the fact that in turbine engine performance monitoring, the level of measurement noise is relatively high and Rr ≳ Gk Rw;k GTk . As a consequence, the estimation of Rw;k is mainly driven by the measurement noise, and the resulting adaptive procedure is way too sensitive to the random errors. In [13], this effect is overcome by means of a second Kalman filter that estimates the diagonal terms of Rw;k . Even if it effectively stabilizes the estimation procedure, the setup of the complete algorithm involves many parameters to be tuned, which does not fulfill the simplicity requirement stated in the Introduction section. In our quest to simplify the complete estimation procedure, and according to the approach devised in [9], it appeared that the best approach consists of averaging the residuals rk�l over the M � 1 samples of the buffer according to r� k �
M 1 X r M � 1 l�0 k�l
(9)
This averaging makes the mean r�k less sensitive to the measurement noise. Indeed, it can be shown that the mean r�k is a white and Gaussian random variable with the zero mean [E�r�k jyk�M�1 � � 0] and covariance matrix given by [after some algebraic steps using Eqs. (7) and (9)] � k;M Pw;k�M G � Tk;M � R �r � E �r�k r�Tk jyk�M�1 � � G
M X
� k;l Rw;k G � Tk;l G
l�0
(10) � k;l and the ny � ny matrix R � r are defined where the ny � nw matrix G as � k;l � G
^ k�M�1 � � Gk�l �wk�M�1 � w ^ k�M�1 � rk�l ≜ yk�l � G�uk ; w � Gk�l
By definition,
l 1 X G M � 1 i�0 k�i
and
�r � R
1 R M�1 r
(11)
Applying Eq. (10) to the covariance matching (8) leads to the following equality.
766
LÉONARD, BORGUET, AND DEWALLEF
� k;M Pw;k�M G � Tk;M � R � r � � Bk f k d k ≜ r�2k � diag�G
(12)
where, for sake of simplicity, the matrix Rw;k is reduced to a vector containing the diagonal values according to f k � diag�Rw;k �
and
Bk �
M X
� 2k;l G
(13)
l�0
Because in turbine engine diagnosis there are often more health parameters than available measurements, the matrix Bk is rectangular (ny < nw ) and the previous equation has no unique solution. Consequently, the previous equation is best solved in a maximum a posteriori framework, where the prior value of fk is simply set to fmin � diag�Rmin w � with a covariance matrix Pf . Therefore, an adaptive estimation procedure is obtained by setting the diagonal terms of the covariance matrix Rw;k to the vector ^fk , given by T �1 T ^f k � fmin � max 0; �P�1 f � Bk Bk � Bk dk
(14)
where the maximum a posteriori solution is limited to positive values because ^fk is a variance. The covariance matrix Pf can be built quite easily by setting its diagonal terms according to fmax =3, where fmax are the maximum allowed values for fk . Loosely speaking, fmax reflects the expected squared maximum amplitude of the abrupt events. The estimation algorithm in Fig. 1, relying on the generic Kalman filter, can be modified to achieve adaptive estimation. The resulting procedure is sketched in Fig. 2. Basically, the residuals are stored in a buffer of size M � 1 for which the purpose is to provide the residual rk�M and to compute the mean residual r�k . The latter is then used by the adaptive filter [namely, relation (14)] to determine a proper covariance matrix Rw;k . Finally, the updated covariance matrix Rw;k and the residual rk�M are used by the Kalman filter of Algorithm 1 to update the estimated health parameters. Even if the procedure is relatively straightforward, the data buffering, represented by a simple box in Fig. 2, needs to be commented. Indeed, because the estimation is delayed by M samples, the residuals rk�l provided by the buffer would be related to ^ �k�l�M for l � 0; . . . ; M and not to the the prior health parameters w ^ �k�l�M ), as required by both the most recent prior estimate (namely, w adaptive estimation and the Kalman filter. To correct this effect without reestimating the whole buffer at each time step, the residuals are updated by the following rule. ^ k�M � w ^ �k�M � r k�l � rk�l � Gk�l �w
8 l � 0; . . . ; M
(15)
Stabilization of the Adaptive Algorithm Because the square of a Gaussian random variable is no longer Gaussian, the residuals dk defined in Eq. (12) are not Gaussian. As a consequence, the assessment of fk through Eq. (14) may result in very
uk
engine to monitor
yk -
simulation model
(u k,wk-M-1)
wk-M-1
data buffer
unit delay
r-k
wk-M Kalman filter
Fig. 2
rk
rk-M Rw,k
adaptive estimation
Structure of the adaptive estimation algorithm.
noisy values for small-sized buffers (i.e., M ’ 10). This generates a spurious covariance rise that decreases the stability of the estimation with respect to the measurement noise. Of course, the estimated values ^fk can be filtered on L time steps, as advised in [9], but this solution does not completely correct the problem and induces a further delay in the response of the algorithm. A sound approach consists of testing whether or not a sudden event has occurred. If it has indeed occurred, the estimated ^fk are applied. If not, the covariance matrix Rmin w , which corresponds to normal degradation, is used. The test used here is the �2 (read chi squared) test (see [14]). It is based on the assumption that if no abrupt fault occurs, r�k is distributed as an ny -dimensional Gaussian random variable, with the zero mean and covariance matrix E�r�k r�Tk jyk�M�1 � given by relation (8) with Rw;k � Rmin w . Denote the latter covariance matrix as Pr�;k ; the Mahalanobis distance, defined by qk � r�Tk �Pr�;k ��1 r�k then follows a �2ny probability density function with ny degrees of freedom. The test compares the scalar qk with a threshold that is defined as the integral X� of the �2 distribution; if qk is equal to the quantile X� of the �2m distribution, defined by ZX � �2m �x� dx �� 0
then the probability of obtaining qk or a larger value in the null hypothesis (i.e., no abrupt component fault is present) is given by 1 � �. In the present application, X� is computed beforehand by setting 1 � � to a low value (e.g., 10�6 ). The use of the statistical test leads to setting the diagonal terms of the covariance matrix Rw;k according to relation (14) if qk � X� and setting the diagonal terms to Rmin w otherwise.
Application on a Turbofan Engine The application used as a test case is a high-bypass-ratio mixedflow turbofan. The engine performance model has been developed in the frame of the Onboard Identification, Diagnosis, and Control of Gas Turbine Engines (OBIDICOTE)§ project and is detailed in [15]. A schematic of the engine is sketched in Fig. 3, in which the location of the 11 health parameters and the station numbering are also indicated. SEi and SWiR are factors affecting, respectively, the efficiency and the flow capacity of each engine module, and A8IMP is the nozzle discharge area. The sensor suite selected for diagnosing the engine condition is representative of the instrumentation available onboard contemporary turbofan engines and is detailed in Table 1, in which the nominal accuracy of each sensor is also reported. Simulated data were generated for fixed cruise flight conditions (altitude � 10; 800 m, Mach � 0:8, and standard day). Gaussian noise, for which the magnitude is specified in Table 1, is added to the clean simulated measurements to make them representative of real data. The sequence is 5000 s long with a data acquisition rate of 2 Hz. To represent a slow degradation due to normal operation, a reference fault case is considered in which nearly all of the health parameters are varying simultaneously. This fault case, further referred to as the 9p case in the paper, consists of the following degradations occurring progressively in 5000 s: �1:5% on SW12R, �1:2% on SE12, �1% on SW2R, �1% on SE2, �2:3% on SW26R, �1:4% on SE26, �0:88% on SW41R, �1:6% on SE41, and �1:3% on SE49. To underline the benefits of the newly developed method, a set of 14 typical accidental component faults is also supplied. These fault cases, extracted from [16] and detailed in Table 2, are representative of some of the most likely component faults that can be expected on a current turbofan engine. The accidental-fault cases are individually added as a step change at time t � 2500 s to the progressive deterioration. § A Brite/Euram project concerned with onboard identification and control of turbofan engines.
767
LÉONARD, BORGUET, AND DEWALLEF
SW12R SE12
SW26R SE26
SW41R SE41
SW49R SE49
A8IMP
13
fan
12
SW2R SE2
inlet
Wfuel
lpc
1
2
tor bus com
hpc
26
3
hpt
41
nozzle
lpt
49
6
8
Fig. 3 Turbofan layout used as an application test case; lpc denotes the low-pressure compressor, hpc denotes the high-pressure compressor, hpt denotes the high-pressure turbine, and lpt denotes the low-pressure turbine.
Application Results A good indicator of the quality of performance tracking is the maximum root-mean-square (rms) estimation error (the average is taken over the whole flight sequence) expressed in percent of deviation from the nominal values. If only slowly drifting faults have to be tracked, Algorithm 1 can be used effectively with a constant covariance matrix Rw;k � Rmin w . Such a situation is depicted in Fig. 4. The actual values of the health parameters are drawn in plain lines, with the corresponding health-parameter name on the right axes. Figure 4 clearly shows that the identified values, plotted with the symbols, agree with their actual values. The maximum rms error erms remains below 0.15%, which hints at the good tracking ability of the Kalman filter for normal degradation. When an abrupt component fault occurs, the Kalman filter fails to track and isolate the fault. This is clearly illustrated by adding the Table 1
Fig. 4
Tracking of engine wear without adaptive filtering.
fault case a from Table 2 to the previous progressive deterioration. The results given by the basic diagnosis tool are sketched in Fig. 5. The plain lines representing the actual values of the health parameters exhibit an step variation of 4 health parameters: namely, the efficiency and the flow capacity of both the fan and the low-pressure compressor at t � 2500 s (i.e., SW12R, SE12, SW2R, and SE2). In this case, the Kalman filter is unable to follow the abrupt deviation of the 4 health parameters. As a result, the maximum rms estimation error rises above 0.4%, which is visualized in Fig. 5 by the spreading of the fault on several other components such as the high-pressure compressor (SW26R) and the nozzle (A8IMP). The present test case
Operating conditions uk and measurements yk available onboard of the turbofan layout considered in the present application.
Index
Name
Description
Accuracya
u�1� u�2� u�3� u�4� y�1� y�2� y�3� y�4� y�5� y�6� y�7�
T1 P1 Pamb WFE T13 P13 T3 P3 Nlp Nhp T6
Inlet total temperature Inlet total pressure ambient pressure Fuel mass flow rate After-fan total temperature After-fan total pressure High-pressure-compressor outlet total temperature High-pressure-compressor outlet total pressure Low-pressure spool speed High-pressure spool speed Low-pressure-turbine outlet total pressure
2K 100 Pa 100 Pa 2 g=s 2K 100 Pa 2K 5000 Pa 4 rpm 12 rpm 2K
a
Accuracies are 3 times the standard deviation.
Table 2 accidental-fault cases of a turbofan engine a b c c e f g h i j k l m n
�0:7% on SW2R �1% on SW12R �1% on SE12 �1% on SW26R �1% on SE26 �1% on SW26R �1% on SW41R �1% on SW41R �1% on SE41 �1% on SE49 �1% on SW49R �1% on SW49R �1% on SW49R �1% on A8IMP �1% on A8IMP
�0:4% on SE2 �0:5% on SE12
Fan and low-pressure compressor
�0:7% on SE26
High-pressure compressor High-pressure turbine
�1% on SE41 lpt �0:4% on SE49 �0:6% on SE49 Nozzle
768
LÉONARD, BORGUET, AND DEWALLEF
Table 3 Comparison of the results obtained with and without adaptive filtering; results are the maximum rms errors averaged on 10 successive runs Without adaptive filtering 9p 9p � a 9p � b 9p � c 9p � d 9p � e 9p � f 9p � g 9p � h 9p � i 9p � j 9p � k 9p � l 9p � m 9p � n
Fig. 5 Tracking of engine wear and fault a without adaptive filtering.
Fig. 6 Tracking of engine wear and fault a with adaptive filtering.
is a good illustration of the Kalman filter divergence in the presence of a rapid measurement drift. Even at the end of the sequence, the fault is still not isolated, which provides the user with a wrong diagnosis. To illustrate the advantage of using an adaptive estimation algorithm, the same fault case is processed again, now enabling the update of the process noise covariance matrix Rw;k depicted in Fig. 2 with a delay of 50 samples (i.e., M � 50). The results are presented in Fig. 6. The first thing to notice is that the use of an adaptive estimation algorithm does not deteriorate the accuracy when only slowly drifting faults are present. However, when an abrupt fault occurs, the diagonal terms of the covariance matrix Rw;k related to the fan and the low-pressure compressor are increased. Consequently, the Kalman filter puts more emphasis on more recent data and the health parameters can be quickly adapted. As a result, the identified values remain close to their actual ones and no smearing effect is observed. Accordingly, the maximum rms error computed for the present test case remains below 0.15% for the whole sequence. To have a wider view of the efficiency of the newly developed diagnosis tool, the set of 15 test cases is run with and without adaptive filtering. These results are summarized in Table 3 in terms of
0.17% 0.41% 0.27% 0.39% 0.16% 0.35% 0.21% 0.31% 0.25% 0.23% 0.52% 0.46% 0.44% 0.16% 0.34%
✓ —— —— —— ✓ —— ✓ —— ✓ ✓ —— —— —— ✓ ——
With adaptive filtering 0.18% 0.18% 0.17% 0.24% 0.17% 0.18% 0.16% 0.17% 0.16% 0.17% 0.57% 0.23% 0.23% 0.18% 0.18%
✓ ✓ ✓ ✓ ✓ ✓ ✓ ✓ ✓ ✓ —— ✓ ✓ ✓ ✓
maximum rms error. The values mentioned in the table are averaged over 10 independent runs to ensure their reliability. Because the standard deviations of the estimated health parameters (i.e., the square root of the diagonal terms of the covariance matrix Pw;k ) are approximately 0.1%, a test case for which the maximum rms error remains below 0.25% is considered as successful. For the sake of simplicity, this is denoted by a check mark in Table 3. The first line in Table 3 refers to the situation in which only the continuous fault is present. As can be expected, both algorithms give the same results. However, when an abrupt component fault is introduced at t � 2500 s, the results given by the adaptive filtering are far better than those obtained without adaptive filtering. Indeed, without adaptive filtering, only 5test cases (namely, cases d, f, h, i, and m) are solved satisfactorily, whereas with adaptive estimation, all of the test cases (but case j) are successful. The size of the data buffer M is a tuning parameter of the adaptive algorithm. Generally speaking, large values for M give a more accurate abrupt fault detection at the price of an increased delay in estimation, whereas lower delays give more real time, but less accurate, results. In practice, it has been observed in the course of this study that values of M ranging from 10 to 100 are sufficient to achieve a very accurate performance tracking. As a consequence, the gain in terms of convergence speed of the performance tracking is usually more important than the time delay induced by the data buffering.
Conclusions In the present study, an adaptive estimation algorithm was developed to achieve the performance monitoring of aircraft turbine engines for both progressive degradation and abrupt faults. The adaptive algorithm implements a covariance-matching scheme that performs an online tuning of the process noise variances on the basis of the residuals. An interesting feature of the present approach is that it does not require the setup of a predefined bank of accidental faults. The methodology could also be extended to handle system faults such as stuck bleed valves and mistuned variable stator vanes. The improvements of the new methodology with respect to a generic Kalman filter were illustrated on a typical turbofan application. The accurate estimation achieved by the adaptive algorithm allows an efficient performance monitoring and a better component fault isolation. The implementation of the adaptive algorithm is relatively straightforward and involves only basic matrix operations. The computational burden is hence limited, which qualifies the resulting algorithm for onboard usage.
Acknowledgments This work is funded by the Ministry of the Walloon Region of Belgium in the frame of its Program FIRST and is supported by Techspace Aero, SAFRAN Group.
LÉONARD, BORGUET, AND DEWALLEF
References [1] Volponi, A. J., “Foundation of Gas Path Analysis,” Pts. 1, 2, Gas Turbine Condition Monitoring and Fault Diagnosis, Von Kármán Institute Lecture Series, VKI LS 2003-01, Rhode-Saint-Genèse, Belgium, 2003. [2] Provost, M. J., “Kalman Filtering Applied to Gas Turbine Analysis,” Gas Turbine Condition Monitoring and Fault Diagnosis, Von Kármán Institute Lecture Series, VKI LS 2003-01, Rhode-Saint-Genèse, Belgium, 2003. [3] Volponi, A. J., “Extending Gas Path Analysis Coverage for Other Fault Conditions,” Gas Turbine Condition Monitoring and Fault Diagnosis, Von Kármán Institute Lecture Series, VKI LS 2003-01, Rhode-SaintGenèse, Belgium, 2003. [4] Mehra, R. K., “Approaches to Adaptive Filtering,” IEEE Transactions on Automatic Control, Vol. 17, No. 5, 1972, pp. 693–698. doi:10.1109/TAC.1972.1100100 [5] Willsky, A., and Jones, H., “A Generalized Likelihood Ratio Approach to State Estimation in Linear Systems Subject to Abrupt Changes,” 1974 IEEE Conference on Decision and Control, 1974, pp. 846–853. [6] Borguet, S., and Ĺeonard, O., “Use of the Generalised Likelihood Ratio Test for Adaptive Engine Health Monitoring,” Association of Mechanical Engineers, Paper GT2008-50117, 2008. [7] Mehra, R. K., “On the Identification of Variances and Adaptive Kalman Filtering,” IEEE Transactions on Automatic Control, Vol. 15, No. 2, 1970, pp. 175–184. doi:10.1109/TAC.1970.1099422 [8] Odelson, B., Rajamani, M., and Rawlings, J., “A New Autocovariance Least-Squares Method for Estimating Noise Covariances,” Automatica,
[9] [10] [11] [12] [13] [14] [15]
[16]
769
Vol. 42, No. 2, Feb. 2006, pp. 303–308. doi:10.1016/j.automatica.2005.09.006 Jazwinski, A. H., “Adaptive Filtering,” Automatica, Vol. 5, No. 4, July 1969, pp. 475–485. doi:10.1016/0005-1098(69)90109-5 Kalman, R. E., “A New Approach to Linear Filtering and Prediction Problems,” Journal of Basic Engineering, Series D, Vol. 82, No. 1, 1960, pp. 35–44. Dewallef, P., “Application of the Kalman Filter to Health Monitoring of Gas Turbine Engines: A Sequential Approach to Robust Diagnosis,” Ph.D. Thesis, Univ. of Liége, Liége, Belgium, 2005. Kamboukos, P. H., and Mathioudakis, K., “Comparison of Linear and Nonlinear Gas Turbine Performance Diagnostics,” Association of Mechanical Engineers, Paper GT2003-38518, 2003. Dewallef, P., Mathioudakis, K., and Ĺeonard, O., “Online Aircraft Engine Diagnostic Using a Soft-Constrained Kalman Filter,” Association of Mechanical Engineers, Paper GT2004-53539, 2004. Papoulis, A., Probability, Random Variables and Stochastic Processes, 3rd ed., McGraw–Hill, New York, 1998. Stamatis, A., Mathioudakis, K., Ruiz, J., and Curnock, B., “Real-Time Engine Model Implementation for Adaptive Control and Performance Monitoring of Large Civil Turbofans,” Association of Mechanical Engineers, Paper 2001-GT-0362, 2001. Curnock, B., “OBIDICOTE Project Work Package 4: Steady-State Test Cases,” Rolls-Royce, plc, TR DNS62433, Derby, England, U.K., 2000.
A. Prasad Associate Editor