Proceedings of the IASTED International Symposia Imaging and Signal Processing in Health Care and Technology (ISPHT 2012) May 14 - 16, 2012 Baltimore, USA
ADAPTIVE FILTERING FOR DETECTING MYOCARDIAL INFARCTION USING NONINVASIVE CONDUCTING POLYMER COMPOSITE SENSORS Berney Montavon(1)(a), Mehmet Ergezer(2), Paul Lozovyy(1), Arun Venkatesan(3), Daniel Simon(1) (1) Cleveland State University, 2121 Euclid Ave, Cleveland, Ohio 44115 (2) Arcon Corporation, 260 Bear Hill Road, Waltham, MA 02451 (3) Cleveland Medical Polymers Inc, 1030 West Smith Road, Medina, OH 44256 (a)
[email protected] Electrocardiography is the measurement of electrical activity across the heart. The depolarization of the heart reduces a small electrical charge that we measure using surface electrodes attached to the skin. The placement of the electrodes is a standard configuration that collects signals from 12 different angles to the heart. The recorded signals are visible in waveform through the use of an ECG amplifier. The basic components of the ECG waveform are the P wave, QRS segment, and T wave. We also refer to the gap between the S wave and the T wave as the ST-segment [3]. Doctors use the ECG to diagnose abnormal heart activity. Irregular ECG waveforms, such as an elevated ST-segment, could be an indicator of MI or other ailments [4]. MI is commonly referred to as a heart attack, and is caused by an interruption of blood flow through the heart. Our goal is that through non-invasive monitoring of ECG waves, we can accurately detect MI and other heart arrhythmias in workers of occupations where heart activity is strenuous. We discuss this further in Section 2.1. Although the human body is an overall good conductor of electricity, the outer layer of skin has high impedance that can limit the ability to measure ECG waves. Conventional methods call for the need to remove or penetrate this superficial layer of skin, and to use conductive gels when attaching the leads to the skin [5]. This improves strength of ECG signals, but it is a somewhat invasive process that is typically performed by a medical professional. In recent years however, more use has been made of advanced materials like CPSs with carbon nanotube (CNT) additives to measure ECG signals. The unique properties of the CPSs include the ability to measure the electrical impulses of the heart. We have developed an athletic shirt with embedded CPS sensors arranged in the standard 12 lead layout. We use the shirt to measure ECG signals without the need to prepare the skin in any way. We discuss the data collection further in Section 2. We find that the primary challenge in developing our monitoring system is the filtering of noise embedded within the ECG signal [6]. In Section 3, we first apply a NLMS algorithm, similar to those developed by Rahman [7] Mandic [8] and Valin [9], to a sine wave embedded with random noise as a testing benchmark. We then filter out electromyography (EMG) noise from a CPS recorded
ABSTRACT Continuous electrocardiographic (ECG) monitoring using conducting polymer composite sensors (CPS) presents a non-invasive way to detect cardiac irregularities such as myocardial infarction (MI). Electromyography (EMG), which measures muscle activity in the human body, has a frequency range that overlaps that of the ECG wave. As a result, both EMG and ECG data are present when CPSs collect ECG signals. When measuring ECG waves of an individual during motion, we account for EMG by removing the motion artifact from the ECG signal. With the use of a normalized least mean square (NLMS) algorithm and known signal characteristics, we show that EMG noise can be successfully filtered from an ECG signal that is collected using our CPSs in the standard 12 lead ECG placement. Our software produces a diagnostic-friendly ECG signal and then determines the patient’s heart rate. When applied to the arrhythmia database from the Massachusetts Institute of Technology and Beth Israel Hospital (MIT-BIH), our heartbeat detection logic has an accuracy of 99.6% with only 199 false beats and 240 missed beats out of 109,494 total heartbeats taken from 48 individual recordings. KEY WORDS Signal processing of physiological signals, wearable devices, biomedical signal processing, medical signal processing.
1. Introduction Myocardial infarction (MI), which is a disruption of blood flow to the heart, is the leading cause of death among firefighters in the United States [1]. The need to carry heavy equipment long distances is a type of anaerobic exercise capable of pushing heart-rate to 80-90% maximum capacity [2]. As first responders providing an essential service to society, it is important to develop tools to allow firefighters to do their job and to keep them safe. Our primary focus in this research is to develop a noninvasive electrocardiographic (ECG) monitoring system that can be used to automatically detect potential cardiac emergencies in firefighters on the job.
DOI: 10.2316/P.2012.771-023
143
ECG signal. EMG is the measurement of electrical impulses across muscle cells and EMG waves can be visible in many ECG signals due to the fact that they have overlapping frequency ranges [10]. As a result, we are careful when removing the EMG noise so that we do not eliminate vital components of the ECG signal [11]. Thakor and Zhu introduce an EMG algorithm that we have added to our filter bank which reduces the EMG noise [12]. The normalized least mean square (NLMS) minimizes the difference between the desired ECG signal, which is an ECG with little or no EMG noise, and the actual ECG signal recorded with the CPS sensors, which has embedded EMG signals. In Section 4, we take the first step in detecting any arrhythmia by establishing a baseline heartbeat. Pan and Tompkins accomplished this by isolating the QRS sequence in the ECG waveform, and then applying peak detection logic [13]. The QRS sequence is also useful in measuring R-R intervals and ST-segment length, both of which will be used to automatically detect MI. We then apply an original peak detection logic which counts the number of heartbeats in a given signal. The algorithm is tested through the use of the PhysioNet online library [14], which houses a collection of various ECG arrhythmia databases and provides a good testing platform for our code.
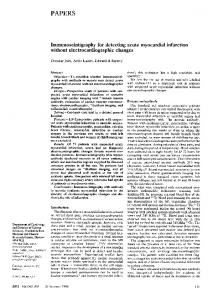
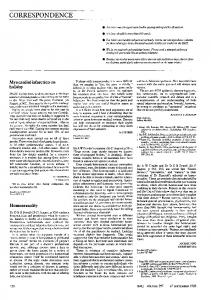
The amplifier collects data at a sampling rate that can be configured to either 250 or 500 samples per second. We configure it to collect data at 250 Hz. After we collect data, we employ MATLAB® for all signal processing and filter application. CPS properties can vary immensely depending on the alignment. With the proper formulation and processing, we are able to produce CNT based sensors that can detect and measure the voltage differential across the surface of the heart. We have effectively incorporated CNT’s and other additives into a polymer matrix to make a proprietary material. These conducting polymer composites are then processed in bulk quantities to manufacture the sensors, and are robust enough to be attached to fabric or other support materials to make usertransparent sensor assemblies. The CPS’s are dry contact sensors that require no conductive gel or skin preparation for ECG capture. The CPS embedded athletic shirt is one such assembly to enable real-life biotelemetry. Figure 1 - CPS embedded athletic shirt along with the Texas Instruments Incorporated ADS1298™ ECG amplifier.
2. Detecting Myocardial Infarction The estimated parameters of the ECG allow us to detect MI [15]. For instance, a Q-wave that is more than 1/4 the size of the S-wave could be an indication of a possible MI [5]. It may be difficult to measure the difference between the two waves for a person in motion because of motion artifact, but the estimated difference can still be included in our detection algorithm as supplementary logic. A more realistic approach is the one mentioned in the introduction, ST elevation. The American Heart Association defines ST elevation as being “0.1 mV in at least two contiguous precordial or adjacent limb leads” [16]. We also know that the ST segment should be approximately 80-120 ms in duration. Using this fact, our detection algorithm will monitor ST lengths and flag potential abnormalities. Arrhythmias other than MI, such as tachycardia and bradycardia will also be monitored using the heartbeat detection software described in Section 4.
Our athletic shirt consists of 10 CPS electrodes. Four of them are placed on the left arm (LA), right arm (RA), left leg (LL), and the right leg (RL). The shirt also contains the 6 precordial electrodes (V1 to V6) that are placed on the chest and left side of the torso [5]. The RL electrode is used as a reference point. At this point, it is important to distinguish the difference between a lead and an electrode. The electrodes are the actual CPS sensors attached to our shirt. The leads represent ECG recordings taken from different angles to the heart. The standard 12 lead configuration (6 precordial, 3 limb, and 3 augmented) gets its name from the total number of different ECG recordings that are available with these 10 electrodes. We start with the calculation of the three limb leads: lead I, lead II, and lead III [10]. The limb leads are calculated using the following equations:
2.1 Data Collection We collect data using our CPS embedded athletic shirt and a Texas Instruments Incorporated ADS1298™ ECG amplifier (Figure 1). Our current development configuration is for prototyping, and requires a hard-wired connection to the shirt. Further research will use a wireless data transmission setup which will be necessary for most practical applications.
(1) (2) (3)
144
Next, we calculate the three augmented leads. The augmented leads are derived using the same electrodes used to calculate leads I, II, and III. We find the precordial leads do not require augmentation due to their close proximity to the heart [10].
In our research, accelerometer data or estimated EMG measurements using augmented leads act as our reference inputs, as discussed further in the subsequent sections. The error coefficients are important, because correctly estimating their values means we can find the noise infecting our ECG. We use Eq. 8 below to adaptively update the estimate of the error coefficients, w(k). Note that with some abuse of notation we have used w(k) to indicate both the true coefficients in Eq. 7 and the estimated coefficients in Eq. 8. The adaptive step size, u(k), is calculated in Eq. 9 and μ is an input variable that we vary from 0.1 to 0.001. We find that a larger step size decreases the convergence time it takes the algorithm to find the correct coefficients, but at the cost of overall accuracy. =w + u(k) (8)
(4) (5) (6) The output data of the ADS1298 are the precordial leads as well as leads I and II, giving us only 8 of the 12 leads, but our code computes the missing limb lead III and the 3 augmented leads using the LA, RA and LL electrodes and Eq. 3-6..
=
3. Elimination of Motion Artifact
(9)
The estimated ECG, s(k), can now be calculated using Eq. 10 below. We simply subtract the estimated noise, n(k), from the CPS recorded ECG signal, d(k).
The removal of non-ECG data from our recorded signal is the primary obstacle in our research. Body motion will corrupt our ECG signal with noise [17], but so will respiration and muscle flexing even while sitting still [18]. Our approach is to create a bank of filters that will address each type of noise we encounter [19]. Since baseline wander is common even in conventional ECG data collection, this is where we begin the filtering process.
=d
n(k)
(10)
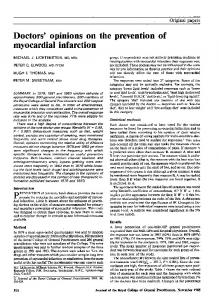
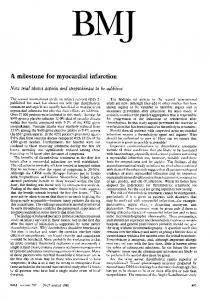
We test our algorithm by applying uniformly distributed noise to a sine wave. In this test, we use a step size of 0.01 and we use a signal-to-noise ratio of 0.5. The results of the test are in Figure 2. The first plot in the figure shows the learning rate of NLMS as the algorithm learns the error coefficients of the noise that we are adding to the sine wave. The second plot, which simulates a noisy ECG signal, is the noisy sine wave. The final plot is the NLMS filtered signal. The error coefficients begin to level out at approximately 3.5 seconds indicating that they have converged to the correct values. It is clear that by the 10 second mark, the filter is correctly estimating most of the randomly generated noise and recovering the clean sine wave.
3.1 Band Pass Filtering Baseline wander is a common ECG effect which is often caused by respiration [10]. As our research focuses on data collection from active individuals, it is a type of noise that is present in almost every signal we encounter. We apply a band pass filter to focus on the frequency spectra of ECG signals. The standard range for adults is 0.67 to 150 Hz [10]. By eliminating the frequencies outside this range through the use of a 4th order bandpass Butterworth filter, we are able to successfully reduce the impact of baseline wander.
Figure 2 - Results of filtering a noisy sine wave using the NLMS algorithm. The top figure shows the convergence of one of the NLMS weight coefficients. The middle figure is the noisy sine wave as input to the filter, and the bottom figure is the filtered sine wave. 3
3.2 Normalized Least Mean Square Algorithm
2
The intent of the NLMS algorithm is to limit the mean square error of the input signal. That is, it seeks to minimize the difference between the noisy signal and the real but unknown ECG signal. We do this by finding the minimized value of the square of the estimated ECG signal, s(k). We begin with Eq. 7 below and see that the noisy signal embedded in the ECG, is equal to the product of the reference inputs, a(k), and the error coefficients, w(k). The T superscript indicates that we are taking the transpose.
Magnitude (voltage)
1 0 0
1
2
3
4
5
6
7
8
9
10
1
2
3
4
5
6
7
8
9
10
1
2
3
4
5 6 Time (seconds)
7
8
9
10
5 0 -5 0 5 0 -5 0
(7)
145
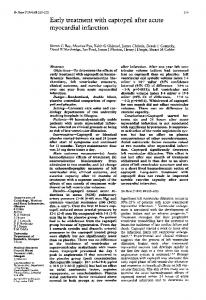
Figure 5 - Results of EMG cancellation with lead aVF as the input into the NLMS filter.
3.3 EMG Cancellation using Augmented Leads Seeing that our electrodes are placed at very specific locations, we can gather EMG data using leads that are orthogonal to guarantee uncorrelated inputs to the NLMS filter [12]. We also know that the difference between leads aVR and aVL is orthogonal to lead aVF. We then use Eqs. 4, 5, and 6 to calculate the augmented leads and input them into the NLMS filter. Lead aVF is the input signal and (aVR – aVL) is used as the reference input. We conduct a test where the subject is wearing the CPS sensor shirt while ECG data is being collected. Figures 3-5 shows the results of this test. The subject flexes both arms and chest to produce EMG noise at the 30-35 second mark and this interruption is clearly visible in the raw data collected from leads I and II in Fig. 3. Fig. 4 plots the input signal (aVF) and the reference signal (aVR aVL). Finally, Fig. 5 shows the results of the NLMS filtered signals with noticeable improvement compared to the noisy ECG signals input into the algorithm. For this test, our step size was 0.1.
Voltage (mV)
-1 0
Voltage (mV)
40
50
60
40
50
60
Lead II 0.012 0.011 0.01 0.009 0
10
20
30 Time (s)
20
30 Time (s)
40
50
60
Another approach that we apply is the use of accelerometers to capture body motion that corrupts the ECG signals we record. By measuring body acceleration from arm movement during light exercise, we attempt to remove the motion artifact from our ECG signal by inputting the accelerometer data into our NLMS filter as the reference signal. The accelerometer was mounted on the upper back for convenience. Tests were also performed with the accelerometer mounted on the lower back, but the location of the accelerometer did not make any significant difference. At first, we selected a 3-axis analog accelerometer with a range of . While running tests with this device, we ran into a problem of not having enough resolution as the measured acceleration signal lacked precision at lower accelerations. We then switched to a 3-axis accelerometer that performed well for tests involving casual walking. If we experiment with jumping or running up and down stairwells (which are tasks commonly asked of firefighters), the accelerometer might saturate at its 1.5g limits. Accelerometer data was recorded at 100 samples per second, so it had to be interpolated to match the ECG data sampling rate of 250 samples per second.
0.06
30
10
3.4 Using Accelerometers to Reduce Motion Artifact
Lead I
20
0
-0.5
0.065
10
x 10
0.5
Figure 3 – ECG signals as collected with the CPS embedded shirt. Note the baseline wandering after the 30 second mark due to a muscle flex.
0.055 0
NLMS Filtered Signal
-3
1
Figure 4 – Calculated augmented leads that are input into the NLMS filter.
4. Heartbeat Detection
Input Lead - aVF -0.02
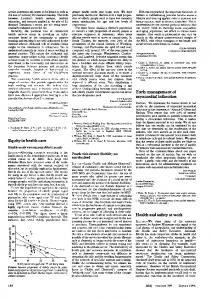
Using the procedure outlined by Pan and Tompkins, we begin the process of detecting the heartbeats by isolating the QRS sequence [13]. By counting the number of QRS sequences in a signal, we can determine the number of heartbeats. A normal QRS sequence has a frequency range of 0 to 40 Hz, but in our testing, accuracy increases with a bandpass filter with a range of 5 to 90 Hz. After filtering, we differentiate our signal. The differentiating of the ECG signal increases the magnitude of the QRS sequence. We then square every data point in the signal which eliminates all the negative portions of the waveform. The final step in QRS isolation is performing moving-window integration. Our window size is 150 ms and moves down the entire length of the signal combining the areas under the curve and results in a waveform where we can now detect local maximum values to look for
Voltage (mV)
-0.022 -0.024 0
10
20
30
40
50
60
40
50
60
Reference Lead (aVR-aVL) -0.08 -0.09 -0.1 0
10
20
30 Time (s)
146
heartbeats. The plots in Figure 6 show each phase of the process.
We download the entire record of each patient (approximately 30 minutes of data exists in each record) and run the signals through our heartbeat detection algorithm. The MIT-BIH has a total of 109,494 heartbeats with records that include normal healthy beats and abnormal beats interwoven throughout each record. Our algorithm detected 109,254 of the heartbeats present and falsely detected 199 heartbeats, 170 of which were detected from one record that shows extended periods of ventricular flutter in which no normal beats are actually counted. Our results for this process are detailed in Table 1. We note that 41 of the 48 records had a variation of less than 10 heartbeats, and only 2 of the records had a variance that exceeded 23 heartbeats (records 203 and 207). Annotations in the MIT-BIH database note that record 203 has significant muscle artifact and baseline shifts which makes it a difficult record for humans to read properly. There are also extended periods of ventricular flutter in record 207, which are not considered heartbeats by cardiologists, which causes the high number of false heartbeats.
Figure 6 – The original ECG wave is differentiated, squared and integrated when isolating the QRS sequence. 1200
Unfiltered ECG
1000
Voltage (mV)
0
0.5
1
1.5
2
2.5
3
3.5
4
20 0 -20 0 1000
4.5
5
Derivative
0.5
1
1.5
2
2.5
3
3.5
4
4.5
5
Square
500 0 0
0.5
1
1.5
2
2.5
3
3.5
4
200
4.5
5
Integration
100 0 0
0.5
1
1.5
2
2.5
3
3.5
4
4.5
5
Time (s)
4.1 Peak Detection and Decision Logic
5. Conclusion
Our implemented algorithm for peak detection is a variation of Pan and Tompkins [13] and starts by searching the waveform for slope changes. Any point where the slope changes sign, that location is collected as a possible peak. Many of the false peaks are eliminated immediately by setting a minimum threshold which we set equal to 60% of the mean value of our integrated waveform. Due to the limits of our ADS1298 interface with MATLAB, our initial code is developed to operate with prerecorded signals and will need to be modified when we implement real time applications. With elimination of motion artifacts being our primary focus, our non-real-time method meets our needs in these early stages of our research. We then define a gap equal to 0.3 seconds because we know that it is not physiologically possible for a heart to beat more than once in such a short time period [10]. As a result, more false peaks are eliminated if they appear within 0.3 seconds of the prior or subsequent detection.
The goal of this research is to detect MI in firefighters using a non-intrusive method. To achieve this, a CPSembedded athletic shirt is employed to collect ECG data. The collected noisy ECG signal is filtered using an NLMS algorithm, and then a novel heartbeat detection algorithm is introduced to search for irregular heartbeats. Our research shows that noises such as EMG and motion artifact can be successfully filtered from an ECG signal. The NLMS filter is first tested with a sine wave that has five to one signal to noise ratio and is found to perform well after ten seconds. Once the filter’s performance is shown on the sine wave, the NLMS filter was tested on noisy data ECG data collected from a patient. The tests show that the filter successfully removes baseline wander and EMG noise. We use the augmented leads of aVF, aVL, and aVR as inputs to the NLMS filter which results in an ECG waveform that can then be input to our heartbeat detection algorithm for future arrhythmia detection algorithms. The heartbeat detection algorithm proved to be very accurate by correctly detecting 99.6% of the heartbeats in the MIT-BIH database. We see a deviation of less than nine beats in 41 out of 48 records. This shows that we can accurately detect heart rate with a very small percentage of errors in subjects with both normal and abnormal heart rhythms. While we’ve had some success at eliminating the EMG noise embedded in ECG signals, future work is needed in removing motion artifact through the use of multiple accelerometers. By placing accelerometers on both arms in addition to the back, we can better detect the noise present in an ECG that results from arm movement. We found that the shirt assembly with its dry gel-free CPS’s was very convenient for repetitive ECG testing,
4.2 Heartbeat Detection Results PhysioNet is commonly used by biomedical researchers. The website has a large library of physiological signals published under the GNU General Public License (GPL). One of the databases on PhysioNet is the MIT-BIH. This database includes the ECG records of 48 patients which were annotated by cardiologists to identify both the number of heartbeats and the types of arrhythmias present in the signals [14]. These databases are widely used as benchmarks when performing tests on any sort of automated heartbeat counter or arrhythmia detection algorithm [20].
147
Table 1 – Results from the 48 patients in the MIT-BIH database show an overall success rate of 99.60% with only 240 missed beats and 199 false beats.
with no skin irritation problems. While it provided an expedient way to run tests, we also must address the issue of electrode motion artifact which results from the CPS electrodes not being attached to the body. More work is also required in applying an adaptive threshold in our beat detection algorithm. The algorithm works very well in either high noise or low noise environments, but when noise in the ECG is not consistent throughout the signal, the accuracy lessens and we see greater error.
Record Number 100 101 102 103 104 105 106 107 108 109 111 112 113 114 115 116 117 118 119 121 122 123 124 200 201 202 203 205 207 208 209 210 212 213 214 215 217 219 220 221 222 223 228 230 231 232 233 234 Totals
Acknowledgments The work for this project was funded by the Cleveland State University Provost’s Office and by the National Science Foundation under Grant No. 0826124 and was completed in the Embedded Control Systems Research Lab at Cleveland State University located in Cleveland, Ohio. Work was also done in partnership with the Cleveland Clinic and Dr. Mirela Ovreiu.
148
Actual Heartbeats 2273 1865 2187 2084 2229 2572 2027 2137 1763 2532 2124 2539 1795 1879 1953 2412 1535 2278 1987 1863 2476 1518 1619 2601 1963 2136 2980 2656 1860 2955 3005 2650 2748 3251 2262 3363 2208 2154 2048 2427 2483 2605 2053 2256 1571 1780 3079 2753 109494
Detected Heartbeats 2272 1866 2187 2083 2235 2575 2018 2136 1765 2529 2126 2540 1793 1882 1952 2389 1536 2279 1988 1863 2476 1517 1619 2602 1956 2132 2888 2642 2030 2934 3003 2633 2748 3245 2259 3359 2207 2154 2047 2425 2469 2602 2057 2256 1570 1783 3074 2752 109453
False Beats 0 1 0 0 6 3 0 0 2 0 2 1 0 3 0 0 1 1 1 0 0 0 0 1 0 0 0 0 170 0 0 0 0 0 0 0 0 0 0 0 0 0 4 0 0 3 0 0 199
Missed Beats 1 0 0 1 0 0 9 1 0 3 0 0 2 0 1 23 0 0 0 0 0 1 0 0 7 4 92 14 0 21 2 17 0 6 3 4 1 0 1 2 14 3 0 0 1 0 5 1 240
[13] J. Pan & W. Tompkins, A real-time QRS detection algorithm, IEEE Trans. Biomedical Eng, BME-32(3), 1985, 230-236.
References [1] R. Fahy, U.S. firefighter fatalities due to sudden cardiac death, 1995-2004, (Quincy, MA: National Fire Protection Association, 2005).
[14] A. Goldberger, L. Amaral,L. Glass, J. Hausdorff, P. Ivanov, R. Mark, J. Mietus, G. Moody, C. Peng, H. Stanley, PhysioBank, PhysioToolkit, & PhysioNet: Components of a New Research Resource for Complex Physiologic Signals, Circulation, 101, http://circ.ahajournals.org/cgi/content/full/101/23/e215, 2000.
[2] M. Sothmann, K. Saupe, D. Jasenof, & J. Blaney, Heart rate response of firefighters to actual emergencies; implications for cardiorespiratory fitness, Journal of Occupational Medicine, 34(8), 1992, 797-800. [3] Y. Jeong, Introduction to Bioelectricity - Ch.2, Integrated Circuits and Systems, (New York, New York: Springer Science, 2011).
[15] F. Jager, G. Moody, & R. Mark, Detection of transient ST segment episodes during ambulatory ECG monitoring, Computers and Biomedical Research, 31(5), 1998, 305-322.
[4] Y. Birnbaum & S. Sclarovsky, The initial electrocardiographic pattern in acute myocardial infarction: correlation with the underlying coronary anatomy and prognosis, Annals of Noninvasive Electrocardiology, 2(3), 1997, 279-291.
[16] D. Campbell-Scherer & L. Green, ACC/AHA guideline update for the management of ST-segment elevation myocardial infarction, American Family Physician, 79(1), 2009, 1080-1086.
[5] T. Garcia & N. Holtz, Introduction to 12-lead ECG : the art of interpretation, (Burlington, MA: Sudbury, Jones and Bartlett, 2003).
[17] T. Pawar, N. Anantakrishnan, S. Chaudhuri, & S. Duttagupta, Impact of ambulation in wearable-ECG, Annals of Biomedical Engineering, 36(9), 2008, 15471557.
[6] H. Gholam-Hosseini, H. Nazeran, & K. Reynolds, ECG noise cancellation using digital filters, Proceedings of the 2nd International Conference on Bioelectromagnetism, Melbourne, Australia, 1998, 151-152.
[18] M. Evanich, M. Lopata, & R. Lourenco, Analytical methods for the study of electrical activity in respiratory nerves and muscles, Chest, 70(1), 1976, 158-162.
[7] M. Rahman, R. Shaik, & D. Reddy, Adaptive noise removal in the ECG using the block LMS algorithm, Proceedings of the 2nd International Conference on Adaptive Science and Technology, New York, NY, 2009, 380-383.
[19] V. Afonso, W. Tompkins, T. Nguyen, & S. Luo, ECG beat detection using filter banks, IEEE Trans. Biomedical Eng, 46(2), 1999, 192-202. [20] P. Hamilton & W. Tompkins, Quantitative investigation of QRS detection rules using the MIT/BIH Arrhythmia Database, IEEE Trans. Biomedical Eng, BME-33(12), 1986, 1157-1165.
[8] D. Mandic, A generalized normalized gradient descent algorithm, IEEE Signal Processing Letters, 11(2), 2004, 115-118. [9] J. Valin & I. Collings, Interference-normalized least mean square algorithm, IEEE Signal Proc. Letters, 14(12), 2007, 988-991. [10] L. Sornmo & P. Laguna, Bioelectrical Signal Processing in Cardiac and Neurological Applications, (Waltham, MA: Academic Press, 2005). [11] S. Luo & P. Johnston, A review of electrocardiogram filtering, Journal of Electrocardiology, 43(6), 2010, 486-496. [12] N. Thakor & Y. Zhu, Applications of adaptive filtering to ECG analysis: noise cancellation and arrhythmia detection, IEEE Trans. Biomedical Eng, 38(8), 1991, 785-793.
149