estimation of subjective video quality as feedback to the. Content Provider (CP) [1]. ... How to control a content delivery network using an overlay network and a ...
International Journal on Advances in Systems and Measurements, vol 4 no 1 & 2, year 2011, http://www.iariajournals.org/systems_and_measurements/
Adaptive Video Streaming through Estimation of Subjective Video Quality
109
Wolfgang Leister, Svetlana Boudko, and Till Halbach Røssvoll Norsk Regnesentral Oslo, Norway Email: {wolfgang.leister, svetlana.boudko, till.halbach.rossvoll}@nr.no
Abstract—Concerning video transmission on the Internet, we present a model for estimating the subjective quality from objective measurements at the transmission receivers and on the network. The model reflects the quality degradation subject to parameters like packet loss ratio and bit rate, and is calibrated using the prerecorded results from subjective quality assessments. Besides the model and the calibration, the main achievement of this paper is the model’s validation by implementation in a monitoring tool. It can be used by content and network providers to swiftly localise the causes of a poor quality of experience (QoE). It also can help content providers make decisions regarding the adjustment of vital parameters, such as encoding bit rate and error correction mechanisms. We show how the estimated subjective service quality can be applied for decision making in content delivery networks that consist of overlay networks and multi-access networks. Keywords—Quality of Experience; perceived quality; video streaming; assessment; adaptation
I. I NTRODUCTION Streaming of video content to a broad public is a wellknown technology and increasingly used both in stationary and mobile applications. The technical quality of such streams is essential for the viewers. Previously, we presented the estimation of subjective video quality as feedback to the Content Provider (CP) [1]. We extend the metrics used there to control an overlay network for video streaming including a mobile scenario. In a stationary scenario, content from the CP is sent through the networks of an Internet Service Provider (ISP) to the consumer’s home network and can then be viewed on, for instance, a TV screen. While this provides an effective way of distributing streamed content, the CP may not be able to serve all consumers due to capacity limitations of the network. Therefore, CPs position streaming servers at particular nodes with preferred ISPs from which the content is conveyed to the consumers. CPs may experience that consumers complain about a reduced image quality even though the culprits are problems at the ISP’s or the consumer’s location. This includes systems and home network on the consumer side. Also bandwidth sharing with other devices and the use of wireless networking devices are known to be problematic. In the MOVIS project [2], which forms the motivation of this paper, a monitoring system that collects objective data from several sources and
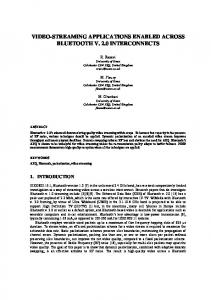
estimates the assumed consumers’ satisfaction has been implemented. The tool integrates the data and provides an analysis to the customer service regarding the possible causes of a problem. The metrics for the assumed customer satisfaction are not limited to measurements and alerts, but can also be used to control the content delivery network. For the metrics for measurements and alerts, we analyse the delivery chain for video on demand and identify a number of factors that influence the quality as experienced by the consumer using the scenario sketched in Figure 1. Multimedia content is streamed from the CPs, routed through the network of ISPs, and is finally accessed by consumers, typically in private homes with broadband access. The perceived quality of experience (QoE) for the consumer can be affected at all stages in the delivery process. For the consumer, the overall quality of the video stream is most important in a pay-perservice model. In the following sections, we show how to estimate the QoE for single consumers and groups of consumers given the above scenario. In Section II, we give an overview of models and metrics for measuring the quality of service (QoS) and estimating the QoE for streamed content. In Section III, we propose a novel model for estimating the QoE, and we show results from an assessment process for video content in Section IV. How to control a content delivery network using an overlay network and a multi-access network is shown in Section V. We conclude in Section VI, showing how our model is used in practice. II. E STIMATION M ODELS AND M ETRICS The user-perceived quality of a service is affected by numerous factors in the end-to-end delivery path. For measuring the QoS, there are several approaches that can be classified by whether they are subjective or objective, direct or indirect, in-service or out-of-service, real-time or deferred time, continuous or sampled, intrusive or non-intrusive, and single-ended or double-ended [3]. Existing methods for QoS measurement can be classified into network and application level measurements. Examples of widely used metrics for network-level QoS include connectivity (RFC 2678); one and two-way delay (e.g., RFC 2679, RFC 2680, RFC 2681); one-way delay variation (jitter; see the IP Performance working group IPPM); throughput; and packet
2011, © Copyright by authors, Published under agreement with IARIA - www.iaria.org
International Journal on Advances in Systems and Measurements, vol 4 no 1 & 2, year 2011, http://www.iariajournals.org/systems_and_measurements/
110
Figure 1.
Transmission chain. Entities which have an influence on the consumer’s experience of quality are identified.
loss, as described in the framework for IP-based metrics in RFC 2330 [4], and WOAMP (active measurement protocols. Observations of QoS on all levels can be made by nonintrusive measurement (passive observation of QoS at the end system), or intrusive measurement (the controlled injection of content into the stream in order to make deductions of the quality). These measurements are performed according to a QoS metric that quantifies the performance and reliability of the Internet [4]–[6]. For measuring the QoS, there are several approaches that can be classified based on whether they are subjective or objective, direct or indirect, in-service or out-of-service, realtime or deferred time, continuous or sampled, intrusive or nonintrusive, and single-ended or double-ended. Existing work that claims to derive QoE values directly from network QoS frequently applies peak-signal-to-noise ratio (PSNR) as its metric for translating QoS to QoE. There are very strong arguments against this practice, for example [7], [8]. The picture appraisal rating for MPEG-2 (PAR) [9] assesses the quality of indivual pictures instead of videos as well and suffers the same problems as PSNR. A very simple approximation in this general family of approaches was proposed [10]. Rate-distortion models as introduced [11] are also based on PSNR, which constitutes a problem, but are less affected by unstable quality because quality is adapted by changing quantization factors over time. The just noticable differences (JND) provides an objective metric that tries to emulate the human visual apparatus in a way that considers the change of pictures over time, as do approaches like the Video Quality Metric (VQM) [12]. The VQM uses a double-ended approach that can be adapted for continuous in-service quality monitoring when using an additional ancillary data channel. VQM is based on the extraction of perception-based features and the computation of particular quality parameters. Koumaras et al. [10] presented a theoretical framework for end-to-end video quality prediction. This framework is
independent of the video codec, and the dynamics of the encoded sequence. It consists of two models. The first model operates at the pre-encoding stage and predicts the video quality of the encoded signal. Here, the authors showed that the dependency between the bit rate and the perceived quality of service is described by a logarithmic function hPQoSiSSIM = 0.1033 ln(x) + 0.2940. Their second model maps the packet loss rate to the video quality degradation, whereby the quality of the transmitted video is linearly dependent on the percentage of the successfully decoded frames. We realize that the estimation of perceived video quality is an open research field. Video quality experts agree that existing quality estimation methods must be used carefully [13]. User perceived quality metrics typically take the characteristics of the transported content and network level QoS into account. Traditionally, the QoE has been assessed by means of user evaluations. We found also tools that estimate the QoE from objective measurements at the application level. Subjective quality measurement involves a test panel with individuals, while the objective measurements are performed on the media content [14], [15]. In voice communications and image processing, the mean opinion score (MOS) provides a numerical measure for the QoE using subjective tests (opinionated scores) that are statistically averaged to obtain a quantitative indicator of the system performance. Pre-recorded samples are played back to a mixed group of people under controlled conditions, using the rating: (1) bad; (2) poor; (3) fair; (4) good; (5) excellent. The MOS is the arithmetic mean of all the individual scores. Standards for performing user assessment studies to determine QoE for TV and multimedia can be found in DSCQS / BT.500-11 [16] and SAMVIQ / BT.700 [17]–[19]. Applicable standards for subjective video quality assessment by the EBU include ETR 290, TR 101 290 (Measurement guidelines for DVB systems), and TR 101291. SAMVIQ builds on the experiences of the ITU standard BT.500-11 for video, on experiences from the audio assessment methodology MUSHRA, and
2011, © Copyright by authors, Published under agreement with IARIA - www.iaria.org
International Journal on Advances in Systems and Measurements, vol 4 no 1 & 2, year 2011, http://www.iariajournals.org/systems_and_measurements/
on the ITU-T recommendation P.911 (Subjective Audiovisual Quality Assessment Methods for Multimedia Applications). Examples of methodologies defining the criteria of objective and subjective quality for video compression include the work of Bennett and Bock [20], where a signal noise analysis to compare compatible MPEG and WM9 codecs is presented. As video streaming involves more than solely video compression and is subject to the quality of network protocols, physical lines, software media players, computer hardware and other components, the impact of these components has been studied. Video streaming technologies with user tests to evaluate the perceived quality have been analysed [21], also taking the effects of quality adaptation methods such as H.264 SVC or frequent layer switching into account [22], [23]. For audio, several methods and sophisticated algorithms have been developed to evaluate the perceived QoS, such as the E-model (ITU G.107), the R-value [24], PSQM (ITU P.861), PAMS (BT), PEAQ (ITU-R BS.1387), PESQ [25], [26], and the single ended objective measurement algorithm in P.563 [27]. The E-model of the ITU-T Recommendation G.107 [28] uses transmission impairment factors based on a concept given in the description of the so-called OPINE model. The result of a calculation with the E-model is the transmission rating factor R, which is composed of R = R0 −Is −Id −Ie−eff +A where all of the factors are composed of several sub-factors. R0 represents the basic signal-to-noise ratio, including noise sources such as circuit noise and room noise. The factor Is represents the impairments occurring simultaneously with the voice transmission; Id describes all impairments due to the delay of voice signals, while Ie describes the equipment impairment factor, which is derived from a set of values described in ITU-T Recommendation G.113. The advantage factor A describes psychological aspects under the viewing. The Application Performance Index (APDEX) [29], [30] is a numerical measure of consumer satisfaction for groups of consumers, for instance for measuring response times. User ratings are categorised into satisfied, tolerating, and frustrated. APDEXT is then calculated from the numbers in each category, and ranked into five quality classes from unacceptable to excellent. III. Q UALITY DEGRADATION MODEL In the scenario shown in Figure 1, the streamed data are transported from the CP through various networks to the device where the stream is presented. Each entity along this chain can potentially mean a decrease in quality as compared to the original quality QO . We account for this by using the model defined below that estimates the subjective QoE both for single consumers based on factors reducing the original quality of content, and for groups of consumers based on the APDEX formula discussed above. A. QoE for one consumer Inspired by the E-model, we estimate the quality perceived by the end user as a product of the original quality and a
number of influencing factors. Each factor is related to a 111 certain entity of the delivery chain in our scenario and hereby represents the respective impact on the consumer quality. Thus, the estimated QoE for one consumer is defined as Y ˜ = QO · Q Mi , i∈{E,S,N,U,V,A}
where QO is the original quality measure, MA ≥ 1, and 0 < Mi ≤ 1 for i ∈ {E,S,N,U,V}. Setting Mi = 1 denotes the lack of influence, such as a transparent channel. In the following we describe each single factor: ME :
MS :
MN :
MU :
MV : MA :
Influence of the encoding on the delivered content. It depends on the codec, codec parameters, and the content (fast vs. slow movements, colour, contrast, etc.). Influence of the streaming server on the delivered content. It depends on the streaming protocol, the implementation of the streaming server and, to a certain extent, on the codec. Influence of the network on the delivered content. This factor is influenced by technical parameters like delay, jitter, congestion, packet loss, and out of order packet arrival. It also depends on the used codecs and protocols. The parameter consists of three distinct parts: the CP network, the ISP network, and the consumer network. Possible influences from the hardware at the consumer’s home (e.g., routers, WLAN, sharing with other devices) are taken into consideration. Influence of the consumer’s equipment on the delivered content. Hardware type and parameters (e.g., CPU speed, memory size), system and application software, and a system load parameters have an influence on MU . Influence of the viewing conditions in the consumer’s home, such as distance to the viewing screen. Advantage factor from the use of the content, modelling cognitive effects like the acceptance of a grainy image sometimes encountered with older films. This increases the value of the content subjectively, even if the technical QoE is worse.
Note that in the general case, some of the factors are not orthogonal, i.e., they depend on the impact factors of previous steps. For instance, a particular networking error can be visible in different manners for different codecs or bandwidth settings. The factors Mi must be derived from an objective measurement, here called assessment process, and mapped/scaled to the allowable range of values as defined above. Ideally, a model calibration process using regression analysis could be ˜ However, used to derive the scale factors for calculating Q. this requires a large data set of measurements, so that the dependencies between all input parameters can be derived. We cannot present such a data set, since this would require to perform a very large number of SAMVIQ assessments, which are rather costly and time consuming. Instead, we simplify
2011, © Copyright by authors, Published under agreement with IARIA - www.iaria.org
International Journal on Advances in Systems and Measurements, vol 4 no 1 & 2, year 2011, http://www.iariajournals.org/systems_and_measurements/
the model and select only significant parameters, as detailed below.
different QoE degradation than a randomly distributed packet 112 loss pattern.
B. Simplified model and parameter scaling
C. QoE for groups of consumers
As MU is outside the control of CPs and ISPs, we assume MU = 1 in this work. Notably, we argue that most modern media playing and viewing devices have enough computing power to decode video streams, and that there is not too much additional load on the processing unit. We assume memory to be available in a sufficient amount. Next, even though the MV is usually considered in assessment processes by applying approved standard settings (for instance specified in SAMVIQ), we set MV = 1 for the sake of simplicity, assuming perfect viewing conditions. Finally, MA = 1 as the advantage factor obviously is outside the scope of this paper. ME and MS depend on encoding and streaming parameters. Because they are controlled by CPs and ISPs, both factors can be combined as ME,S , which is determined as follows. In a representative pre-evaluation, several videos covering various content characteristics like sports or talking head are encoded with varying parameters and streamed. The subjective quality of the decoded frames is recorded as a function of the most important parameter, the bit rate allocated to the sequence. Given a particular bit rate and content type, the respective score can be found by means of a function derived from prerecorded measurement points. The score is then scaled linearly to the range (0,1] and hereby becomes identical with ME,S . We show how to derive this factor in Section IV-B. MN depends on the networks of providers and consumer, which results in measurable delay, jitter, and packet loss. For the QoE of the consumer, the resulting packet loss is most important. Modern media players typically employ some form of buffers, such that jitter and delay eventually will result in packets arriving too late for decoding, and thus contribute to packet loss. Therefore, we consider packet loss as the relevant parameter for MN . We derive MN from an assessment that evaluates the influence of packet loss on the QoE. Under varying network conditions, the influence of packet losses on the perceived QoE is measured, and the resulting score is scaled to fit the range (0,1]. Again, this pre-evaluation is made available to the CPs and ISPs in the form of look-up tables. Note that the values measured also depend on encoding parameters. Packet loss is the result of bit errors that cannot be corrected, bursty packet loss occurring for other reasons, delay above the buffer size, and jitter above a certain threshold. Note that these are related to each other. Typical values are: ∼ 30 − 40 ms for delay [31], ∼ 14 ms for jitter [31], and ∼ 5 ‰ for packet loss [32], concerning wired ADSL connections. These values are too small to show a significant impact on the QoE, as shown in Section IV-C. However, when the consumer uses a WLAN, the packet loss rate is typically around 5% [33]. Also, in the case of network congestion, significantly higher values apply, e.g., a packet loss rate above 10% [33]. Finally, bursty packet loss appears when wireless networks are used, which can cause
˜ describes the QoE for one consumer, the ISPs While Q need a measure to describe the QoE of a group of consumers who share common resources, such as a common router or DSLAM. For this we apply the APDEX model [30] as follows. We classify the consumers into three quality classes according ˜ given the threshold values TS and TU , like to their current Q, ˜ > Ts , in the set so: The consumer is in the set M (S) for Q (T) (U) ˜ M for Ts > Q > Tu , and in the set M else. The threshold ˜ and TU at TS is suggested to be at 60-80% of the maximum Q, about 40%, depending on the expectations of the consumers. We then apply the formula (S) M + ( M (T) /2) , AM = |M (S) | + |M (T) | + |M (U) | and rank AM into U (unacceptable), P (poor), F (fair), G (good) and E (excellent) with the threshold values 0 ≤ {U } ≤ 0.5 < {P } ≤ 0.7 < {F } ≤ 0.85 < {G} ≤ 0.94 < {E} ≤ 1. These quality classes are visualised, e.g., using a colour code, for groups of consumers. IV. S UBJECTIVE Q UALITY A SSESSMENT In order to establish the correlation between known parameters, such as bit rate, content type, and packet loss, and estimated subjective quality, in particular ME , MS , and MN , our project partner Institut f¨ur Rundfunktechnik (IRT) conducted assessments for the WM9 codec [34], [35] using the SAMVIQ (Subjective Assessment Methodology for VIdeo Quality) method. The choice of settings and parameters used in the assessment, such as encoding parameters, frame rate, or format, is guided by the practical needs of the CP participating in our project. A. Assumptions and methodology For the assessment we use the SAMVIQ method as a tool, rather than developing an own assessment method. SAMVIQ is well-known, and defines experiment settings, the workflow necessary for an assessment, and how to ensure a statistically significant result. In the assessment different qualities are rated without the subjects knowing what they are rating. While this method provides a metric for measuring quality, it is unaware of any technical contexts, such as encoding parameters or measured objective values. While we can observe how varying parameters have an impact on the perceived quality, the method cannot decide on the cause for a particular results. In case of an unexpected assessment outcome, other methods need to be employed to find out the specific causes, such as inspecting the code of the software or analysing the impact of protocol parameters.
2011, © Copyright by authors, Published under agreement with IARIA - www.iaria.org
International Journal on Advances in Systems and Measurements, vol 4 no 1 & 2, year 2011, http://www.iariajournals.org/systems_and_measurements/
B. Assessment of encoding and streaming parameters How the configuration of the encoding and streaming tiers influence the perceived quality is discussed below. For practicality purposes, we define the production quality factor MP = ME MS as the product of the encoding and streaming quality factors, as ME and MS are partly correlated due to a joint dependency on the used codec. MP depends on a number of factors. Scene type, spatial resolution, and bit rate varied in our experiments, as detailed below. Other parameters were set to a reasonable value to keep the complexity at a moderate level. Four image sequences with different content were used. “Skiing” is a bright, almost monochromatic sequence with little camera motion. “Rugby” is moderately detailed, with a lot of camera motion and moving objects. “Rainman” is highly detailed but contains only little camera motion, while “Barcelona” is very colourful and detailed. All sequences were originally in SD quality. CIF resolution videos (352 × 288 pixels) were produced from SD material by means of cropping and subsampling. The duration of the sequences was chosen to be roughly 10 s in order for a sequence to contain a uniform scene type. However, since 10 s is too short to achieve a stationary bit rate control, each 10-second sequence is repeatedly fed into the encoder, resulting in — with 4 repetitions — a total duration of 40–60 s. However, only the last sequence was actually shown during the visual assessment. The encoder was configured to operate with a fixed given bit rate, ranging from 80 Kbps to over 1 Mbps with CIF size image material, and from 800 Kbps to 10 Mbps with SD imagery. The frame rate of the SD sequences was 25 Hz, whereas the frame rate of the CIF sequences varied from 6.25 fps at 80 and 168 Kbps to 12.5 fps at 352 Kbps and 25 fps for higher bit rates, in order to allow for a minimum image quality at very low rates. Below a rate of 384 Hz, the encoder was operated in Simple Profile (Medium Level and Low Level, depending on the bit rate), while the Advanced Profile, Level 0 was turned on at higher bit rates. The key frame distance was set to 2–3 s, to balance the bit rate consumption of intra frames, which demands as few intra frames as possible, against (re-)synchronisation ability constraints, which calls for frequent insertion of intra frames, as intra frames can be used by decoders to regain synchronisation with the bit stream in case of transmission errors or when switching channels. Concerning the encoder’s quality parameter, the best compromise between smoothness and sharpness were yielded at a value of 50. The final parameter to adjust, the buffer size, was set to contain an entire group of pictures, i.e., all frames in the interval from one intra frame to the other. The subjective assessment follows the SAMVIQ method introduced above. Eighteen individuals participated in the testing in total. All met identical viewing conditions and started the testing session with a training phase where they, after having received instruction, could become acquainted with their task. During the testing, the sequences encoded with differing bit rates were presented to the participant in
113
Figure 2. Recorded subjective quality assessment rate using the SAMVIQ scale as a function of content and encoding rate. WM9 codec, CIF video format.
random order, with the original sequence in the first, and the tester was then asked to assign a proper score for the perceived image quality, ranging from 0 to 100 (excellent). Comparisons with other scores for other sequences and adjustment of all scores simultaneously was possible. The original sequence was hidden among the test sequences as a means to control each personal assessment, and to sort out statistical outliers. The evaluation’s outcome is as follows. There were three outliers. Those data were discarded, leaving fifteen valid participant contributions. The data have been aggregated in rate distortion curves, where the distortion/quality is measured in the SAMVIQ scale that directly translates to the shown Mean Opinion Square (MOS). When normalised by the maximum scale, the values correspond to the production quality factor MP . Figure 2 summarises the assessment for all sequences with CIF resolution, including the average (“Global”), while Figure 3 shows the average for SD image material. As can be seen, the average CIF curve is nearly logarithmic. Nearly 400 Kbps are needed to achieve a “Fair” quality assessment. For a “Good” quality or better, at least 800 Kbps are necessary. A bright sequence like “Skiing” and one with a moderate amount of detail like “Rugby” can easier meet a “Fair” or “Good” quality constraint. In contrast to that, “Rainman” with a lot of high-frequency content and the highly detailed “Barcelona” need 1100 Kbps and 1000 Kbps, respectively. Such a spread favours the taxonomy of various image sequences according to a few key parameters over a simplification with a single average, as the variance of bit rates to achieve for instance a “Good” quality is very large. Examples for key parameters are amount of detail, amount of colour, number of moving objects, camera movement (including zoom, turn, etc.), and number of scene changes. The sequence average curve for SD-sized imagery shows that “Fair” is achieved at a rate of roughly 2 Mbps, “Good” at 3 Mbps, and “Excellent” at 5 Mbps. In general, this curve
2011, © Copyright by authors, Published under agreement with IARIA - www.iaria.org
International Journal on Advances in Systems and Measurements, vol 4 no 1 & 2, year 2011, http://www.iariajournals.org/systems_and_measurements/
Figure 3. Recorded subjective quality assessment using the SAMVIQ scale as a function of encoding rate, averaged over all sequences. WM9 codec, SD video format.
is much steeper at lower rates than the CIF average within the corresponding region. A bit rate larger than 6 Mbps is not justified as the gain in terms of quality improvement is only minor. C. Assessment of network parameters The next task was to determine the network’s influence on the perceived quality, i.e., the quality factor MN . This was accomplished by exposing the compressed and streamed video signal to transmission errors. A network simulator emulated suitable conditions as typically encountered on real networks. More specifically, the effects of the error types delay, jitter, and packet loss were investigated. A 60-second test sequence was assembled, consisting of six single short sequences of different characteristics, including the previously introduced TV material, which had been converted to CIF format (352×288 pixels) according to ITU-R BT.601 in advance. Hence, the results presented here are valid for a wide spectrum of source signals. The encoder and streaming server, namely the Microsoft Windows Media Encoder version 10 and Microsoft Windows Media Server 2003, were set up as explained in Section IV-B, using bit rate/frame rate combinations of 300 Kbps @12,5 fps, and {600, 1000, 1400} Kbps @25 fps. The key frame distance was set to 3 s, and the quality level to 50. The encoder established communication between client and server using the proprietary and now deprecated MMS (Microsoft Media Services) protocol version 9. With MMS, service requests are by default negotiated according to the Real-Time Streaming Protocol (RTSP), and the actual streaming relies on Real-Time Transport Protocol (RTP) and Real-Time Transport Control Protocol (RTCP), which are based on UDP. The Shunra cloud network simulator (version 4.0) was used in the experiments. It exposed the bit stream to typical channel conditions and common error patterns, i.e. delay, jitter, and packet losses. While the maximum channel bandwidth was
considered to be 1500 Kbps including return channel, the 114 packet size was set to 1290 Bytes, both of which are realistic values. Prior to the experiment, the effect of delay, jitter, and packet loss were verified by means of the IxChariot network emulator and analyser, and the Ethereal (now Wireshark) analyser. The introduced error patterns were recorded by deploying the Shunra Cloud Catcher and Ethereal and fed as input into the network. By doing so, it was ensured that all bit streams were exposed to the same error pattern, providing equal network conditions with all encoder and streaming parameter settings. As previously mentioned, all error scenarios included the error-free case, i.e., the transparent channel, and all error types were tested separately. Values for the delay of packets were {1200, 1400, 1800, 3000, 4000} ms, {400, 500, 600, 700} ms for jitter, and {1, 5, 10, 15, 20}% regarding channel packet losses. It should be stressed that these are packet losses on the network that are not necessarily identical to the packet losses encountered at the decoder, since reasonably large jitter and delay in combination with a small packet buffer at the decoder can lead to packet losses in addition to network packet losses. The buffer size is handled transparently by the player software. For decoding, Windows Media Player version 10 with the default configuration was used. Decoding artifacts due to bit rate constraints and the effects of channel errors were typically blurring, blocking, and frozen image streams. The subjective evaluation itself was conducted by six experts in the field of video processing in side-by-side comparisons with the encoded and decoded reference sequence (which can be treated as the case of an error-free transmission) on the one side, and the error-affected and decoded video on the other side. Among the shown sequences was also always a hidden reference sequence to check for any potential bias of the respective evaluator. The error types and error parameters were randomised in order. The evaluators ranked the perceived image quality according to the continuous MUSHRA-scale (Multi Stimulus test with Hidden Reference and Anchor), ranging from 0 to 100, with a splitting of the credit point scale into the five equally spaced categories as in the previous section. For each error setting, the evaluation’s mean value and according 95% confidence interval were calculated. Figure 4 summarises the findings for channel packet loss. The error-free case with 0% packet loss ratio shows how the quality of each stream is perceived depending only on the bit rate. Not surprisingly, the higher the bit rate, the better the quality. More specifically, the bars answer the question what bit rate is needed to achieve a “Fair” (40-60) or “Good” (6080) quality with CIF imagery. The subjective quality is — as expected — identical for all error types in the error-free case. As expected, the quality decreases with an increase of the packet loss ratio. It is interesting to see, however, that lowquality sequences are less affected by transmission errors and are hence more robust. In other words, the higher the image quality, the worse the degradation in case of errors. It appears that the best compromise between quality in the presence of network errors and quality in the error-free case is
2011, © Copyright by authors, Published under agreement with IARIA - www.iaria.org
International Journal on Advances in Systems and Measurements, vol 4 no 1 & 2, year 2011, http://www.iariajournals.org/systems_and_measurements/
115
Figure 4. Quality assessment in SAMVIQ scale form as a function of bit rate and packet loss ratio. Not all combinations of rate and packet loss have been tested Figure 6. Quality assessment in SAMVIQ scale form as a function of bit rate and packet delay in ms. Not all combinations of rate and delay have been tested
Figure 5.
Quality factor MN , depending on bit rate and packet loss Figure 7.
accomplished with a bit rate between 600 Kbps and 1000 Kbps with CIF-sized image material. Then, a packet loss ratio of roughly 5% is the critical threshold under which the channel conditions should not drop in order for the quality to remain “Fair”. From the perceived quality, the network quality factor MN can easily be calculated. Given the maximum quality Qmax in the error-free case and the perceived quality Qp (P LR) at a particular packet loss ratio (PLR), the factor can be defined as Qp (P LR)/Qmax and is hence mapped to the interval [1, 0]. The characteristics of the degradation of MN with an increase of packet losses are shown in Figure 5. Missing measurement points have been linearly interpolated and extrapolated prior to the mapping from Qp (P LR) to MN . We also show the results for jitter and packet delay for completeness, even though both error types will — depending on the size of the decoder’s packet buffer — eventually lead to decoder packet losses. The characteristics of the curves are thus expected to be similar to the packet loss case, as also proven in Figure 6 and Figure 8. Figure 6 shows the subjective quality in case of packet delay, while the normalised quality factor is plotted in Figure 7. As before, missing measurement values have been
Quality factor MN , depending on bit rate and packet delay
inter-/extrapolated before mapping Qp (P LR) to MN . The results are consistent with those in the packet loss scenario in that low-bitrate streams are inherently more robust to errors than streams with a high bit rate. With the aforementioned recommended bit rate in the range [600,1000] Kbps and the given CIF image sequences, the critical threshold, under which the channel conditions should not drop in order for the quality to remain “Fair”, is approximately 1500 ms. We have also performed experiments with a packet delay of 4000 ms and found results similar to the optimal performance, which is rather counter-intuitive, as we expected the quality to be lower than with a delay of 3000 ms. While our assessment setup is not designed to find the causes for such behaviour, possible explanations include: (a) The technical setup of the experiment might have a property that inflicts this behaviour, such as the network simulator shaping the traffic accordingly. Generating traffic patterns that are at the edge of the usual definition areas are likely to show unexpected behaviour and outliers. Such a pattern may interfere with the decoder’s behaviour. An investigation of the traffic generator’s behaviour and assessments with varying parameters other than the delay
2011, © Copyright by authors, Published under agreement with IARIA - www.iaria.org
International Journal on Advances in Systems and Measurements, vol 4 no 1 & 2, year 2011, http://www.iariajournals.org/systems_and_measurements/
hence not be treated as being significant.
116
V. C ONTROLLING AN A DAPTIVE S TREAMING A PPLICATION
Figure 8. Quality assessment in SAMVIQ scale form as a function of bit rate and jitter in ms. Not all combinations of rate and jitter have been tested
In the following we apply the estimated subjective quality ˜ to the Adaptive Internet Multimedia Streaming (ADIMUS) Q architecture. The ADIMUS architecture [36], [37] aims to support end-to-end video streaming of entertainment content with high media quality to mobile terminals. We are therefore concerned with data delivery mechanisms that impact quality. Since the content is streamed from live feeds or streaming servers to mobile devices, the interplay of backbone and access technologies is considered. In our work, we consider a delivery system that consists of multiple service providers streaming video content via IPbased networks to multiple mobile terminals. These mobile terminals may use diverse network technologies and different types of terminals to access and view the content. As the video is transmitted from a service provider to a mobile terminal, its quality is degraded by several factors that are specific to different parts of the network infrastructure. Thus, we study the degradations originating from the network, and use the degradation values as input to the adaptation mechanism. A. Adaptation in ADIMUS
Figure 9.
Quality factor MN , depending on bit rate and jitter
value would be required to verify this assumption. (b) The video decoder software might have implemented functionality to avoid unfavourable network traffic patterns. Usually, some kind of buffering is used for this. Verifying this assumptions would require access to more precise technical data, or even the source code of the player software. (c) The decoder software also might have implemented active error recovery and concealment. A verification of this assumption would require either the complete technical specification of the player software or access to the source code. We have not been able to gain access to any of those due to the proprietory nature of the software. We exclude errors in the general setup of the experiment, since the SAMVIQ method was scientifically evaluated, and the experiment was performed under the supervision of the IRT who also were involved in the development of SAMVIQ. Finally, Figure 8 summarises the findings for network jitter and neatly confirms the prior conclusion. Here, the critical threshold is roughly 600 ms. The normalised quality factor for jittering is plotted in Figure 9. The curve characteristics here are as explained above. The slight increase of MN at a rate of 300 Kbps and a jitter of 500 ms as compared to the error-free case is most likely subject to the overall subjective impression of a number of image artifacts observed by the testing persons, such as blurring, blocking, and playback freezing, and should
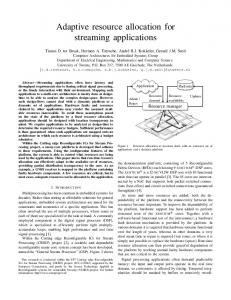
The ADIMUS architecture comprises a delivery infrastructure based on source nodes at the service provider, an overlay network of ADIMUS proxies (AXs), and multi-access networks supporting mobile terminals as shown in Figure 10. The architecture contains QoS estimation mechanisms based on subjective (QoE) and objective (QoS) metrics from measured values. 1) The overlay network: In the backbone network, the data is routed through an overlay network which implements application-layer routing servers. To adapt to varying resource availability in the Internet, the AXs of the overlay network monitor connections and makes application-layer forwarding decisions to change routes. The overlay network of the streaming infrastructure uses appropriate streaming protocols and source-driven mechanisms for applying quality-improving mechanisms. Streaming servers representing source nodes, and the AXs operated by service providers, are placed in the Internet to form an overlay network. Such overlays constitute fully meshed networks that allow overlay re-routing when IPbased routing cannot maintain the required QoE on the direct IP route between server and client. The AXs monitor network conditions using both passive and active network measurements, and they possibly interchange information about observed network conditions. Statistical information about the observed conditions of the network is used to estimate trends in, e.g., bandwidth, latency or packet loss at a given link or path. Note that routing decisions in the overlay network do not have the requirement of a very fast reaction time. This is by design because maintaining complete up-to-date bandwidth information does not scale. Instead, worst-case changes can increase the end-to-end delay
2011, © Copyright by authors, Published under agreement with IARIA - www.iaria.org
International Journal on Advances in Systems and Measurements, vol 4 no 1 & 2, year 2011, http://www.iariajournals.org/systems_and_measurements/
117
Figure 10.
Transmission chain in the ADIMUS architecture. Entities which have an influence on the consumer’s QoE are identified.
by a factor of several times. However, the full connectivity of the overlay network allows eventual recovery of the QoE if the required network resources are available, even if the QoE is temporarily not acceptable. Terminals can initiate a session with the streaming server. Based on the overlay’s monitor function of the network, the most appropriate overlay route is chosen. The last overlay node on the route always acts as a data source for the terminal. A reinvitation to the terminal is issued when route changes in the overlay involve a change in the last node. Such re-invitations are also used when route changes are triggered by reports from a mobile terminal. Furthermore, ADIMUS supports multipath streaming to provide failure resistance and load balancing. Usually, the overlay nodes connected to the multi-access network use different access links for the different IP addresses of each of the mobile terminal’s wireless devices. Aside from cross-layer information provided for faster reaction to changes at one of the wireless links, the multipath support is implemented entirely at the application level. This implies that multipath streaming is only possible to mobile terminals that run applicationaware application layer software that handles buffering and reordering. The unavoidable reordering that occurs due to the use of several routes would lead to reduced QoE without buffering and re-ordering. In each AX, algorithms perform the allocation of streams, so that the bandwidth is allocated, trying to optimise both the network load, and the subjective quality for the consumers. The algorithm in an AX can only make decisions on the basis of locally available information, and possibly on information that is communicated externally to an AX. In order to evaluate an algorithm for decision making at an AX, we can perform simulations for given topologies. The results of these simulations can then be compared to benchmarks that provide the optimal case [38], [39]. Since there are many
possible scenarios we consider two major scenarios; the first being a unicast scenario where most user requests to the same video are not overlapped in time. This can be seen as a case for video-on-demand streaming. Multiple paths are built using the overlay nodes and optimal path selection and rate allocation is a challenge under varying network conditions. In a second scenario we consider multicast, which is suitable for life-streaming. The challenge here is to construct multiple multicast trees over the overlay network and perform the rate assignment to these trees. 2) The multi-access network: Near the mobile terminal a heterogeneous multi-access network provides application adaptation and handover mechanisms to maximise the Quality of Experience (QoE), and to support different types of mobility. A cross-layer signalling system is utilised to feed the different decision-points with continuous system status information. The multimedia streaming end point at the terminalside is the mobile terminal, which resides in the multi-access network consisting of different IP-based access networks of different technologies and managed by different parties. The mobile terminal is equipped with multiple network interfaces, and has support for IP mobility protocols, such as Mobile IP (MIP) [40]. The mobile terminal is thus capable of roaming between IP networks. In the case of MIP, route optimisation needs to be supported for the mobile terminal to be able to update its mobility information directly to the correspondent node. The multi-access network environment allows handovers as a means for maintaining the QoE. Specifically, the mobile terminal is capable of selecting an alternative access when the current link does not meet the minimum QoS requirements of our video streaming service. To make an informed handover decision, the mobile terminal collects and utilises information related to the available access options’ characteristics, forming ˜ The parameters for Q ˜ can be the degradation function Q.
2011, © Copyright by authors, Published under agreement with IARIA - www.iaria.org
International Journal on Advances in Systems and Measurements, vol 4 no 1 & 2, year 2011, http://www.iariajournals.org/systems_and_measurements/
obtained through a cross layer mechanism, such as the IEEE 802.21 Media Independent Handover (MIH) framework [41] and the triggering framework [42]. B. Applying the Degradation Function ˜ can be used to We discuss how the estimated QoE Q make decisions in ADIMUS, such as application layer routing decisions, transcoding, the selection of coded bandwidth, the selection of layers in the overlay network, and triggering decisions in the multi-access network. In Section IV, we have shown that packet loss is the most relevant parameter to indicate the subjective quality. Therefore, ˜ we make use of packet loss as the main when using Q parameter. 1) Packet Loss in the Overlay Network: The ADIMUS overlay network is based on the Internet infrastructure, and depends on the properties of Internet traffic in general. Since packet loss is also used to control other mechanisms on the Internet, such as the TCP rate control, we need to consider several scenarios to make sure that these control mechanisms on the Internet, and in ADIMUS, do not impact each other. In a network where TCP competes with other traffic, TCP rate control will increase bandwidth until packet loss happens; then it will reduce the bandwidth of a TCP stream. This mechanism will also affect packet loss of other streams, both UDP and TCP traffic. Since the strategy of TCP is to use as much bandwidth as possible, until packet loss occurs, TCP can affect other mechanisms in the Internet; it can also be affected by these. Random Early Detection (RED) [43] is one of these mechanisms that prohibit bandwidth saturation for TCP streams. On the other hand, other traffic, such as media streams, can impact the TCP rate control. Therefore, non-TCP traffic needs to be designed to be TCP-friendly [44]. In the Internet backbone, packet loss is usually a sign that the maximum bandwidth of a channel is exceeded, i.e., the Internet routers are not capable of forwarding all incoming packets. Different mechanisms in the Internet regulate which packets are forwarded and which packets are possibly discarded. Depending on the employed mechanisms the packet loss in the backbone has a certain burstiness, i.e., the ability to impact a larger series of packets. It is generally understood that packet loss on the Internet is likely to be bursty, but using multipath routing can render the loss patterns to be less bursty [45] if every packet sequence is distributed fairly to all paths. When an AX is informed about too much packet loss in the overlay network (or in the backbone network) the reason is likely due to trying to use more capacity than is available. The overlay network can then try to re-route and thus avoid the links of the network that cause the packet loss. Alternatively, AXs in the network can throw away packets in an informed ˜ for single consumers manner. When doing so the estimate of Q and AM for groups of consumers can be used to optimise the possible user satisfaction under the given circumstances. 2) Forward Error Correction: ADIMUS is able to correct the media stream in each AX in order to achieve better QoE, at the cost of increased delay and jitter values. Forward Error
Correction (FEC) [46] techniques can be applied to reduce 118 the impact of packet loss. It is generally understood that the packet loss in the Internet is bursty, and using FEC is known to be ineffective to recover from burst errors. In this case, using multipath routing is beneficial as it can result in less bursty loss [45]. Using error concealment, missing packets can be replaced with corrected packets by the AX nodes in the application layer. Therefore, when using FEC, the packet loss rate for other traffic differs from the ADIMUS traffic. In practice, the ˜ A is better than the estimated QoE in the application layer Q ˜ ˜A ≥ Q ˜N . estimated QoE in the network layer QN , i.e., Q However, we have shown in Section IV that loss degradation resilience for low-bandwidth streams is considerably higher than for high-bandwidth streams. The bandwidth of the original stream does therefore need to be taken into account in the decision to apply FEC. An AX can limit ADIMUS stream bandwidth regardless whether the stream is FEC-protected. Considering the result graphs in Section IV, there is a trade-off, depending on the original encoding quality, represented by the coding bandwidth and the loss rate. Tolerating loss can, up to a certain threshold, lead to better subjective results than FEC-protecting the stream with lower coding bandwidth, provided that both streams consume the same amount of overlay resources. As an example, Figure 4 shows that the QoE decrease for lower coding bandwidth tends to be larger than the QoE decrease for tolerating higher loss rates. 3) Reserved Channels: Another solution to avoid interferences with other traffic is the use of reserved channels, e.g., mechanisms for DiffServ, IntServ, or MPLS tunnels [47]. In ˜ can be the case of reserved channels for ADIMUS, the value Q used directly in the AXs to make routing decisions. However, the QoS mechanisms in the Internet need extra resources to be deployed by the ISPs. Therefore, these are currently not sufficiently deployed, while ISPs supporting these mechanisms will tend to have QoS reservations or reserved tunnels only as payable services. As a consequence, using these mechanisms could render ADIMUS only suitable for pay-services. 4) Packet Loss in the Multi-Access Network: In the multiaccess network of ADIMUS packet loss is more likely caused by physical reasons in the wireless medium than being caused by exceeded bandwidth requirements. For instance, in WLAN networks the beacon can regularly cause a bursty packet loss, typically 60 consecutive packets every 1200 packets [32]. Therefore, in the multi-access network, packet loss cannot be considered an indicator for exceeded bandwidth limits. However, packet loss can still be used to estimate the quality of the ˜ and be included in the calculation of triggering stream using Q, decisions, i.e., switching between different base stations. A cross-layer signalling architecture related to ADIMUS for streaming to mobile terminals has been presented by M¨akel¨a et al. [48]. 5) Estimated QoE for the Consumer: The transmission chain in ADIMUS, shown in Figure 10, can be considered to be similar in structure to the transmission chain shown in
2011, © Copyright by authors, Published under agreement with IARIA - www.iaria.org
International Journal on Advances in Systems and Measurements, vol 4 no 1 & 2, year 2011, http://www.iariajournals.org/systems_and_measurements/
˜ to consider the influence of Figure 1. Therefore, we adapt Q the overlay network, and the multi-access network in order to ˜ for the consumer. For ADIMUS, present the estimated QoE Q ˜ Q at the application layer needs to be considered, i.e., packet loss and other parameters that are measurable at the application layer. ˜ at the application layer gives an estimate on user satisQ faction, and can show the need for adaptation in the network. ˜ for the consumer does not give evidence on which However, Q adaptation measures need to be taken. These decisions are to be taken by cross-layer mechanisms in the multi-access network [48] and routing decisions in the overlay network. Thus, for ADIMUS we consider MN = MN,overlay · MN,multi-access while the other settings are chosen similarly to the parameters shown in Section III. C. Using Scalable Video Coding In addition, to minimise the effects of transient congestion to multimedia transmission and QoE in a wireless access link, link-level adaptation can be used. In general, video streams consist of packets that have a differing impact on the decoded video quality. In the case of an MPEG-2 encoding, for example, packets contributing to I, P or B frames may be lost. Their absence affects the display quality for the playout duration of a whole group-of-pictures (GOP), part of a GOP, or only a single frame, respectively. Video streams can, in general, tolerate some packet loss, but this implies that loosing certain types of packets has a smaller impact on quality than loosing others. Rate-distortion analysis assesses this impact [49] and allows an AX to perform controlled dropping of the least important packets. Scalable video codecs such as H.264 SVC [50] improve on the options that exist for controlled dropping. H.264 SVC encodes a base layer as an independent, and backward compatible stream that must be treated like a non-scalable stream. An SVC stream comprises additional enhancement layers that improve the temporal or spatial resolution of the base layer, or decrease its blurriness. These can be dropped by the AX without introducing any errors into the display of the base layer. However, the QoE can be reduced in a content-aware, controlled manner, since the AX can be instructed to avoid packet loss in the less important layers. Thus, it is possible to remove excess enhancement layers from the stream on the fly without affecting session continuity; the only effect is on the QoE. In the multi-access part of the ADIMUS architecture, link level adaptation is used to ensure that the terminal receives at least the most important frames, i.e., the base layer frames when under poor link conditions. In the overlay network of ADIMUS, using SVC the AX nodes can make content-aware decisions to drop packets that do not belong to the base layer. The impact on the QoE when packet loss affects single layers of a scalable stream has not been studied here. However, further research is needed before SVC can be used for the algorithms employed in the AX nodes.
VI. C ONCLUSION
119
We introduced an image and video quality degradation model to estimate the subjective image and video quality on the basis of objective measurements. The model takes all entities which potentially degrade the image and video quality into account. All influencing factors are either calculated for individual users or groups of consumers. The latter is achieved by adapting the APDEX method to the scenario. The quality estimation model was implemented by means of pre-recorded tests for single consumers, the purpose of which is to represent realistic values in corresponding situations. The implementation uses look-up tables to calculate an estimate for the user’s perceived image quality and can thereby provide help to locate the causes of reported quality degradation. The results show how the perceived quality depends on a number of key parameters, among which the bit rate, content type, and packet loss ratio. Not surprisingly, the subjective quality decreases with an increase of the packet loss ratio. The degradation is much stronger for high-bandwidth than for lowbit-rate video, though. For packet loss, most of the degradation occurs with a packet loss ratio higher than 5%. This is deemed as rather large as compared to parameter values usually experienced in networks, but it is still an important result as such values may be encountered in real-life scenarios involving the users’ own networking equipment. For the values of jitter and delay we experienced a similar result. Another important outcome is the image quality’s dependency on the encoding and streaming bit rate. This allows the Internet service provider the possibility to adjust the bit rate automatically with regard to the observed packet loss ratio. The degradation for different bit rates indicates clearly a more complex dependency between ME,S and MN than our simplified model allows. For the practical application of giving feedback to providers, we solved this problem by making the function for MN dependent on discrete, fixed bandwidth settings. However, for the general case more research is needed. For a regression analysis, a much larger data sample, and thus assessment sessions, would be required. The proposed model has been implemented and incorporated in current software that is in use at the Norwegian TV Channel TV2. In the implementation the values for packet loss, jitter, delay and system information are collected on the consumer’s devices using an applet connected to the player software. This requires the consent of the consumer. These values are reported to a service installed at the CP or ISP, where the QoE values are calculated for each consumer and groups of consumers. The result of this calculation is shown graphically on a display at the CP or ISP. Since the measurement frequency for our application is in the range of seconds, the data rate of the return channel is low. The proposed model is of valuable help to content providers and Internet service providers to exclude causes of quality problems that are outside their control. We discussed how to apply the estimated QoE and the degradation function to the ADIMUS architecture that sup-
2011, © Copyright by authors, Published under agreement with IARIA - www.iaria.org
International Journal on Advances in Systems and Measurements, vol 4 no 1 & 2, year 2011, http://www.iariajournals.org/systems_and_measurements/
ports streaming to mobile nodes. When controlling adaptation mechanisms in a streaming system, we need to identify possible interferences with other mechanisms in the Internet, such as the TCP rate control. Therefore, the estimated QoE cannot be used directly to control adaptation in a network or its parts. Instead, the estimated QoE can be used for decisions that an adaptation ought to take place. Together with different application layer mechanisms, such as forward error correction or scalable video coding, the ˜ can give valuable hints for decision making in the function Q adaptation mechanisms, especially for the cases where nodes, here the AXs, need to make decisions on the basis of local knowledge. Since the AX nodes can do error concealment at ˜ for an AX can help make decisions the application layer, Q for optimising the overlay network. Algorithms that make routing decisions in the nodes of the ˜ as input. However, research is overlay network need to use Q needed which weight factors are useful for different topologies and other settings in the ADIMUS architecture. The careful design of these algorithms and the necessary parameters will be done, and compared to benchmarks that already have been developed. ACKNOWLEDGMENT The work described in this document has been conducted as part of the MOVIS project funded by the Norwegian Research Council, and the ADIMUS (Adaptive Internet Multimedia Streaming) project funded by the NORDUnet-3 programme. The authors wish to thank Volker Steinmann and in memoriam Gerhard Stoll at the IRT for performing the assessment for the MOVIS project. We want to thank Arne Berven at the Norwegian TV channel TV2, and Reza Shamshirgaran at Nimsoft AS for the discussions during the implementation of the feedback system developed in this project. Finally, we thank Tiia Sutinen, Knut Holmqvist, Trenton Schulz and Carsten Griwodz for discussions during the course of the ADIMUS project and the preparation of this paper. R EFERENCES [1] W. Leister, S. Boudko, and T. Halbach, “Estimation of subjective video quality as feedback to content providers,” Proc. ICSNC’10, Fifth International Conference on Systems and Networks Communication, pp. 266–271, 2010. [2] Norwegian Computing Center, “MOVIS — Perfomance monitoring system for video streaming networks,” Web page, Sep. 2007, accessed 2010-11-29. [Online]. Available: http://www.nr.no/pages/dart/project flyer movis [3] Tektronix, “A guide to maintaining video quality of service for digital television programs,” White Paper, Tektronix Inc, Tech. Rep., 2000. [4] V. Paxson, G. Almes, J. Mahdavi, and M. Mathis, “Framework for IP Performance Metrics,” RFC 2330, May 1998, [Online]. Available: http: //www.ietf.org/rfc/rfc2330.txt, last accessed May 14, 2010. [5] V. Smotlacha, “QoS oriented measurement in IP networks,” CESNET Report 17/2001, CESNET, Report 17/2001, 2001, [Online]. Available: http://www.cesnet.cz/doc/techzpravy/2001/17/qosmeasure.pdf, last accessed May 14, 2010. [6] D. P. Pezaros, “Network traffic measurement for the next generation Internet,” Ph.D. dissertation, Computing Dept. Lancaster University, 2005. [7] Q. Huynh-Thu and M. Ghanbari, “Scope of validity of PSNR in image/video quality assessment,” Electronic Letters, vol. 44, no. 23, pp. 800–801, 2008.
[8] P. Ni, A. Eichhorn, C. Griwodz, and P. Halvorsen, “Fine-grained scalable streaming from coarse-grained videos,” in International Workshop on120 Network and Operating Systems Support for Digital Audio and Video (NOSSDAV). ACM, 2009, pp. 103–108. [9] M. Knee, “The picture appraisal rating (PAR) - a single-ended picture quality measure for MPEG-2,” Snell & Wilcox Limited, White Paper, 2006, [Online]. Available: http://www.snellgroup.com/documents/ white-papers/white-paper-picture-appraisal-rating.pdf, last accessed May 14, 2010. [10] H. Koumaras, A. Kourtis, C.-H. Lin, and C.-K. Shieh, “End-to-end prediction model of video quality and decodable frame rate for MPEG broadcasting services,” International Journal On Advances in Networks and Services, vol. 1, no. 1, pp. 19–29, 2009, [Online]. http://www. iariajournals.org/networks and services/ last accessed March 25, 2010. [11] T. Chiang and Y.-Q. Zhang, “A new rate control scheme using quadratic rate distortion model,” IEEE Trans. Circuits and Systems for Video Technology, vol. 7, no. 1, pp. 246–250, 1997. [12] S. Wolf and M. Pinson, “Video quality measurement techniques,” NTIA Report 02-392, National Telecommunications and Information Administration, US Dept of Commerce, NTIA Report 02-392, 2002. [13] M. Mu, “An interview with video quality experts,” SIGMultimedia Rec., vol. 1, no. 4, pp. 4–13, 2009. [14] M. H. Pinson and S. Wolf, “Comparing subjective video quality testing methodologies,” in VCIP, ser. Proceedings of SPIE, T. Ebrahimi and T. Sikora, Eds., vol. 5150. SPIE, 2003, pp. 573–582. [15] ——, “An objective method for combining multiple subjective data sets,” in VCIP, ser. Proceedings of SPIE, T. Ebrahimi and T. Sikora, Eds., vol. 5150. SPIE, 2003, pp. 583–592. [16] ITU-R, “Methodology for the subjective assessment of the quality of television pictures,” ITU Standardization Document, ITU, Gen`eve, ITU Standardization Document, 2004. [17] EBU project group B/VIM, “SAMVIQ - subjective assessment methodology for video quality,” European Broadcasting Untion (EBU), Report BPN 056 / B/VIM 053, 2003. [18] F. Kozamernik, P. Sunna, E. Wyckens, and D. I. Pettersen, “Subjective quality of internet video codecs,” European Bradcasting Union (EBU), EBU Technical Review, 2005. [19] F. Kozamernik, V. Steinmann, P. Sunna, and E. Wyckens, “QSAMVIQ - a new EBU methodology for video quality evaluations in multimedia,” Proc. IBC 2004, 2004. [20] J. Bennett and A. Bock, “In-depth review of advanced coding technologies for low bit rate broadcast applications,” in proc. IBC 2003. IBC, 2003, Proc. IBC 2003, pp. 464–472. [21] P. Casagranda and P. Sunna, “Migration of new multimedia compression algorithms to broadband applications,” in proc. IBC 2003, 2003, proc. IBC 2003, pp. 473–479. [22] P. Ni, A. Eichhorn, C. Griwodz, and P. Halvorsen, “Frequent layer switching for perceived quality improvements of coarse-grained scalable video,” Multimedia Syst., vol. 16, no. 3, pp. 171–182, 2010. [23] N. Cranley, P. Perry, and L. Murphy, “User perception of adapting video quality,” International Journal of Man-Machine Studies, vol. 64, no. 8, pp. 637–647, 2006. [24] NetPredict Inc., Assess the Ability of Your Network to Handle VoIP before You Commit, White Paper, NetPredict Inc, 2002-2004. [25] ITU Study Group 12, Perceptual evaluation of speech quality (PESQ) – An objective method for end-to-end speech quality assessment of narrowband telephone networks and speech codecs., ITU-T Recommendation P.862, ITU-T, 2001. [26] C. Hoene, “Internet telephony over wireless links,” TU Berlin, Tech. Rep., 2005. [27] ITU-T, Single Ended Method for Objective Speech Quality Assessment in Narrow-Band Telephony Applications, ITU-T Recommendation P.563, ITU-T, 2005. [28] ——, G.107: The E-model, a computational model for use in transmission planning, ITU-T Recommendation, ITU-T, 2003. [29] “Apdex - Application Performance Index,” web pages www.apdex.org, last accessed March 25, 2010. [30] P. Sevcik, “Defining the application performance index,” Business Communications Review, pp. 8–10, March 2005. [31] S. Katsuno, T. Kubo, K. Yamazaki, and H. Esaki, “Measurement and analysis of multimedia application and IPv6 ADSL Internet access network,” Proc. of the 2003 Symposium on Applications and the Internet (SAINT’03), 2003.
2011, © Copyright by authors, Published under agreement with IARIA - www.iaria.org
International Journal on Advances in Systems and Measurements, vol 4 no 1 & 2, year 2011, http://www.iariajournals.org/systems_and_measurements/ [32] D. Pezaros, D. Hutchison, F. Garcia, R. Gardner, and J. Sventek, “Service quality measurements for IPv6 inter-networks,” Proceedings of the 12th International Workshop on Quality of Service IEEE, 2004. [33] B. Sat and B. W. Wah, “Playout scheduling and loss-concealments in voip for optimizing conversational voice communication quality,” in ACM International Multimedia Conference (ACM MM), Oct. 2007, pp. 137–146. [34] V. Steinmann, A. Vogl, and G. Stoll, Subjective assessment of video quality depending on encoding parameters, Contribution of IRT to MOVIS WP2 Phase 1, technical documentation, Institut f¨ur Rundfunktechnik, 2006. [35] G. Stoll, A. Vogl, and V. Steinmann, Subjective Assessment of Video Quality depending on networking parameters, technical documentation, Institut f¨ur Rundfunktechnik, 2007. [36] W. Leister, T. Sutinen, S. Boudko, I. Marsh, C. Griwodz, and P. Halvorsen, “An architecture for adaptive multimedia streaming to mobile nodes,” in MoMM ’08: Proceedings of the 6th International Conference on Advances in Mobile Computing and Multimedia. New York, NY, USA: ACM, 2008, pp. 313–316. [37] ——, “ADIMUS – Adaptive Internet Multimedia Streaming – final project report,” Norsk Regnesentral, Oslo, Report 1026, September 2010, [Online]. Available: http://publ.nr.no/5335, last accessed January 11, 2011. [38] S. Boudko, C. Griwodz, P. Halvorsen, and W. Leister, “A benchmarking system for multipath overlay multimedia streaming,” in Proceedings of ICME, 2008. [39] ——, “Maximizing video quality for several unicast streams in a multipath overlay network,” in Proc. International Conference on Internet Multimedia Systems Architecture and Application 2010, Bangalore, India, A. Dutta and S. Paul, Eds. IEEE, 2010. [40] C. Perkins, Ed., Mobile IP: Design Principles and Practice. AddisonWesley, 1998.
[41] IEEE, “Media Independent Handover,” IEEE Draft Standard 802.21, 121 2008, work in progress. [42] J. M¨akel¨a and K. Pentikousis, “Trigger management mechanisms,” in Proceedings of ISWPC, San Juan, Puerto Rico, February 2007, pp. 378– 383. [43] S. Floyd and V. Jacobson, “Random early detection gateways for congestion avoidance,” IEEE/ACM Transactions on Networking, vol. 1, pp. 397–413, 1993. [44] J. Widmer, R. Denda, and M. Mauve, “A survey on TCP-friendly congestion control,” IEEE Network, vol. 15, pp. 28–37, 2001. [45] T. Nguyen, P. Mehra, and A. Zakhor, “Path diversity and bandwidth allocation for multimedia streaming,” in proceedings of ICME, 2003, pp. 6–9. [46] Y. Wang and Q. fan Zhu, “Error control and concealment for video communication: A review,” in Proceedings of the IEEE, 1998, pp. 974– 997. [47] V. Sharma and F. Hellstrand, “Framework for Multi-Protocol Label Switching (MPLS)-based Recovery,” RFC 3469 (Informational), Feb. 2003. [Online]. Available: http://www.ietf.org/rfc/rfc3469.txt [48] J. M¨akel¨a, M. Luoto, T. Sutinen, and K. Pentikousis, “Distributed information service architecture for overlapping multiaccess networks,” Multimedia Tools and Applications, pp. 1–18, 2010, 10.1007/s11042010-0589-9. [49] G. Sullivan and T. Wiegand, “Rate-distortion optimization for video compression,” IEEE Signal Processing Magazine, vol. 15, no. 6, pp. 74–90, Nov. 1998. [50] H. Schwarz, D. Marpe, and T. Wiegand, “Overview of the scalable H.264/MPEG4-AVC extension,” in Proceedings of ICIP, October 2006, pp. 161–164. [51] T. Ebrahimi and T. Sikora, Eds., Visual Communications and Image Processing 2003, ser. Proceedings of SPIE, vol. 5150. SPIE, 2003.
2011, © Copyright by authors, Published under agreement with IARIA - www.iaria.org