Keywords: Clustering numeric, categorical and mix datasets, Fibonacci series and golden .... tive hierarchical algorithms which are used for categorical data clustering. ..... For some datasets like IRIS, unsupervised clustering using FIBCLUS is.
Aggregate Distance Based Clustering Using Fibonacci Series-FIBCLUS Rakesh Rawat, Richi Nayak, Yuefeng Li, and Slah Alsaleh Faculty of Science and Technology, Queensland University of University Brisbane Australia {r.rawat,r.nayak,y2.li,s.alsaleh}@qut.edu.au
Abstract. This paper proposes an innovative instance similarity based evaluation metric that reduces the search map for clustering to be performed. An aggregate global score is calculated for each instance using the novel idea of Fibonacci series. The use of Fibonacci numbers is able to separate the instances effectively and, in hence, the intra-cluster similarity is increased and the intercluster similarity is decreased during clustering. The proposed FIBCLUS algorithm is able to handle datasets with numerical, categorical and a mix of both types of attributes. Results obtained with FIBCLUS are compared with the results of existing algorithms such as k-means, x-means expected maximization and hierarchical algorithms that are widely used to cluster numeric, categorical and mix data types. Empirical analysis shows that FIBCLUS is able to produce better clustering solutions in terms of entropy, purity and F-score in comparison to the above described existing algorithms. Keywords: Clustering numeric, categorical and mix datasets, Fibonacci series and golden ratio, similarity evaluation.
1 Introduction Evaluation of similarity of attributes between instances is the core of any clustering method. The better a similarity function the better the clustering results would be. If the dataset contains numeric attributes, distance measures such as Euclidean, Manhattan and cosine, are effective to evaluate the similarity between objects [1],[2],[3]. However when the dataset contains categorical (finite and unordered) attributes or a mix of numeric and categorical attributes then such distance measures may not give good clustering results [3]. Comparison of a categorical attribute in two objects would either yield 1 for similar values and 0 indicating that two instances are dissimilar. Such similarity measures are defined as overlap measure [4], and mostly suffer from the problem of clustering dissimilar instances together when the number of attributes matched is same, but attributes that are matched are different [5]. Data driven similarity measures are becoming a focus of research [5]. Datasets containing a mix of numerical and categorical attributes have become increasingly common in modern real-world applications. In this paper, we present a novel algorithm called as FIBCLUS (Fibonacci based Clustering) that introduces effective similarity measures for numeric, categorical and X. Du et al. (Eds.): APWeb 2011, LNCS 6612, pp. 29–40, 2011. © Springer-Verlag Berlin Heidelberg 2011
30
R. Rawat et al.
a mix of both these types of attributes. Due to the mapping of all attributes of an instance to a global aggregate score, this method reduces the complexity inherent in the clustering process. Moreover, due to the use of Fibonacci numbers to separate the attribute values, this method enables higher intra-cluster similarity and lower intercluster similarity and, in hence, better clustering. Experiments with the proposed method are conducted using a total of 9 datasets, containing a mix of numeric, categorical and combinational attributes. The quality of clusters obtained is thoroughly analyzed. Empirical analysis shows that there was an average improvement of 14.6% in the purity values, 28.5% in the entropy values and about 8% in the F-score values of clusters obtained with FIBCLUS method on all the datasets in comparison to clustering solutions obtained using the existing methods such as k-means, x-means expected maximization and hierarchical algorithms . The contributions of this paper can be summarized as: 1) A novel clustering similarity metrics that utilises Fibonacci series to find similarities between numerical, categorical and a mix of both the data types; 2) A global score representation method for these types of attributes; and 3) Enhancing existing clustering algorithms by using FIBCLUS as a similarity metrics.
2 Problem Statement When pure categorical datasets or mixed datasets consisting of both the categorical and numerical attributes are to be clustered, the problem is how to measure the similarity between the instances represented by categorical attributes. A similarity measure, overlap, between two categorical instances X i and X j can be defined as follows:
S( Xi , X j ) ≡
m
⎪⎧ 1, xik = x jk ⎪⎫
∑ δ ( xik , x jk ), where δ ( xik , x jk ) = ⎨0, x ≠ x ⎬ . ik jk ⎭ ⎪⎩ ⎪ k =1
(1)
Such similarity measures may result in weak intra similarity when calculating the similarity between categorical attributes [2]. Other similarity measures for categorical attributes such as Eskin, Goodall, IOF, OF, Lin, Burnaby [5] are based on the overlap similarity measure and inherit the same problems. Moreover, in modern real-world applications, data with various instances containing a mix of both categorical and numerical attributes are common. A problem arises when assignment of an instance to a particular cluster is not easy. This problem is shown by the example in deck of cards problem. Consider two datasets, one containing a single deck of 52 cards and another consisting of two decks of cards. Each deck of cards is identified by the distinct cover design it has. Clustering deck of cards may be a trivial problem, but it represents perfect clustering and the major shortcomings of clustering methods, which is when assignment of an instance to a cluster becomes difficult. As the number of deck increases, the number of clusters and the complexity inherent within the clustering process increases. As the number of deck increases from 1..n the number of perfect clusters increases to 4n where n is the number of decks. The ideal clustering results are shown in Table 2 for the deck of cards dataset problem. The corresponding clustering results obtained by different algorithms such as expectation minimization (denoted as EM), K means (KM) and extended K means (XM) are shown in Table 3.
Aggregate Distance Based Clustering Using Fibonacci Series-FIBCLUS
31
Table 1. Data description for deck of cards clustering problem SN
Attribute Name Card No Colour Category Deck Id
1 2 3 4
Attribute type Numeric/discrete Categorical Categorical Numeric/Binary
Value Range 1-13 2 4 1,2
Description 1-13 of all cards Red or Black Hearts, Diamonds, Spade, Clubs 1-1st Deck,2-2nd Deck
Table 2. Deck of cards cluster accuracy measure criteria (D1=deck1,D2=deck2) 2 Clusters 1-13, Red 1-13, Black
4 Clusters 1-13,Red , Hearts 1-13,Black , Spade 1-13,Black , Clubs 1-13,Red, Diamonds
8 Clusters 1-13,Red , Hearts, D1 1-13,Red , Hearts, D2 1-13,Red , Diamonds, D1 1-13,Red , Diamonds, D2 1-13,Black , Spade, D1 1-13, Black , Spade, D2 1-13, Black , Clubs, D1 1-13, Black , Clubs, D2
Table 3. Clustering results for decks of cards problem (D1=deck1,D2=deck2) SN
Clustering Algorithm
Cluster=2 Correctly clustered D1
D2
Cluster=4 Correctly Clustered D1
D2
Cluster=8 Correctly clustered D2
1
EM
100%
100%
100%
100%
48.07%
2 3
KM XM
100% 100%
98% 98%
63.5% 73.1%
62.5% 62.5%
56.7% 56.7%
4
Direct
25%
62.5%
38.5%
36.5%
31.7%
5
Repeated Bisection
25%
65.5%
48%
44.2%
31.8%
6
Agglomerative
48%
65.5%
33%
48%
25%
7
Clustering Functions #4, #5, #6 above with FIBCLUS
100%
100%
100%
100%
100%
These were implemented in Weka [6] with both Euclidian and Manhattan distances. Clustering using direct, repeated bisection and agglomerative were used with both the cosine and correlation coefficient similarity measures implemented in gcluto [1]. Only the best results observed are reported for all the methods. Results clearly show that the mentioned clustering algorithms based on respective similarity measures perform satisfactory with a single deck of cards, but as the complexity increases the clustering performance starts decreasing (Table 3). This problem occurs due to the similarity methods adopted by such algorithms. Such methods are unable to handle the mix of attributes and their inherent relationships. As the number of deck increases from one to two, the distance measures or similarity methods employed by such methods start to overlap distances.
32
R. Rawat et al.
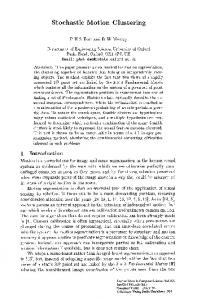
Fig. 1. (a) Agglomerative (4 Clusters)
Fig. 1. (c) Agglomerative (8 Clusters)
Fig. 1. (b) FIBCLUS with Agglomerative (4 Clusters)
Fig. 1. (d) FIBCLUS with Agglomerative (8 Clusters)
The figures 1(a)-1(d) further visualize the cluster assignments for the 2 deck of cards. For agglomerative algorithm, the best of the cosine and correlation coefficient similarity measures was taken. With FIBCLUS and agglomerative clustering both measures gave same results. From figures 1(a), 1(c) it can be clearly deduced that clusters have overlapping distances, which consequently results in a weak clustering solution. The assignment of same peaks to a set of clusters shows the overlapping and, consequently a weak intra cluster similarity value. However in figures 1(b) and 1(d), with FIBCLUS, the clusters were clearly identifiable. The high peaks in figures 1(b) and 1(d) binding similar instances together confirm that the intra cluster similarity was maximized using the method, hence resulting in the desired and optimal clustering for the underlying problem. Further separate peaks for each of the 8 clusters reflects high inter cluster similarity.
3 Related Work K means clustering is one of the best known and commonly used algorithm. K means [7] were inherently developed to deal with numerical data, where distances between instances are a factor for clustering them together. The widely used distance measure functions adopted by K means are Euclidean, Manhattan and cosine. Several K means extensions have been developed to cluster categorical data [3],[7]. Authors in [7] developed an efficient algorithm which clusters categorical data using the K means concept. A dissimilarity function based on simple matching, which evaluates the dissimilarity between a categorical instance and the cluster representative is used. The frequencies of all attributes of the instance matching the cluster are used for
Aggregate Distance Based Clustering Using Fibonacci Series-FIBCLUS
33
calculating the dissimilarity. Another approach based on K means to cluster categorical datasets [3] uses simple matching scheme, replaces means of clusters by modes and uses frequency to solve for the best clustering outputs. A further classification of similarity evaluation for categorical data based on neighbourhood [8],[9],[10] and learning algorithms [11],[12] is discussed in [5]. Mostly neighbourhood based evaluation methods use similarity methods as adopted by the overlap measures [5]. Some of them are Eskin, Goodall, IOF, OF, Lin, Burnaby [2]. Unlike the overlap measure, these measures consider both similarity and dissimilarity between instances, assigning 1 for a perfect match and arbitrary small values for a mismatch. Rock [10] and Cactus [11] are some of the popular agglomerative hierarchical algorithms which are used for categorical data clustering. Rock clusters instances in an agglomerative way maximizing the number of links in a cluster whereas Cactus utilises co-occurrence of pairs of attributes values to summarise the data and to achieve linear scaling. Birch [13] and Coolcat [14] are other popular clustering methods used for clustering categorical data. Birch uses a balanced tree structure (CF tree) which preserves the attribute relationships within different instances as leaf nodes and then clustering is done on these leaf nodes. Coolcat is an incremental algorithm which achieves clustering by trying to minimize the entropy values between clusters. An approach [15] to cluster categorical and mix data uses a distance based similarity. A weighting scheme is adopted by the authors which utilizes the relative importance of each instance. Once distance between instances is evaluated a modified version of similarity metrics defined by [16] as S( Xi, X j ) = 1 − d p ( Xi , X j ) is used to find instances similarities. Simple similarity measures such as overlap suffer from the problem of clustering dissimilar instances together when the number of attributes matched is same, but attributes that are matched are different. Moreover, these similarity measures may perform well with categorical data, but in the case of mixed data which contains both numerical and categorical data the performance declines as the complexity within clusters increases.
4 The Fibonacci Series and Golden Ratio The proposed FIBCLUS (Fibonacci based Clustering) uses the Fibonacci series to determine a global score for each instance and then utilizes the aggregate distance as a similarity function. Fibonacci series is a sequence of numbers {Fn }∞n =1 defined by the linear recurrence equation Fn = Fn −1 + Fn − 2 . The first two Fibonacci numbers are 0 and 1, and each subsequent number is the sum of the previous two. The Fibonacci series has been applied in many scientific and real life fields [17] from analysis of financial markets, to development of computer algorithms such as the Fibonacci search technique and the Fibonacci heap data structure [18]. One of the prominent properties of Fibonacci series is that the ratio of two successive numbers Fn / Fn −1 , where n ≥ 7 tends towards 1.6 or ϕ , as n approaches infinity [17]. This value of ϕ is also called as the golden ratio. The primary purpose of using Fibonacci series is, since each similar attribute of all instances are multiplied by a distinct successive Fibonacci number, only similar
34
R. Rawat et al.
attributes in different instances will have same values and will be clustered appropriately. If there are m categorical attributes in an instance which have been converted into equivalent numerical attributes then as we do Fibonacci transformation of the xi ,2 xi ,3 xi ,m , ,.. attribute from 1...m the ratio between will increase significantly, xi ,1 xi ,1 xi ,1 however for two successive attributes, it will always have a minimum values as ϕ. Due to this transformation property the ordering of attributes will have no major effect on the clustering solution, as the global scores per instance will be compared with each other when performing the clustering solution.
5 The Proposed FIBCLUS Method The aim of using FIBCLUS with numeric data is to generate a search space in which the input instances are clearly distinguishable. FIBCLUS represents each instance as an aggregate global value compromising of various attributes. In other words, if there are n numeric instances and m number of attributes then the FIBCLUS reduces the search space for each X = { X 1, X 2 ,.., X n } from m to 1: \ n = {( xn,1 , xn,2 ..xn,m )} → {( xn,1 )}
(2)
For categorical and mix data the aim of FIBCLUS is to identify the best possible similarity that exists between a pair of instances by considering all the attributes. The score of all attributes in this case is also represented as an aggregate global score. Given the set of instances X = { X 1, X 2 ,.., X n } with m number of attributes ( xi ,1, xi ,2 ,... xi ,m ), a Fibonacci number is initialized for each attribute maintaining the golden ratio ϕ. Let F = {F1, F2 ... Fm } be the set of Fibonacci numbers chosen corresponding to m number of attributes where each successive Fibonacci number F j +1 maintains the golden ratio ϕ with the preceding number F j . In the experiments F1 is initialized as F1 = 5 because the series starts to get closer and closer to ϕ after this number. Consider an example for the dataset of four attributes xi ,1 , xi ,2 , xi ,3 , xi ,4 , where F = {5,8,13, 21} is the set of Fibonacci numbers. In this case, F1 = 5 is used to transform xi ,1 and F2 = 8 is used to transform xi ,2 and so on. A value in F maintains the golden ratio as F2 / F1 , F3 / F2 , F4 / F3 ≅ 1.6. There are three cases, which have to be considered while clustering with FIBCLUS. Case 1: Clustering pure numeric attributes. In this case the maximum value of each attribute max( xi ,1 ), max( xi ,2 ),...max( xi ,m ) is used for normalizing the attribute values. Normalization is done to scale the values in a constant range so that the Fibonacci number chosen for that attribute does not drastically change the golden ratio φ , which separates the values of one attribute from another. Case 2: For clustering pure categorical attributes each categorical attribute values are mapped into numeric values. Each instance X i with attributes as ( xi ,1, xi ,2 ,... xi ,m ), and Fibonacci mapped value F j xi , j is assigned a score. Each instance is compared for similarity with other
Aggregate Distance Based Clustering Using Fibonacci Series-FIBCLUS
35
instances. Case 3: In this case for clustering mix of both numeric and categorical attributes, let k be the number of categorical attributes, and l be the number of numeric attributes, where k + l = m . The score of each instance is determined separately based on the values of both numeric and categorical attributes (case 1 and case 2) as shown in step 3 of algorithm (figure 2). k
m
( xi ,l )
1
1
max( xi ,l )
Score( X i ) = ∑ ( xi ,k × Fk ) + ∑
× Fl .
(3)
Input: X = { X 1 , X 2 ,.., X n }; // Datasets instances with m attributes as xi ,1 , xi ,2 ,..., xi ,m . F = {F1, F2 .. Fm }. //Successive Fibonacci numbers F corresponding to each 1..m attributes.
F j xi , j = Categorical attribute values, mapped into numeric value .
Output: \ n = {( xn,1 )} A = [n × n ] Begin: Step 1. F1 = 5.
// Numeric instances: Global score // Categorical or Mix: Similarity Matrix. // Initialize Fibonacci series.
Step 2.
// For numeric attribute max( xm ) finds maximum attribute value from instances. For each j=1 to m; max( x j )
Step 3.
// Evaluate scores for each instance. For each i=1 to n; Score( X i ) = 0.0; For each j=1 to m;
If domain ( xij ) = Numeric Score( X i ) = Score( X i ) +
xi , j max( value j )
Else domain ( xij ) = Categorical Score ( X i ) = Score( X i ) + F j xi , j .
Step 4. // Calculate similarity between instances. For each i=1..n; For each j=1..n; If ( ( Score(X i )