Algorithm of the Choice of the Missing Data Imputation Method for the Urban Public Transport System Quality Indicator Construction Irina Yatskiv1, Irina Pticina2 1,2
Transport and Telecommunication Institute 1 e-mail:
[email protected] 2 e-mail:
[email protected]
Abstract The quality of such a complicated system as the urban public transport one is characterized by a large number of parameters; consequently, to carry out analysis and draw a comparison, scalar composite indicator must be used. The authors investigate a possibility of construction of urban public transport system quality indicator (UPTQI) provided missing data is present. Incomplete data is typical for countries featuring lack of national-scale data collection programs relating to transportation systems. Quite a number of incomplete data recovery methods are known in statistics; however, no unified methodology of selecting such a method exists. This work suggests a five-stage algorithm of missing data imputation method selection with respect to a predetermined data set. The main idea of the algorithm is that data skips in preset proportions are simulated with respect to a subset of input data with no missing values whatever, and are substituted subsequently by using various methods. Then the most appropriate method of missing data imputation is determined according to some criteria and is used to substitute skips in the full dataset. The computing environment developed for realization of the algorithm is presented. UPTQI was constructed for 62 European cities with missing data in values of sub-indicators as a numeric example.
Keywords: public transport, quality, composite indicator, weights, missing data, software
Introduction The Urban Public Transport System (UPTS) is characterized by the amount of properties, such as availability, accessibility, information, time, customer care, comfort, security, environmental. A set of quality indicators for UPTS was developed by project QUATTRO and contains 25 initial indicators characterised these properties. The common famous approach in benchmarking in this multivariate case is to construct composite indicator. The problem of developing the composite indicator in different fields is a subject that quite a number of theoretical researches (Saisana, 2002; Gertsbakh, 2008; Nardo, 2008). There are works which are devoted of the composite indicator constructing for an estimation of the transport system quality (Hermans, 2009; Peña, 1997; Seco, 2007).
A commonly encountered problem of indicator of UPTS quality constructing is the missing data problem. There are many classical approaches for work with incomplete data set, presented in famous monograph of Little (1988) and Rubin (1987). The approaches to missing values imputation can be subdivided into two groups: Single imputation (Implicit modelling - Unconditional mean/median/mode imputation, Regression imputation, Expectation Maximisation (EM) imputation; Explicit modelling) and Multiple imputation. The simplest existing methods have been implemented actually in all application program packages for statistical data processing such as unconditional mean imputation and regression imputation. The unconditional mean imputation, as the simplest-ever method, “averages” the data, reducing the variable variance and correlation. When using methods based on regression analysis, a problem may arise implying that some objects may feature not only missing values of the variable for which the regression model is constructed but missing values of some other variables as well. The additional complexity is that the arguments correlating with the replaced variable should be selected for the construction of the model. In these latter days, many works have been dedicated to modern approaches such as EM-algorithm for imputation and multiple imputation. A review of the EM algorithm and its solution is provided by Schafer (1997). Multiple Imputation (Little, Rubin, 2002), an alternative the EM-method, has the major problem - the absence of simple software. As there are no universal recommendations for usage of this or that method of the imputation of the missing data and results of its usage depend on character of a solved problem, on a set of variables, and on model of skips. This current work is the continuation of the investigation in the field of constructing the composite indicator for UPTS quality estimation (Yatskiv, Pticina 2010a, 2010b). Let‟s consider the composite indicator (CI) which we shall use to evaluate the quality of UPTS - the urban public transport quality indicator – UPTQI. For constructing the composite indicator the ten-step algorithm, which was developed the Organization of Economic Cooperation and Development (OECD) (Nardo, 2008), was used The integral (composite) indicator is a function from sub-indicators and weights, which define each sub-indicator investment amount in composite indicator. The main task posed when constructing indicators of that kind is the weights coefficients estimation. To resolve the task, a few methods are suggested in this methodology (Nardo, 2008), that can be divided up into two groups: based on statistical analysis (factor analysis, regression analysis etc) and based on the opinion of experts (Conjoint Analysis, Analytic Hierarchy Process – AHP etc). The method based on Principal Components and Factor analysis (PCA/FA) model (Nicoletti, 2000) and benefit of the doubt approach (BOD) (Cherchye, 2007) for calculating weights were used in this research. The main emphasis is made upon the incomplete data problem. The problem urgency when constructing the UPТS quality indicator is related to the fact that the indices characterizing the efficiency and the quality of UPТS are not collected at all in many countries – for instance, in some new EU member states. The authors suggest that the selection of missing data imputation method should be done, taking into account the specific character of the dataset available; the authors suggest the algorithm of the best method selection, which is realized through software support.
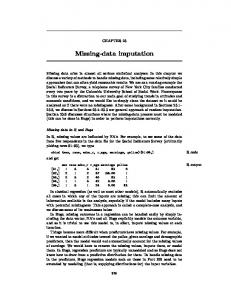
1. Algorithm of the choice of the missing data imputation method We use M indices of UPTS quality as sub-indicators. There is the dataset of fixed subindicators values for L cities, N cities from them don‟t have any skips in the subindicators values and (N-L) cities have missing data. The appropriate method for the missing data imputation must be selected for composite indicator constructing for the full dataset (L cities). The five-stages algorithm of the choice of the missing data imputation method for the available dataset of the sub-indicators values is offered and presented at Fig. 1. Start
Input data: M – number of sub-indicators L- number of cities N – number of cities without missing data (L-N) – number of cities with missing data
1 stage. Estimation of composite indicator scores for N cities (without missing data) 1) Weights estimation (PCA, BOD) 2) Composite indicator and ranks estimation (CIorigI and Rorig)
2 stage. Removing and substitution
1) Delete data from N cities proportionally missing data in L cities 2) Deleted values Imputation by some methods
Simple random sampling imputation 3 stage. Choice one of the missing imputation method 1) Estimation of composite indicator scores for all cases with estimation 2) Criterias estimation: Pearson’s correlation for CIOrig and CIimp Spearman’s correlation for Rorig and Rimp Sum of squared deviation from Ciorig and Cimp
Cluster-based imputation
K-NN imputation
Choice one of the missing imputation method Mean-bassed imputation
4 stage. Composite indicator constructing
PMM imputation
1) Imputation of the missing data in L-N cities with choosing method 2) Weights estimation (PCA, BOD) 3) Composite indicator (CIL) and ranks (RL) estimation for L cities EM imputation 5 stage.Analysis of stability and sensitivity Comparing CI nad R for N cities in case without (L-N) cities and with (L-N) (correlation )
End
Fig. 1. Algorithm of the choice of the missing data imputation method
At the first stage the composite indicator for cities without missing data is estimated and ranks of cities are determined. These values are called by the original values of composite indicator (CIorig) and of city rank (Rorig). At the second stage, some values from the data set where sub-indicator values are known (N cities) are removed (proportionally to missing values in the complete data set) and then are substituted. For imputation of the missing data in considered data set the following methods were used: unconditional mean imputation; imputation by simple random sampling; clustering-based imputation; K- nearest-neighbor imputation (k-NN); imputation by predictive mean matching (PMM); Expectation-Maximization algorithm (EM). The method of unconditional mean imputation is the simplest one. It has been included into the investigation as the method most frequently used in statistical software. It implies estimation of missing values xi,j by the average value x j . The imputation by simple random sampling takes a random draw from the observed data of j variables, and imputes these into missing cells. The imputed values for current variables xi,j does not condition on any other variable. Various approaches for missed data imputation, implying cluster analysis, are known. In this work, we consider the clustering-base missing data imputation based on next steps: 1. One of the methods of cluster analysis is applied to objects without missing data, - and С clusters are singled out. 2. The distance to the centres of all the С clusters is calculated with respect to each i object of observation having some missing data (the Euclidean distance). Any variables where values are missing are not involved in the calculation of distance. 3. The nearest cluster is determined, with the minimal distance to it. The skipped value of i object is substituted for the mean value of the corresponding variable pertaining to those observations that are attributed to the nearest cluster. In the K-nearest-neighbors imputation method, missing values in a case are imputed using values calculated from the K nearest neighbors, hence the name (Chen, 2000). The nearest, most similar, neighbors are found by minimising a distance function, usually the Euclidean distance. The simple algorithm of k-NN for imputing the missing values is follow: (1) Compute the distance between object i and K objects in x, using only those co-ordinates not missing in i. (2) Identify the K closest. (3) Impute the missing values of object i by averaging the corresponding values of missing sub-indicators of the K closest. Imputation by predictive mean matching based on Rubin (1987). It is similar to the regression method except that for each missing value, it imputes a value randomly from a set of observed values whose predicted values are closest to the predicted value for the missing value from the simulated regression model. First a regression is performed of the variable that has to be imputes on some explanatory variables. Again only the objects without missing data in the regression are used to estimate the parameters. By means of the regression results, values are predicted for the missing values. For every missing value the record is searched for with the nearest predicted value. Finally the original value of this donor is imputed for the missing value.
The Expectation-Maximization (EM) algorithm is a broadly applicable approach to the iterative computation of maximum likelihood estimates, useful in a variety of incompletedata problems. The EM algorithm is an iterative algorithm, in each iteration of which there are two steps: the expectation and the maximization. The algorithm first bootstraps a sample dataset with the same dimensions as the original data, estimates the sufficient statistics (with priors if specified) by EM, and then imputes the missing values of sample. It repeats this process m times to produce the m complete datasets where the observed values are the same and the unobserved values are drawn from their posterior distributions. An excellent discussion of the EM algorithm and its solution is provided by Schafer (1997). At the third stage, the influence of missing data imputation methods on the composite indicator value is investigated. The values of composite indicator (CI) and rankings (R) of N cities with respect to all cases of missing values imputation are calculated. Afterwards, the received CI and R values will be compared to original values CIorig and city rankings Rorig that had been calculated for the same cities – however, with no skip in data. Then the most appropriate method of missing data imputation will be selected for the given set. The Person‟s correlation between CIorig and СI, the Spearman‟s correlation between Rorig and R, the sum of squared deviations CI from CIorig are used as selection criteria. At the fourth stage the missed values in the full set of data (L cities) by using the method selected at the first stage are imputed. The weight coefficients and values of composite indicators for all the cities (CIL) are calculated and cities rankings (RL) are determined. At the fifth stage, the analysis for sensitivity and stability of results are performed. To do that, the values CI and R that had no skipped data (N cities) are compared – both when data on other cities is available and missing.
2. Instrument To analyse the influence of the missing data imputation methods upon the result of the composite indicator construction, we have developed a computing environment with the main functions as follows: simulation of skips within the complete set of input data; missing data imputation by several methods, and evaluation of the composite indicator values. Fig. 2 shows the structure of the software tool based on a Windows application and developed with the programming language C#. The application initiates the functions of R and MathCad for some calculations, assigning them some definite parameters. The main input data for the application is sub-indicator values describing the cities, presented in the file in .csv format, - wherein the columns correspond to sub-indicators while the rows correspond to the cities. The functions of the application: 1. Random generation of skips in dataset. The number of skips is assigned by user (in %) either for the complete set of data or for each sub-indicator individually. 2. Missing data imputation by several methods (unconditional mean imputation, Knearest-neighbor imputation, clustering-based imputation, simple random sampling imputation, PMM (imputation by predictive mean matching,) EM-imputation).
Input data Initial dataset Count and structure of moddeling skips Count of runs
Application
Cases without missing data
R Разбиение cases на кластеры
MathCad Weights coef. Estimation wit BOD method
Normalised dataset
Weight’s coeff.
Windows-application (С#) Reading and writing data in files Skips generation Normalisation Mean imputation Cluster-based imputation Weights coeff. Estimation with PCA method Composite indicator estimation
Dataset with skips Completed dataset
Dataset Factors loadings
K-mean – procedure (packade «clara») Missing data imputation with Knn method (packade «impute») Missing data imputation with Pmm method (packade «mice») Missing data imputation with Simple method (packade «mice») Missing data imputation with EM method (packade «Amelia») Factor loadings estimation (principal component analysis, packade «psych»
Output data Dataset with skips Dataset with imputation of skips Weights coef (BOD, PCA) Values of CI
Fig. 2. The structure of the software tool 3. Normalisation of sub-indicator values. 4. Weight calculation through the methods of BOD (wij) and PCA (wi) and evaluation of the values of the composite indicator CI for cities. 5. Saving the results into files. The output data is the files presented in .csv format, containing the composite indicator values obtained for each run of the procedure and for each method of missing data imputation (calculated separately through BOD and PCA methods), - and the original values (without missing data). There is also a possibility of receiving the following datasets: (1) with skips in sub-indicator values have been generated; (2) with the imputed missing values on the basis different methods; (3) the weight values calculated by the BOD method with respect to each method of missing data imputation and with respect to data without skips and (4) the weight values calculated by the PCA method with respect to each method of missing data imputation and with respect to data without skips. The obtained results can be used for the further analysis and for taking decision on selecting a method of the missing data imputation with respect to the dataset investigated.
3. Numerical results In the work 8 indices of UPTS quality are used (see Yatskiv, 2010a, 2010b) from 21 founded in data base EUROSTAT, unfortunately, the values of others indices have more than 80% of missing data. To conduct the investigation, the data describing UPTS in 62 European cities were used with respect to 2003-2006 moments of time, from them: 37 German cities (without missing data) and 25 other European cities (basically capitals, 3 from them don‟t have missing data and 22 with missing data in sub-indicators values, but
no more than 3 missing values). The total number of missed values is 6.85% from the total number of values. The most appropriate method for available data of missing data imputation must be used for constructing the quality indicator for all cities. The developed software tool was used for investigation the influence of missing data imputation methods on the composite indicator value. The input data were sub-indicator values for 37 German cities (without missing data). In random manner, 5% of the subindicator values were removed from the data in the first case, 10% - in the second case, and 15% - in the third case. In each case, 10 runs of data skips-generating procedure were performed, implying the missing imputation by using 6 methods and the estimation of the composite indicator value. As a result, 10 values of CI were obtained for each of the three cases and for each method of missing data imputation. CIorigBOD and CIorigPCA were also received for the case implying without missing data. To select the best method of missing data imputation, we have used mean values of the criteria as follows: the Person‟s correlation between values CIorig and СI, given with imputation; the Spearman‟s correlation between values Rorig and R, given with imputation; the sum of squared deviations (SSD) CI from CIorig. Table 1 and Table 2 shows the mean correlation ratio between the original values CIorig and Rorig with the values received in the case implying skips in data and different count of skips, where the weighting factors are calculated by two methods - BOD and PCA. Table 3 shows the mean values of the SSD from the true value of composite indicator. Table 1. The mean value of Pearson‟s correlation with originals CI norm 5% skips BOD PCA Random 0.943 0.936 0.970 0.960 Mean Cluster 0.969 0.958 k-NN 0.976 0.961 PMM 0.978 0.959 0.963 0.943 EM Method
10% skips BOD PCA 0.911 0.892 0.949 0.933 0.949 0.928 0.952 0.931 0.934 0.913 0.930 0.916
15% skips BOD PCA 0.866 0.829 0.907 0.875 0.884 0.859 0.911 0.877 0.894 0.887 0.890 0.873
Table 2. The mean value of Spearman‟s correlation with originals R 5% skips BOD PCA Random 0.931 0.926 0.952 0.936 Mean Cluster 0.951 0.938 k-NN 0.957 0.940 PMM 0.964 0.939 0.941 0.917 EM Method
10% skips BOD PCA 0.888 0.850 0.927 0.902 0.929 0.908 0.933 0.902 0.911 0.888 0.907 0.883
15% skips BOD PCA 0.839 0.846 0.884 0.841 0.850 0.813 0.889 0.840 0.864 0.841 0.853 0.824
Table 3. The mean SSD for CIorig and CI what calculated with imputation Method Random Mean Cluster k-NN PMM EM
5% skips BOD PCA 0.406 0.425 0.211 0.254 0.226 0.266 0.176 0.247 0.169 0.280 0.247 0.339
10% skips BOD PCA 0.679 0.655 0.356 0.427 0.345 0.434 0.310 0.408 0.446 0.530 0.467 0.514
15% skips BOD PCA 1.090 1.066 0.659 0.731 0.808 0.876 0.571 0.662 0.659 0.588 0.708 0.672
The largest value of correlation coefficient between the calculated CI and CIorig , also, between R and Rorig is observed for values obtained by the BOD method (the values are marked in Tables 1 and 2. The best indices are observed when using the cluster-based, PMM and k-NN methods. Moreover, increasing the number of skips when using the cluster-based method the values of the indices deteriorate abruptly as compared to the other two methods; the reason is that the clusters are constructed with a lesser number of
objects (without missing data) and, accordingly, the correctness of division by clusters arises some doubts. The k-NN method, in its turn, remains the best method when increasing the number of skips. Furthermore, we have simulated skips in data proportionally the missing values in the full dataset. As in the previous cases the rank city values and CI values closer to the original when the weights are calculated with BOD method and missing data is substituted by kNN method (the Pearson‟s correlation mean value of 10 runs is 0.97, the Spearman‟s correlation value - 0.95). Moreover, the least value of SDD when skips are substituted by k-NN method (0.2) (see Fig.3) with low value of variation of 10 runs (0.004).
Fig.3. The mean SSD for CIorig and CI what calculated with imputation So, for our dataset we‟ll use the BOD approach for calculating the weighting coefficients as the least sensitive to skips in data and k-NN method for missing data imputation. Let‟s calculate the composite indicator for the full data set. The missing values were substituted by using the k-NN imputation method. The weighting coefficients and the value of CI are calculated by using BOD approach. The values of CI, the normalized values of indicator (CInorm), and the rankings (R) for some cities are showing at Fig. 4.
Fig. 4. The values of CInorm for 62 European cities
The cities have been ranked in descending order of the normalised CI - from Helsinki and Torino (CInorm=1) to Schwerin (CInorm=0). For stability analysis, let‟s compare CI values to the rankings of 37 German cities yielded with and without using data of other cities. Fig. 5 shows the rankings of 37 German cities calculated in both cases (R37 and R62->37).
Fig. 5. The ranks of 37 German cities The high value of the correlation ratio between normalised CI values (the value of Pearson‟s correlation 0.94) and the rankings yielded for 37 German cities – both with and without other European cities included (the value of Spearman‟s correlation - 0.92) attest to the stability of the yielded results.
4. Conclusion and discussion This work suggests the five-stage algorithm of selecting the missing data imputation method. The algorithm is based on the analysis of the impact of the missing data imputation methods upon UPTQI value with respect to those objects (cities) from the full set which have no skips whatever. To realise the algorithm, the software tool has been developed, the main functions of which are skips simulation, missing data imputation by 6 methods, and calculation of the UPTQI values. The UPTQI for 62 European cities with missing data was developed as the numerical example. 37 from them (60%) don‟t have any skips in sub-indicators values. The k-NN method was selected as the most appropriate one for imputation of missing data for the available dataset. For weights calculation the BOD method was used as the least sensitive to gaps with respect to the given set of data. For future development the following tasks are formulated: - the inclusion of some functions for analysis of the obtained results in developed software tool;
- setting requirements to the correlation between the number of objects with missing data and without. When using the suggested approach, a situation may arise implying so large number of skips in the dataset that the number of objects with missing data is insufficient to investigate some imputation methods – for instance, the cluster-based method. The article is written with the financial assistance of European Social Fund. Project Nr. 2009/0159/1DP/1.1.2.1.2/09/IPIA/VIAA/006 (The Support in Realisation of the Doctoral Programme “Telematics and Logistics” of the Transport and Telecommunication Institute)
References Cherchye L., Moesen W., Rogge N., Puyenbroeck T.(2007) An Introduction to „Benefit of the Doubt‟ Composite Indicators in: Social Indicators Research, Vol.82(1),111-145 Chen, J., Shao, J. (2000) Nearest-neighbour imputation for survey data, in: Journal of Official Statistics, Vol.16, No.2, 113–131 Gertsbakh I., Yatskiv I., Platonova O. (2008) Constructing Social and Economic Indicators for EU Countries Using Dynamic Classification: Case Studies, in: Proceeding of International Conference “Data mining 2008”, 153-162 Hermans E. (2009) Elaborating an Index Methodology for Creating an Overall Road Safety Performance Score for a Set of Countries, in: 4th IRTAD CONFERENCE, International Transport Forum Little, R.J.A.(1988), Missing Data Adjustments in Large Surveys, in: Journal of Business and Economic Statistics, Vol. 6, 287-297 Little, R.J.A. and Rubin, D.B.(2002). Statistical Analysis with Missing Data, 2nd edition, New York: John Wiley. Nardo M. (2008) Handbook on Constructing Composite Indicators: Methodology and User Guide. OECD Nicoletti G., Scarpetta S., Boylaud O. (2000) Summary indicators of product market regulation with an extension to employment protection legislation, OECD WP No.226. Peña, D. (1997) Measuring service quality by linear indicators. Managing Service Quality (Vol II). Chapman Publishing Ltd. London, 35–51 Rubin, D.B. (1987) Multiple Imputation for Nonresponse in Surveys. Wiley&Sons, N Y. Saisana M., Tarantola S. (2002) State-of-the-art Report on Current Methodologies and Practices for Composite Indicator Development, EUR 20408 EN, EС, JRC Schafer, J. (1997) Analysis of Incomplete Multivariate Data. Chapman & Hall, London Seco, A., Goncalves, J. (2007) The quality of public transport: relative importance of different performance indicators and their potential to explain modal choice, in: Urban Transport XIII: Urban Transport and Environment in the 21st Century, Vol.96,313-326 Yatskiv, I., Pticina, I. (2010a) Constructing the urban public transport system quality indicator, 1st International conference on Road and Rail Infrastructure 223-229 Yatskiv, I., Pticina, I. (2010b) The urban public transport system quality indicator for european cities. Transport and Telecommunication, Vol.11 (2). p.4-10