Maximising the (log) likelihood (log L) in restricted maximum likelihood (REML) estimation of variance components almost invariably represents a constrained ...
8th World Congress on Genetics Applied to Livestock Production, August 13-18, 2006, Belo Horizonte, Brasil
PX × AI : ALGORITHMICS FOR BETTER CONVERGENCE IN RESTRICTED MAXIMUM LIKELIHOOD ESTIMATION Karin Meyer Animal Genetics and Breeding Unit, University of New England (a joint venture with NSW Agriculture), Armidale, NSW 2351, Australia INTRODUCTION Maximising the (log) likelihood (log L) in restricted maximum likelihood (REML) estimation of variance components almost invariably represents a constrained optimisation problem. Iterative algorithms available to solve this problem differ substantially in computational resources needed, ease of implementation, sensitivity to choice of starting values and rates of convergence. One of the most widely used methods is the ‘average information’ (AI) algorithm, which “often converges in a few rounds of iteration” (Thompson et al. 2005). However, there have been some, albeit mainly anecdotal reports of the AI algorithm failing to converge, in particular for analyses involving multiple random effects, numerous traits or ‘bad’ starting values. A popular alternative are expectation-maximisation (EM) algorithms. While these are guaranteed to increase log L in each iterate, they are often painfully slow to converge. Recently, Foulley and van Dyk (2000) considered the ‘parameter expanded’ (PX) variant of the EM algorithm for mixed model REML, and demonstrated dramatically improved convergence compared to standard EM. Yet, there has been little use of the PX-EM algorithm. No comparisons between AI and PX-EM algorithms are available. This paper compares convergence rates of standard EM, PX-EM and AI algorithms for some practical examples of analyses of beef cattle data. ALGORITHMS Average Information. In essence, the AI algorithm is a modified Newton-Raphson procedure, replacing second derivatives of log L with the average of their observed and expected values. Like other second order algorithms, it is expected to have quadratic convergence, but it shares their drawbacks. Firstly, estimates are not constrained to the parameter space. This can be overcome by an appropriate parameterisation, e.g. by estimating the elements of the Cholesky factor of a covariance matrix rather than the covariances, often teamed with a log transformation of the diagonal elements (Pinheiro and Bates 1996). Secondly, log L is not guaranteed to increase. While the AI matrix is generally positive definite, which should yield an increase in log L, it is prone to ‘overshooting’, which can yield a decrease. Often step size modification are necessary to ensure log L attains a maximum. Typically, these require additional computations. Expectation-Maximisation. On the other hand, EM type algorithms generally have monotone convergence, i.e. log L increases in each iterate, and yield estimates of covariance components within the parameter space. Moreover, they are easier to implement and require less memory than corresponding AI algorithms. However, EM algorithms utilise information from first derivatives of the likelihood only, and thus are expected to converge linearly. This can be very slow, and may require many rounds of iteration. This behaviour has motivated numerous attempts to speed up convergence. Modifications suggested include simple predictions of future values from estimates in previous iterates, such as ’accelerated EM’ (Laird et al. 1987), Quasi-Newton type schemes, and generalised EM algorithms; see Meng and Van Dyk (1997) for a review.
Session 24. Advances in Statistical Genetics
Communication N o 24-00
8th World Congress on Genetics Applied to Livestock Production, August 13-18, 2006, Belo Horizonte, Brasil
Parameter expansion. Probably the most interesting among the new, ‘fast’ EM procedures is the PX-EM algorithm proposed by Liu et al. (1998). Consider the standard linear, mixed model y = Xβ + Zu + e
with
Var (u) = Σ ⊗ A
(1)
where y, β, u and e are the vectors of observations, fixed effects, random effects and residuals, respectively, X and Z denote the corresponding incidence matrices, and Σ is the matrix of covariances between random effects to be estimated. For PX-EM, rewrite (Eq. 1) as � y = Xβ + Z (I ⊗ α) u? + e with Var u? = Σ∗ ⊗ A (2) The elements of Σ∗ are then estimated assuming α = I, i.e. as for standard EM. In addition, we estimate the elements of α. If there are q traits (or random regression coefficients), there are up to q2 additional parameters. Estimators are obtained in standard fashion, equating first derivatives of the expectation of the complete data likelihood of y (assuming β and u are known) with respect to the elements of α to zero, and solving the resulting system of equations; see Foulley and van Dyk (2000) for details. Estimates of Σ are then obtained applying the reduction function Σ = αΣ∗ α0 . Finally, residual covariances are estimated as in standard EM, but adjusting for the current estimate of α , I in calculating residuals, i.e. using e = y − Xβ − Z (α ˆ ⊗ I) u? . For most algorithms, computational requirements of REML estimation increase with the number of parameters, both per iterate and overall. Hence, it seems counter-intuitive to expand their number. Loosely speaking, the efficacy of PX-EM can be attributed to the extra parameters capturing ‘information’ which is not utilised in EM. In each iterate, we treat the current parameter values as if they maximised log L. Hence, away from the maximum, the expectation of the complete likelihood is computed with error. The deviation of α ˆ from I gives a measure of the error. Adjusting estimates of Σ for α ˆ then can be thought of as regressing estimates on the difference between α ˆ and its assumed value of I in standard EM (Liu et al. 1998). MATERIAL AND METHODS Data. Three examples of animal model analyses of beef cattle data were considered (Table 1). Case A (Meyer and Kirkpatrick 2005) comprised 4 live ultra-sound scanning measures, treating records on males and females as different traits. This yielded an eight-variate analysis, fitting a simple animal model and, with zero residual covariances between sexes, 56 parameters. For case B, birth, weaning and yearling weights for cattle in a large herd were analysed together, fitting genetic and permanent environmental (PE) Table 1. Characteristics of examples maternal effects for all three traits. Finally, case C (Meyer et al. 2004) involved 2 traits, mature Number of cow weight and gestation length. With repeated Traits Records Anim.s Equat.s RE Par.s records for trait 1, a PE effect of the animal was fitted as random effect (RE). Trait 2 was consid- A 8 20 171 8 044 65 030 1 56 ered a trait of the calf, affected by both PE and B 3 10 479 6 247 31 252 3 24 9 genetic effects of the dam. This gave 4 REs in the C 2 32 303 66 169 197 040 4 model and 9 covariances to be estimated. Analyses. REML estimates of variance components were obtained employing AI, EM, PXEM and a combination of PX-EM and AI (PX×AI) algorithms for the same starting values. AI was reparameterised to the elements of the Cholesky factors of the covariance matrices to Session 24. Advances in Statistical Genetics
Communication N o 24-00
8th World Congress on Genetics Applied to Livestock Production, August 13-18, 2006, Belo Horizonte, Brasil
Table 2. Convergence characteristics (brackets denote failure to converge) Case A log L
Start EM
0 20 50 100 500 20 50 100 500
PX-EM
No. of iterates
AI log a b c
PX×AI
Case B
Case C
‘Good’
‘Bad’
‘Good’
‘Bad’
‘Good’
‘Bad’
-391.82 -18.29 -14.92 -11.16 – -3.71 -2.10 -2.03 – 12 13 2+6 4+6 6+5
-3406.69 -89.02 -74.82 -58.49 – -5.73 -2.21 -2.02 – (10) (24) 2+7 4+7 6+6
-2218.65 -46.31 -30.99 -16.76 -6.50 -12.46 -7.33 -3.56 -0.43 (2) (12) 3+7 5+8 –
-6261.90 -91.34 -64.42 -36.14 -3.68 -32.63 -19.85 -10.36 -1.37 42 (8) 3+9 5+7 –
-39.20 -1.15 -0.92
-2656.59 -80.39 -48.21
– -1.53 -1.43
– -4.13 -1.46 -0.95 – (36)
– (4)
be estimated, and AI-log took logarithmic values of the diagonal elements in addition. Both enforced an increase in log L at each step. The PX×AI algorithm involved a small number (2–6) of PX-EM iterates, followed by AI. “Good” and “bad” starting values were considered for each case. All computations were carried out using our REML program WOMBAT (Meyer 2006).
0
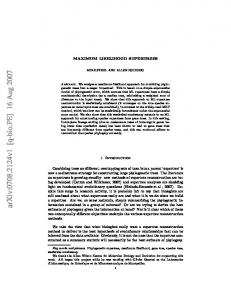
RESULTS AND DISCUSSION Numbers of iterates required for the AI based, and values of log L (as deviations from the maximum) for the EM type algorithms at selected iterates are given in Table 2. Changes in log L for early iterates are shown in Figures 1 and 2 for cases B and C, respectively. Overall, results confirmed the slow convergence rates of the EM type algorithms. Performance of the PX-EM algorithm in the first few iterates was generally at least as good as that of the AI algorithm, and substantially better if AI (or AI-log) struggled to improve log L. However, for later iterates, PXEM shared the slow convergence of standard EM, its advantage over EM predominantely due ●
●
●
● ●
● ●
● ●
● ●
● ●
● ●
● ●
● ●
● ●
● ●
● ●
● ●
● ●
● ●
● ●
● ● ●
●
●
●
●
●
●
●
●
●
●
●
●
●
●
●
●
●
●
●
●
●
●
●
●
●
●
●
●
●
●
●
●
●
●
6
8
10
●
4
●
6
8
10
●
●
●
●
●
●
●
● ●
−20
●
●
●
● ● ●
●
−10
●
● ●
● ●
● ●
−30
●
−30
−300
−20
●
−10
log L −200
●
0
4
0
−100
● ● ●
●
● ●
1
2
3
4
5
7
9
12
Iterate
15
18
1
2
3
4
5
●
7
9
12
15
18
Iterate
Figure 1. Early iterates for case A for good (left) and bad (right) starting values, using AI (O), AI-log (H), EM (◦), PX-EM (•), and PX-AI (N) algorithms (inset : iterates 3–10 enlarged).
Session 24. Advances in Statistical Genetics
Communication N o 24-00
0
8th World Congress on Genetics Applied to Livestock Production, August 13-18, 2006, Belo Horizonte, Brasil
●
●
●
●
●
●
●
●
●
●
●
●
●
●
●
●
●
●
●
●
●
●
●
●
●
●
●
●
●
●
●
●
●
●
●
●
●
log L −100
●
●
●
●
●
●
●
●
●
●
●
●
●
●
●
●
●
●
●
●
●
●
●
●
●
●
●
●
●
●
●
●
● ● ●
●
●
●
−200
●
1
2
3
4
5
7
9
12
15
18
1
2
Iterate
●
3
4
5
7
9
12
15
18
Iterate
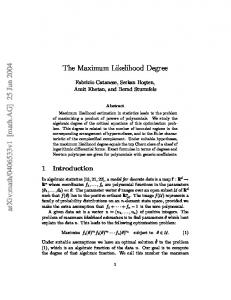
Figure 2. Early iterates for case B (as Figure 1 otherwise). to its performance in the first few steps. Convergence of PX-EM in later iterates might be improved by applying an acceleration technique. The AI algorithm was found to be fairly sensitive to starting values and choices involved. In terms of parameterisation, AI-log was less affected by convergence problems at the boundary of the parameter space than AI, but tended to require more iterates. Step size modifications were usually chosen to increase log L as much as possible in a given step, but enforcing just an increase often worked just as well and required less computations. No indicators as to which strategy was less likely to ‘get stuck’ somewhere below the maximum could be identified. Clearly, case C represented a model where the shape of the likelihood surface was not conducive to the AI algorithm. Combining a few, initial iterates of PX-EM with AI in subsequent iterates proved highly effective. In most instances, the PX-EM algorithm yielded ‘starting points’ for AI sufficiently close to the maximum of log L so that AI converged rapidly, even if AI (or AI-log) for the same starting values had failed. Results indicate that the PX×AI algorithm would be advantageous for routine REML estimation. A similar, but unsubstantiated suggestion has been made by Thompson et al. (2005). While no ’cure-all’, the PX×AI algorithm seemed especially useful for reducing computational demands of analyses involving many traits or multiple random effects. CONCLUSIONS More reliable and often faster convergence of REML estimation can be achieved by combining algorithms : Exploit the stability and good performance of the PX-EM algorithm in the first few iterates, then switch to the AI algorithm with rapid convergence close to the maximum of log L. REFERENCES Foulley, J. L. and van Dyk, D. A. (2000) Genet. Select. Evol. 32:143–163. Laird, N., Lange, N. and Stram, D. (1987) J. Amer. Stat. Ass. 82:97–105. Liu, C., Rubin, D. B. and Wu, Y. N. (1998) Biometrika 85:755–770. Meng, X.-L. and Van Dyk, D. (1997) J. Roy. Stat. Soc. B 59:511–567. Meyer, K. (2006) Proc. Eigth World Congr. Genet. Appl. Livest. Prod. Comm. No. 27–00. Meyer, K., Johnston, D. J. and Graser, H.-U. (2004) Austr. J. Agric. Res. 55:195–210. Meyer, K. and Kirkpatrick, M. (2005) Genet. Select. Evol. 37:1–30. Pinheiro, J. C. and Bates, D. M. (1996) Stat. Comp. 6:289–296. Thompson, R., Brotherstone, S. and White, I. M. S. (2005) Phil. Trans. R. Soc. B 360:1469–1477. ACKNOWLEDGEMENTS This work was supported by Meat and Livestock Australia (www.mla.com.au) and the International Livestock Resources and Information Centre (www.ilric.com).
Session 24. Advances in Statistical Genetics
Communication N o 24-00