Freescale Semiconductor Assignee toInternational SEMATECH, Austin, TX 78741. ABSTRACT. In order to find new immersion liquids to improve the resolution ...
Amplification of the Index of Refraction of Aqueous Immersion Fluids by Ionic Surfactants Kwangjoo Leea, Joy Kunjappua, Steffen Jockuscha, Nicholas J. Turro*a, Tatjana Widerschpanb, Jianming Zhouc, Bruce W. Smithc, Paul Zimmerman d, Will Conley* e a
Department of Chemistry, Columbia University, New York, NY 10027; Lehrstuhl fuer Umweltmesstechnik, Universitaet Karlsruhe, Germany; c Microelectronic Engineering Dept, Rochester Institute of Tech, Rochester, NY 14623 d Intel Assignee to International SEMATECH, Austin, TX 78741 e Freescale Semiconductor Assignee to International SEMATECH, Austin, TX 78741 b
ABSTRACT In order to find new immersion liquids to improve the resolution of 193 nm immersion photolithography, we have attempted to discover aqueous system possessing an index of refraction greater than that of water using aqueous surfactant systems. The index of refraction (RI) of both cationic and anionic surfactant systems were examined in the presence of wide range of inorganic salts, and parameters such as size of surfactants, concentrations, and temperature were varied. The refractive index (RI) was found to be increased in the presence of both anionic and cationic surfactants compared to those of water and also increased as a function of surfactant concentration. However the refractive index tends to increase much more strongly as a function of salt concentration. In our study, a maximum RI enhancement was observed from 6.5 M CdCl2 in 8.2 mM aqueous SDS solution. The effect of micellar properties such as the critical micelle concentration (cmc) and degree of ionization were systematically studied for aqueous SDS system in the presence of CdCl2. The correlation on index of refraction between empirical data and theoretical prediction were performed using the concept of molar refraction. Wavelength dependence of RI from theoretical prediction based on empirical equation was examined for various concentration of CdCl2 system and the results are reported in the paper. Subject terms: index of refraction, immersion photolithography, ionic surfactants, 193 nm, SDS, CTAC, CdCl2 1. Introduction Recently, optical lithography has been incrementally marching toward dimensions less than 45 nm. The wavelength has been reduced to 193-nm and 157-nm lithography using F2 laser was studied tentatively for the next generation of lithography. We have been studying the mechanism of the photodegradation that leads to darkening of polymer pellicles during exposure to 157 nm radiations in order to design new soft pellicle systems that possess acceptable characteristics for 157 nm photolithography.1
Advances in Resist Technology and Processing XXII, edited by John L. Sturtevant, Proceedings of SPIE Vol. 5753 (SPIE, Bellingham, WA, 2005) 0277-786X/05/$15 · doi: 10.1117/12.606105
537
The use of immersion fluids in optics has been known for more than 150 years, and immersion technique for use in lithography for industry appeared more recently.2 Immersion lithography uses fluid that is index matched to the photoresist that fills the area between the lens and the wafer. As the challenges of shorter wavelength (157 nm) become increasingly difficult, usage of immersion based lithography systems becomes more highlighted. The resolution in optical lithography is governed by the following formula.3 NA = n sin θ, where NA is the numerical aperture of optical system, n is the refractive index of the medium, and θ is the maximum incident angle, Depth of focus (DOF) is approximately given by DOF = k2 nλ / (NA2) = k2 λ / n sin2 θ where k2 is the resolution coefficient, λ is the wavelength in air. Therefore, the depth of focus (DOF), which controls the resolution limit of the optical exposure system, can be improved not only by decreasing the wavelength λ but also by increasing the refractive index of the medium. Therefore, in order to increase the depth of focus (DOF) at current 193 nm photolithography systems, there is a need to develop new immersion fluids that have a higher refractive index than water with acceptable transparency at 193 nm since water is known as the best fluid for 193 nm immersion systems so far.4 The goals of the research reported here are the discovery of aqueous systems possessing an index of refraction substantially greater than that of water at 193 nm and acceptable transparency at 193 nm and compatibility with pertinent photoresist systems employed at 193 nm.4 Our initial investigation was performed with aqueous surfactant system because there are some potential benefits we could achieve by using surfactant systems. These are: (1) Surfactants can be used in aqueous system which has the highest index of refraction and optical property so far, (2) Resists for 193 nm are known to be compatible with the surfactant systems to be investigated, (3) Surfactant micelles can scavenge materials leached from the resist and keep them dispersed and prevent redeposit of materials and formation of defects on the resist, (4) The proposed systems have established photostability and good environmental characteristics, (5) The proposed systems will allow a wide variation of structural modifications employing inexpensive, commercially available materials. One of the fundamental characteristics of a surfactant is its ability to form micelles. The concentration above which aggregation occurs is the critical micelle concentration (cmc). Both anionic and cationic surfactants form micelles in aqueous solution above cmc. Anionic micelles possess a surface which is charge compensated by 538
Proc. of SPIE Vol. 5753
cations. For example in the sodium dodecyl sulfate (SDS), which is the one of benchmark micelles for anionic surfactants, the sodium ion will be replaced by cations that will be expected to increase the index of refraction significantly. Cationic micelles possess a surface that is charge compensated by anions. In the case of cetyltrimethylammonium chloride (CTAC), the negatively charged chlorine ion may be exchanged for a variety of anions that will be expected to increase the index of refraction significantly. The structure of the charge compensating cations and anions can be varied over a wide range. Herein we report that the effect of ionic surfactants on the refractive index. A wide range of surfactant structures was considered. Anioic surfactants such as sodium dodecyl sulfate (SDS, 1), sodium decyl sulfate (2), and sodium tetradecyl sulfate (3) and cationic surfactants such as cetyl trimethyl ammonium chloride (CTAC, 4), and cetyltrimethylammonium bromide (CTAB, 5) (shown in Scheme 1) were finally selected based on the ease of their availability and previous knowledge of their micellar properties in the literature. Index of refraction of aqueous alkyl sulfate surfactant solutions was found to increase at higher surfactant concentration, lower temperature, and lower number of carbon atoms in the alkyl chain. Especially, index of refraction of these aqueous alkyl sulfate surfactants solutions is increased by a significant degree by adding inorganic salts such as CdCl2.
Scheme 1. Structure of anionic and cationic surfactant. 2. Experimental 2.1 Chemicals. Sodium dodecyl sulfate (SDS), cetyltrimethylammonium chloride (CTAC) was purchased from Fluka. Sodium decyl sulfate was purchased from Kodak. Calcium chloride was obtained from Fisher. Holmium (III) chloride hexahydrate (HoCl3.6H2O), Lithium chloride (LiCl), Neodymium chloride hexahydrate (NdCl3. 6H2O), Rubidium chloride (RbCl), and Samarium chloride were purchased from Alfa Chemicals. Mercury (II) chloride (HgCl2), Rubidium nitrate (RbNO3), and Silicon (IV) chloride (SiCl4) were obtained from Acros. All other reagents including inorganic salts were obtained from Aldrich and used as received, unless noted otherwise.
Proc. of SPIE Vol. 5753
539
2.2 Spectroscopic Characterization. Spectroscopic characterization was performed with the neat samples. UV-Vis spectra were recorded using a Shimadzu UV-2401PC UV-Vis spectrophotometer. For the exploratory studies the index of refraction was measured with Abbe refractometer using white light, corrected to the NaD (589 nm) and the index of refraction at 193 nm was determined at Rochester Institute of Technology (RIT) with a modified Variable Angle Spectroscopic Ellipsometer (VASE, by J. A. Woollam Inc. U.S.A.).5 The ellipsometer has precise (0.044mRad) goniometer and a prism fluid cell with nominal apex angle of 45o was mounted onto the sample stage. Fluorescence spectra were recorded on a SPEX FluoroMax 2 spectrofluorometer using pyrene as the fluorescence probe to determine the cmc of surfactant in the presence or absence of inorganic salt.
3. Results and Discussion 3.1 Effect of the anionic surfactant SDS on the refractive index To investigate if surfactant molecules can increase the refractive index of an aqueous solution, the refractive indexes of aqueous SDS solutions at various concentrations (0 mM to 800 mM SDS) were determined using an Abbe refractometer. Figure 1 shows a linear increase of the refractive index with increasing SDS concentration. At a SDS concentration of 800 mM the refractive index increased to 1.359 (from 1.332 in pure water). 1.360
1.355
RI
1.350
1.345
1.340
1.335
water 1.330 0
100
200
300
400
500
600
700
800
[SDS], mM
Figure 1. The refractive index of various concentrations of aqueous SDS solution 3.2 The Effect of Additives on the Refractive Index of Aqueous Surfactant Solutions. The addition of additives to micellar solutions often causes a change in micelle size, shape, and critical micelle concentration (minimum concentration of surfactants to form micelles) 6 E.g., addition of inorganic salts (electrolytes) generally increases the size of the micelle, increases the aggregation number (number of surfactant molecules in one micelle) and decreases the critical micelle concentration.7 In order to investigate the effect of added inorganic salts to aqueous SDS solutions on the refractive index, more 540
Proc. of SPIE Vol. 5753
than 30 inorganic salts were studied. For this study a SDS concentration of 8.2 mM was selected, because it corresponds to the critical micelle concentration of SDS in pure water.6, 8 Initially, the refractive indexes after addition of more than 30 different inorganic salts at concentrations of 0.1 M were determined in the presence and absence of SDS (8.2 mM). The results of selected salts, which showed the highest refractive indices, are shown in Figure 2. Other salts, which were investigated were: NbCl5, CeCl3, Ba(SCN)2, NdCl3, KI, Gd(NO3)3, RbNO3, SiCl4, TbCl3, CdNO3, HoCl3, LuCl3, TaCl5, PbCl2, GdCl3, TlF, TlI, EuCl3, SmCl3. However, these salts showed only little refractive index enhancement or had poor solubility. SDS solutions containing RuCl3 at 0.1M showed the highest refractive index (1.3365). No simple correlation, such as the ionic radii of the different cations, seams to govern the enhancement of the refractive index by salts. In all investigated systems, the refractive indexes are higher in the presence of 8.2 mM SDS than without SDS (Figure 2). 1.337
Water
1.336
RI
SDS 8.2 mM 1.335
1.334
1.333
water Rb (+1)
Rh (+3)
Cs (+1)
La (+3)
Pr (+3)
Cd (+2)
2
Mn (+2)
Hg (+2)
l2 HgCl
K (+1)
3
Mg (+2)
CdC
Na (+1)
3
Li (+1)
PrCl
No sa
No Salt
LaC l
lt LiC l Na Cl Mg Cl 2 KC l Mn Cl 2 Rb C l3 Rh C l3 C sC l
1.332
Salt
Figure 2. The RI of water (blue) and 8.2 mM SDS aqueous solution (red) in the absence and presence of 0.1 M salts at 589 nm at 25 oC. The refractive index of aqueous SDS solution increased by a significant degree by adding more salts until it reaches their solubility limit. SDS solutions (8.2 mM) were saturated with the different inorganic salts and the refractive indexes were determined. Figure 3 shows the systems with the highest refractive indexes at their saturation concentration in water. The refractive indices of 6.5 M CdCl2 show the highest values among the investigated salts both in water and in 8.2 mM aqueous solution and were found to be 1.4400 and 1.4427 respectively at 589 nm. Therefore, CdCl2 was selected for further studied as a potential candidate for immersion lithography.
Proc. of SPIE Vol. 5753
541
1.4700
RI
1.4200
1.3700 water
w at er
1.3200
Figure 3. The refractive index of selected salts at their saturation concentration in water at 589 nm at 25 oC 3.3 Effect of CdCl2 on the Micellar Properties. The influence of the surfactant concentration on the RI in aqueous solutions in the absence and presence of 0.1 M of CdCl2 is shown in Figure 4. Both functions, in the absence and presence of CdCl2, showed a linear increase of the RI with increasing SDS concentration. Furthermore, the RI in the presence of CdCl2 is higher than in the absence of CdCl2. Because both functions, in the absence and presence of CdCl2, are parallel, it suggests that a simple additive effect of the RI enhancement by SDS and by CdCl2 is dominating (Figure 4).
1.365
SDS + 0.1 M CeCl CdCl32
1.360 1.355
RI (n)
1.350 1.345
SDS only
1.340 1.335 1.330 0
100
200
300
400
500
600
700
800
[SDS], mM
Figure 4. The index of refraction as a function of concentration of SDS in the absence and presence of 0.1 M CdCl2 at 589 nm at 25 oC.
542
Proc. of SPIE Vol. 5753
(b)
1.44 1.42 1.40 RI
(a)
1.38 1.36 1.34 0
1
2
3 4 [CdCl2], mM
5
6
Figure 5. The refractive index as a function of CdCl2 concentration (a) in water (black, dot line), and (b) in 8.2 mM SDS (red, solid line) at 589 nm at 25 oC Figure 5 shows the dependence of the RI on the concentration of CdCl2 in pure water (a) and in 8 mM SDS solutions (b). An increase in the concentration of CdCl2 causes a strong increase of the refractive index. The presence of a small amount of surfactant ([SDS] = 8.2 mM) (Figure 5, b) causes only a minor increase of RI (< 0.0020) compared to solutions in the absence of SDS (a). The refractive index is known to be sensitive to the change of the micelle 7 structure of the solution. In order to determine the changes of the micellar properties of SDS micelles, such as cmc, aggregation number, degree of counterion binding in the presence of various concentration of CdCl2 in SDS solution, experiments were performed using pyrene as fluorescence probe.9-11 The vibronic fine structure of the pyrene fluorescence depends strongly on the polarity of the environment (Figure 6). The ratio between the intensities of the third (I3) and the first (I1) fluorescence peaks of pyrene is commonly used as the polarity probe. 9 The nonpolar pyrene molecules are only soluble in the polar water in a small amount (~10-7 M). If a surfactant, such as SDS is added to water, micelles are formed at the critical micelle concentration (cmc). Because the nonpolar pyrene has a much stronger affinity to the nonpolar environment inside the micelles compared to the polar environment of the bulk water, the pyrene molecules will be located inside the micelles. This changes the ratio between the third (I3) and the first (I1) fluorescence peaks (Figure 6).
Proc. of SPIE Vol. 5753
543
SDS micelle
pyrene in water I1 I3 I3/I1 H2O ~ 0.55
pyrene in micelle I1 I3 I3/I1 micelle ~ 1
200
3
3
20
x10
intensity
150
x10
intensity
30
100
10 50
0
0 360
380
400
λ (nm)
420
360
440
380
400
420
440
λ (nm)
Figure 6. Fluorescence spectra of pyrene (λex = 337 nm) before and after forming micelles 1.1
I3/I1
1.0 0.9 0.8 0.7 0.6 0.5 0
1
2
3
4
[SDS]
Figure 7. Vibronic fine (I3/I1) structure of the pyrene fluorescence as a function of SDS concentration at various concentrations of CdCl2: 0.05 M CdCl2 (red), 0.1 M CdCl2 (blue), 0.2 M CdCl2 (orange), 0.5 M CdCl2 (green), 1.0 M CdCl2 (purple). The cmc of SDS solutions decreased gradually after addition of CdCl2 from 8.2 mM ([CdCl2] = 0 mM), to 1.0 mM ([CdCl2] = 0.1 mM), to 0.6 mM ([CdCl2] = 0.5 mM), and to 0.4 mM ([CdCl2] = 1.0 mM). It is known that in pure SDS micelles (without additives) approximately 70 % of the cations are located in the inner Stern layer and 30% of the cations are located in the Gouy-Chapman double layer.12, 13 The heavy metal salt CdCl2 is expected to change the extent of counterion binding. The degree of counterion binding in the presence of CdCl2 was determined based on the Corrin-Harkins equation from the slop of ln{cmc +[CdCl2]} 544
Proc. of SPIE Vol. 5753
vs. ln [cmc] (Figure 7).14, 15 The fit reveals that in the presence of CdCl2, approximately 58 % of Cd2+ ions are bound to the anion of SDS in the inner Stern layer and 42% of the cations are located in the Gouy-Chapman double layer. The size of the double layer is compressed due to ionic strength effect. A schematic description of degree of counter ion binding is shown in Figure 8.
Cd 2+ Cd 2+
Stern layer
0
ln[cmc]
Cd 2+
slope = -0.58
-2
Cd 2+
Cd 2+
-4
Cd 2+ -6 -8 -4
-3 -2 ln{cmc+[CdCl2]}
-1
Cd 2+
0
Cd2+
Cd 2+ Cd
2+
Gouy-Chapman layer
Figure 8. The degree of binding SDS in the presence of CdCl2 and its schematic description 3.4 Effect of SDS Concentration, Temperature and size of Chain. In order to understand the effect of temperature on the refractive index, the refractive index of aqueous SDS solution was monitored at 0oC, 15oC, 25oC, and 35oC and the results are shown in Figure 9. The refractive index increased to a small degree at lower temperatures. However, the increase of RI with decreasing temperatures is only minor. Likewise, increase in no significant refractive index was observed when the chain lengths of alkyl sulfates were varied from 10 (2), 12 (1), and 14 (3). 1.344
35oC 35 oC
oC 25oC 25
15oC 15 oC
oC 00oC
1.34
RI 1.336
1.332 No Salt No Salt
CsCl
CsCl
CdCl2 CdCl 2
Figure 9. The temperature effect on the refractive index Proc. of SPIE Vol. 5753
545
1.344
1.34
RI 1.336
1.332 10
1.328 14
No Salt
12 Number of carbon chain
CsCl Salt
CdCl2
Figure 10. The effect of size of the carbon chain on the refractive index (The solutions were prepared at their cmc and RIs were measured at 25 oC. CMC of alkyl sulfate surfactants are 33 mM for sodium decyl sulfate, 8.2 mM for sodium dodecyl sulfate, and 2.1 mM for sodium tetradecyl sulfate respectively) The solutions of alkyl sulfate compounds 1, 2, and 3 were prepared at their critical micellar concentration in order to compare the effect of the size of alkyl chain on the refractive index. No significant RI dependence was monitored from the results when we consider that the concentration of sodium decyl sulfate is much higher than that of the other two alkyl sulfates 1 and 3. 3.5 The effect of cationic surfactant CTAC on refractive index The cationic surfactant CTAC was also investigated. The cmc of CTAC was determined using pyrene as a probe as described above. The cmc of CTAC was determined as 1.3 mM, which is in good agreement with published values.8 The refractive index of CTAC was determined at various concentrations of CTAC (Figure 11b). The molar enhancement of RI by CTAC (slope b) is slightly higher than for SDS (slope a). However, the maximum solubility of CTAC is only ~ 450 mM compared to SDS (> 800 mM).
546
Proc. of SPIE Vol. 5753
1.365
(b)
1.360 1.355
RI
1.350
(a)
1.345 1.340 1.335 1.330 0
100
200
300
400
500
600
700
800
[surfactant], mM
Figure 11. The refractive index of various concentrations of aqueous CTAC solutions of SDS at 589 nm at 25 oC. In order to find a candidate anion which can increase the refractive index of aqueous CTAC solution significantly, several salts were tested: NaIO4, NaClO4, KClO4, KCNO, KCNS, LiClO4, MnClO8, K2[CoFe(CN)6], Na3MO12PO40, (NH4)6MO2O24 etc. These salts were selected because all these salts have a heavy anion, which has the potential to increase the RI significantly. However, most of these salts have a pure solubility in water and CTAC solutions. The RI of the 0.1 M of salts, which showed acceptable solubility, are shown in Figure 12.
Figure 12. The RI of 0.1 M of heavy salts in the water and 1.58 mM CTAC solution at 589 nm at 25 oC. 3.6 RI prediction based on Molar Refraction In this study, we have applied the theoretical prediction of molar refraction in order to identify the good candidate of salt system which has high refractive index.
Proc. of SPIE Vol. 5753
547
From Maxwell’s electromagnetic theory, and the wave theory of light, it was found that n2 - 1 1 2 ρ n +2 (specific refraction) is a constant for a substance the term
(n = index of refraction, and ρ = density). This term was generalized using the mole concept, and molar refraction was defined as, n2 −1 M , where M = molar mass. [ Rm ] = 2 n + 2 ρ This parameter is fairly a constant and independent of temperature. Moreover, it is applicable to any phase of the substance.
Molar refraction was shown to be an additive property, with specific contributions from the constituent atoms and bonds in a molecule, with the result that it was possible to assign definite numbers to an atom, group, or bond as is done for molar enthalpy. Conversely, structural identity of a compound could be ascertained using individual molar refraction values for atoms, groups and bonds. Molar refraction was a very powerful structure elucidation tool in the hands of organic chemists, which was superseded by the much more versatile optical, magnetic, and mass spectroscopic methods with the turn of the last century. It is thus possible to compute the index of refraction of a substance knowing its molar refraction, molar mass, and density from the rearranged equation, V + 2 Rm M n2 = m , where Vm = . Both Vm and Rm have the same unit of cm 3 mol −1 . Vm − R m ρ
Mixtures of substances also obey the molar refraction principle, which may be expressed as, n 2 − 1 x1 M 1 + x 2 M 2 [ Rm ]1, 2 = 2m ρm nm + 2 where x1 and x2 are the mole fractions of the components 1 and 2, M 1 and M 2 their molar masses, nm , the index of refraction of the mixture, and ρ m the density of the mixture. [ Rm ]1, 2 is also shown to be the sum of the contributions of the individual constituents, as given by, [ Rm ]1, 2 = x1 [ Rm ]1 + x 2 [ Rm ]2
where [ Rm ]1 and [ Rm ] 2 are the molar refractions of the individual components. These relationships enable us to predict the index of refraction of a substance from the molar refractions of the individual components in a mixture. As a demonstration, the predicted and experimental values of molar refraction for a LiCl solution with a mole fraction of 0.01493 in water are 3.7821 and 3.7814, respectively.16 Molar Refraction ( cm 3 mol −1 ) Ion + 0.12 Li 548
Proc. of SPIE Vol. 5753
Cl8.22 3 −1 For LiCl, Rm = 8.34 cm mol and for water, Rm = 3.7131 cm 3 mol −1 . [ Rm ] LiCl , H 2O = (0.01493 × 8.34) + (0.98507 × 3.7131) = 3.7821 This demonstration helps us predict the index of refraction of salt solutions at any concentration (subject to limitation of solubility), enabling the proper choice of media for tuning the index of refraction to any desired value using salts.
In our work, we used these concepts in the system of CdCl2 and there was a good agreement between the theoretically predicted values of molar refraction of salt solutions and the values calculated using experimentally determined numbers of index of refraction and densities of these solutions. This is shown in Figure 13. This served us justify the selection of salt candidates to provide aqueous solutions in the useful range of index of refraction, guided by other factors such as solubility and availability. Figure 13. The molar refraction Rm obtained from theory (blue square) and from the experiment (red square) 5.5
Theory
5.0
Rm 4.5 4.0
Experiment 3.5 0
20
40 x10
-3
60
80
[CdCl2], M
3.7 Wavelength Dependence of RI from Theoretical Prediction based on an Empirical Equation Let us go down to basics to build sufficient grounds to appreciate the wavelength dependence of index of refraction. The phenomenon of refraction happens because the velocity of light changes in different media. Index of refraction is a quantitative representation of this effect. When a light beam of velocity v1 in medium 1 is incident at the interface with a second medium 2 at an angle θ1 with the normal, refracting to the second medium with a velocity v2 and angle of refraction θ2, the tangential component of the incident and refracted rays along the plane of the interface will be equal: Proc. of SPIE Vol. 5753
549
v1sinθ1 = v2sinθ2 v1 v2
=
sinθ1 sinθ2
= n
Assuming medium 1 is vacuum, we get
v1 = νλ where ν is the frequency and λ the wavelength. Similarly, we also have, v 2 = νλ' where λ' is the wavelength in the second medium, and ν is the same as for the incident beam. v λ λ ∴n = 1 = ' or λ' = v2 λ n So we have a relation to calculate the wavelength in one medium if the index of refraction of the medium is known. However, the index of refraction depends on the wavelength itself. Thus we can tap a different wavelength by passing light of one wavelength through a second medium. In a vacuum, v is the same for all the colors. But in a medium such as water, blue light travels more slowly than red light. The dispersion of white light in a glass prism is a direct manifestation of the wavelength dependence of the velocity of light in a medium other than vacuum. Since we are interested in the index of refraction of aqueous salt solutions, the following information from literature will be useful. There are several reported attempts in the literature to develop empirical equations that yield the index of refraction of water as a function of several parameters such as temperature, salt concentration and wavelength.17-20 In one attempt, the variation of index of refraction at 25oC was expressed as, n(λ ) = 1.31279 + 15.762λ−1 − 4382λ−2 + 1.1455 × 10 6 λ−3 n2 −1 1 , was empirically modeled as,21 Lorentz-Lorenz function (LL), which is 2 n + 2 ρ 552.261 852.502 311354 + 2 + 2 LL = 0.233225 + 8.35872 × 10 −10 λ2 + 2 λ λ − 18225.0 λ − 1.02400 × 10 7
The most extensive empirical relation for computing the index of refraction comprising the variation in wavelength, salt concentration, and temperature has been provided by Quan and Fry, which is expressed as,
550
Proc. of SPIE Vol. 5753
n(S, T, λ) = n0 +(n1 + n2T + n3T2)S + n4T2 +
n5 + n6S + n7T n8 n9 + 2 + 3 λ λ λ
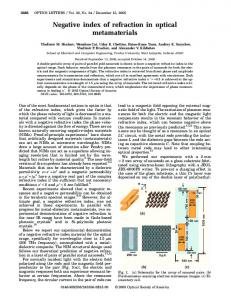
where coefficients n: n0 = 1.31405, n1 = 1.779 x 10⁻⁴, n2 = - 1.05 x 10⁻⁶, n3 = 1.6 x 10⁻⁸, n4 = - 2.02 x 10⁻⁶, n5 = 15.868, n6 = 0.01155 n7 = - 0.00423, n8 = - 4382, n9 = 1.1455 x 10⁶ We used this equation to project the index of refraction at 193 nm at different salt concentrations. This enables us to estimate the index of refraction easily without recourse to experimentation, which helps in scanning the probable values to suit the needs of a particular situation. Based on the empirical equation for the index of refraction, wavelength dependence of RIs of CdCl2 solutions from theory is predicted and shown in Figure 14. The index of refraction at 193 nm for CdCl2 system was determined at RIT. This finding is in good agreement with experimental data on the same system5 and it is shown in Figure 15.
Proc. of SPIE Vol. 5753
551
248 nm 1.65
(a) (b) (c)
1.60
RI
1.55 1.50 1.45 1.40 1.35 200
300
400 500 Wavelenth (nm)
600
Figure 15. The refractive index of 6.0 M of CdCl2 measured at various wavelengths: (a) blue dot line, calculated, (b) red solid line, in water, and (c) green dot line, in 8.2 mM SDS solution CONCLUSION Cationic and anionic surfactant systems were examined to find out whether there is a significant enhancement on refractive index for immersion lithography. The refractive index was found to be increase as a function of surfactant concentration. The refractive index tends to increase much more significantly as a function of salt concentration in the aqueous SDS system. A maximum RI enhancement was observed from 6.5 M CdCl2 in 8.2 mM aqueous SDS solution. Wavelength dependence of RI from theoretical prediction based on empirical equation was good agreement with our data measured at RIT for CdCl2 system. In order to find good candidates for immersion fluids at 193 nm, light scattering properties and transparency of the solution are currently studies in our laboratory. Acknowledgements: The authors thank SEMATECH International for the generous financial support of this work. REFERENCES
1.
2. 3. 4.
5.
552
K. Lee et al., “ 157 nm pellicles for photolithography: mechanistic investigation of the deep UV photolysis of fluorocarbons.” Proc. of SPIE 5377,1598 (2004). J. Mulkens et al., “Benefits and limitations of immersion lithography”, J. Microlith., Microfab., Microsyst. 3(1), 104-114 (2004). S. Owa and H. Nagasaka, “Advantage and feasibility of immersion lithography”, J. Microlith., Microfab., Microsyst. 3(1), 97-103 (2004). B. W. Smith et al., “Water immersion optical lithography at 193 nm” J. Microlith., Microfab., Microsyst. 3(1), 44-51 (2004). B. W. Smith et al., personal communication
Proc. of SPIE Vol. 5753
6. 7.
8. 9.
10. 11.
12.
13. 14.
15.
16. 17. 18.
19. 20. 21.
J. H. Fendler and E. J. Fendler, “Catalysis in Micellar and Macromolecular Synthesis” Academic Press, 1975. A. Chahti et al., “Phase transition in colloidal systems part I: Refractometric study of the binary system SDS+ water or pentanol-1 + water and ternary system water + SDS + pentanol-1 at 298.15 K” J. Disp. Sci. and Technology, 21, 525-535 (2000) P. Mukerjee et al. “Critical Micelle Concentrations of Aqueous Surfactant Systems”, Nat. Stand. Ref. Data Ser., Nat. Bur. Stand. (US), 36, 227 p, 1971 K. Kalyanasundaram and J. K. Thomas, “Enviromental effects on vibronic band intensities in pyrene monomer fluorescence and their application in studies of micellar systems’ J. Am. Chem. Soc., 99, 2039-2044 (1977) N. Deo et al. “Suractant interactions with zein protein” Langmuir. 19, 5083-5088, 2003. J. Lee and Y. Moroi, “Solubilization study for aggregates of sodium decyl sulfate and cationic polymer of high charge density” J. Colloid Interf. Sc., 273, 645-650 (2004) P. C. Shanks and E. I. Franses, “Estimation of micellization parameters of aqueous sodium dodecyl sulfates from conductivity data”, J. Phys. Chem., 96, 1794-1805 (1992) C. Botre et al., “A study on micelle formation in colloidal electrolyte solutions” J. Phys. Chem., 63, 650-653(1959) M. L. Corrin and W. D. Harkins, “The effect of salts on the critical concentration for the formation of micelles in colloidal electrolytes” J. Am. Chem. Soc., 69, 683688 (1947) T. Okano et al., “ Effect of side chain length and degree of counterion binding on micellization of sodium salts of α-Myristic acid alkyl esters in water: A thermodynamic study” Langmuir, 16, 3777-3783 (2000) “Physical Chemistry,” E. A. Moelwyn-Hughes, Pergamon Press, Oxford, 1961, p.397 X. Quan and E. S. Fry, “ Empirical equation for the index of refraction of seawater”, Appl. Opt., 34, 3477-3480, (1995) I. Thormählen et al., “Refractive index of water and its dependence on wavelength, temperature, and density”, J. Phys. Chem. Ref. Data, 14, 933-945 (1985) G. M. Hale and M. R. Querry, “Optical constants of water in the 200-nm to 200µm wavelength region”, Appl. Opt., 12, 555-563, (1973) G. D. Kerr et al. “Optical and dielectric properties of water in the vacuum ultraviolet”, Phys. Rev. A, 5, 2523-2527, (1972) P. Schiebener et al, “Refractive index of water and steam as function of wavelength, temperature and density” J. Phys. Chem. Ref. Data, 19, 677-717 (1990)
Proc. of SPIE Vol. 5753
553