An Agile Accelerated Aging, Characterization and Scenario Simulation System for Gate Controlled Power Transistors Greg Sonnenfeld Mission Critical Technologies, NASA Ames Research Center MS 269-4, Moffett Field, CA 94035 Phone: +1-650-604-1795; Email:
[email protected]
Kai Goebel NASA Ames Research Center MS 269-4, Moffett Field, CA 94035 Phone: +1-650-604-4204; Email: kai.goebel@ nasa.gov
Jose Celaya USRA/RIACS, NASA Ames Research Center MS269-4, Moffett Field, CA 94035 Phone: +1-650-604-4596; Email:
[email protected]
Abstract - To advance the field of electronics prognostics, the study of transistor fault modes and their precursors is essential. This paper reports on an aging, characterization, and scenario simulation platform for gate controlled power transistors. The platform supports thermal cycling, dielectric over voltage, acute/chronic thermal stress, and local thermal/current overstress. In addition, the platform supports transistor state monitoring, including measurements of the steady-state voltages and currents, measurements of high frequency response to various gate input signals, measurement of thermal transients, and extrapolated semiconductor impedances, all conducted at varying gate and drain voltage levels. The aging and characterization platform consists of an acquisition and aging hardware module, an object orientated experiment control software and a collection of industry developed test equipment. The platform is designed to allow in situ steady state and transient characteristic extraction. Keywords – prognostics, aging, characterization, damage progression, test board, electronics, remaining useful life, IGBT, MOSFET.
1.
INTRODUCTION
Generally, an understanding of intrinsic and extrinsic degradation mechanisms of component level devices is crucial for the adoption and application of health management to systems. Within the field of electronics, knowledge of semiconductor degradation under various system and environmental scenarios may be coupled with prognostic algorithms to predict future state and time–to– failure of semiconductor components. The existence of measurable extrinsic degradation precursors, pertaining to device packaging, has been well established in literature for power transistor devices [1, 7, 8, 9]. In recent literature intrinsic degradation precursors, related to the physical properties of the semiconductor, have
also been observed [2, 4, 5]. However, it is not widely known how degradation mechanisms propagate as a function of environmental conditions and various stressors. The attainment of such knowledge is critical for advancements in the field of power electronics health management and prognostics. The ability to perform large scale experiments and characterize the degradation signatures of such semiconductor devices under various scenarios is of great interest. This paper presents the design of a transistor test platform that assists in the stimulation and characterization of such features. In addition, the first phase of system implementation and its application to Insulated Gate Bipolar Transistors (IGBTs) in a thermal overstress scenario is presented. 2.
BACKGROUND
Fault diagnosis has traditionally been employed to some safety-critical mechanical systems or to those for which downtime leads to considerable financial loss. Typically, sensors monitor environmental and loading conditions in the application environment. Algorithms are then designed to extract information from the sensor readings, and compare them against a baseline to determine whether abnormal conditions exist and, if yes, what the root cause might be. While this technology has matured to some degree for mechanical (and also structural) systems, what has been ignored until recently is that most of today’s complex systems contain significant amount of electronics. There exists a priori reliability evidence that electronics may fail earlier than mechanical components. In the aerospace domain, flight and ground crews require health state awareness and prediction technologies across all systems (including structures, propulsion, and various subsystems) that can accurately diagnose faults, anticipate
failures, and predict the remaining life. This includes those from avionics. Indeed, electronic components have an increasingly critical role in on-board, autonomous functions for vehicle controls, communications, navigation, radar systems, etc. Future aircraft systems, such as the electric aircraft or the Next Generation Air Traffic System (NGATS) will certainly rely on more electric and electronic components. The assumption of new functionality will also increase the number of electronics faults with perhaps unanticipated fault modes. In addition, the move toward leadfree electronics and microelectromechanical devices (MEMS) will further result in unknown behaviors. To improve aircraft reliability, assure in-flight performance, and reduce maintenance costs, it is therefore imperative to provide system health awareness for digital electronics. To that end, an understanding of the behavior of deteriorated components is needed to develop the capability to anticipate failures and predict the remaining life of embedded electronics. 3.
ACCELERATED AGING METHODS
Accelerated aging methodologies are integral to the induction of degradation and component faults into the test systems. A brief review of some of the most prominent aging methodologies, associated degradation and measurable precursors is presented. A. Thermal Cycling Thermal cycling is among the most prevalent accelerated aging methodology in power electronics. It has been found that thermal cycling is strongly associated with die solder degradation and wire lift. Previous research has shown temperature differentials of 50°C and 80°C to result in failures after 2.7x10⁵ cycles and 5.0x10⁴ cycles for IGBTs with lead based solder, respectively, and failures after 2.0x10⁷ and 2.7x10⁵ for IGBTs with lead-free solders [7]. Degradation was accompanied by a pronounced shift in the gate threshold voltage (Vgth) during operation attributed to an increase in internal operating temperature [7]. Similar research on IGBTs has suggested that as few as 300 thermal cycles between temperatures of -55oC to 125oC results can cause die solder degradation and damage to solder joints equivalent to several decades of operation [8]. Power MetalOxide-Semiconductor Field-Effect Transistors (MOSFETs) cycled from -50oC to 100oC in excess of 7000 cycles have shown similar degradation, wherein solder degradation resulted in void formation over 30% of the die attachment bonds [9]. Die solder degradation and its symptoms are the prominent precursor associated with this aging method. Degradation can be monitored directly using imaging techniques [9], monitored by measuring decreases in thermal impedance of packaging [9], or monitored by measuring shifts in Vgth under constant power settings, indicative of an increase in internal temperature [7].
B. Hot Carrier Injection Hot Carrier injection is another form of accelerated aging. Such tests typically induce electrons and holes into gate oxide. Barrier heights of approximately 3.1eV and 4.8eV, for electrons and holes respective, yield a net surplus of electrons injected over the Si-SiO2 interface [11]. This excess of electrons results in an increase of the transistor threshold voltage. Such aging mechanism has been stimulated by applying high gate voltages [4], setting gate voltage to maximize drain current [5], or applying an overstress current across the drain [6]. Local hot carrier injection has been shown to diffuse laterally in SiO2 gates rather than de-trap back across the Si-SiO2 barrier. Hot carriers show signs of negligible dissipation on times below 10 minutes [4]. A correlation has also been established between the absorption of moisture and increase in hot carrier effect [5]. For properly packaged and passivated transistors the effect is weak, but may be relevant in both caustic and marine environments and when packaging is damaged. Hot carriers are typically monitored by measuring shifts in Vgth. It should be noted that when hot carriers are present, Vgth cannot be relied on for junction temperature measurements. Alternate methods of measuring internal temperature must be employed. C. Electrical Overstress Electrical overstress can be caused by excessive current, voltage, or power. It includes electromagnetic pulses, electrostatic discharge, system transients, and lightning [3]. One can distinguish between thermally induced failure mechanisms (contact metal burnout, fused metallization), and electric field induced damage (gate oxide rupture). A potential effect of electrical overstress is that the thin oxide isolating the gate and the channel of the transistor is damaged by large voltage spikes [3], a phenomenon called “punch through”. Hard switching of inductive loads has also been know to cause significant damage [10]. Precursors that could be monitored are collector-emitter leakage, gate leakage and changes in on-state resistance. D. Time Dependant Dielectric Breakdown stimulus Time Dependent Dielectric Breakdown (TDDB) refers to the damage accumulated in the gate oxide region of a power transistor during use within its rated operating condition. During operation, high temperature experienced by the IGBT under an applied electric field results causes charges in the gate oxide to get trapped. These charges increase with time, forming high electric fields and high current regions. Ultimately, the electric field built up by charge injection as well as that applied to the device will exceed the dielectric breakdown threshold in some of the weakest regions, causing large currents to further heat up the dielectric. This positive feedback results in electrical and thermal runaway [14].
4.
PROJECT REQUIREMENTS
Our goal is to design and implement a system capable of performing robust experiments on gate controlled power transistors to induce and analyze prognostic indicators. A prognostic indicator is a signal indicative of transistor degradation that can be used by prognostics algorithms to predict transistor’s Remaining Useful Life (RUL).This system also provides a test bed for the validation of prognostic algorithms used on power transistors. In order to meet this goal, a set of clear objectives is defined below. In addition, the extent and scope of the objectives are discussed considering various trade-offs between system robustness and realizability. Requirement 1: Operation on gate controlled power transistor The system must accommodate gate controlled power transistors. While an aging system that operates on most varieties of transistors may be desired, such a project scope would be unrealistic. For instance, some insulated IGBTs have source currents over 1000A and Gallium-Arsenic FieldEffect Transistors (GaAs FETs) often have sub nanosecond rise times. In order to limit complexity requirements were defined such that the system operates on standard commercially available power metal oxide semiconductor field effect transistors (MOSFET)s and IGBTs with currents capabilities ranging between 1 and 50 Amps in typical 3 pin packages. Such devices represent a very large class of transistors found in today’s Switch Mode power Supplies (SMPS) and similar power electronics. Requirement 2: Robust accelerated aging capability Aging scenarios are used to induce transistor degradation that may occur in transistor applications. The degradation of these devices can induce pre-fault signatures which serve as prognostic indicators. In a standard application aging degradation may take several years before any such signatures can be observed. Laboratory testing mandates accelerated aging of such components allowing for the production of results in a reasonable time frame. Laboratory testing also mandates careful control of system signals and environmental conditions so repeatable results can be produced and target specific faults. Ergo, the system must allow for the accelerating aging of transistors, wherein electrical signals and environments can be carefully controlled to laboratory standards. Requirement 3: Robust scenario simulation capability It is of considerable interest to system designers of high risk or mission critical systems to understand the lifetime, behavior and failure mechanisms of specified components. Such systems encounter extreme conditions such as space or combat environments. For systems that must incorporate prognostics, the simulation of application conditions and characterization of component degradation is extremely
valuable, if not obligatory, to the system design. The system must allow for the simulation of various application specific scenarios, including scenarios with extreme environmental conditions. Requirement 4: In-situ signal acquisition and device characterization Prognostics research seeks to establish a relation between a system current state and its corresponding time to failure. Such research requires analysis of state evolution trends as a system progresses towards failure. The system must have capacity to measure and record the electrical signals and environmental properties associated with test scenarios. In addition, the system must perform tests to extract transistors physical and electrical characteristics. Requirement 5: Interface with prognostic algorithms An in-situ application of prognostic algorithms while the device is aging is crucial for algorithm validation. The system must provide an interface for prognostic algorithm codes or libraries such that real-time prognostics can be performed. Requirement 6: Scalability, reconfigurability and software agility Within a research environment, new insights may demand the modification of requirements to better align future work with what has been just learned. The system must incorporate flexibility such that new instrumentation or software modules can be added with minimal effort. The system should be scalable, allowing multiple transistors to be tested in parallel. The software must be agile, such that new requirements can be incorporated without significant software redesign. Requirement 7: Autonomy The system must perform aging and characterization task autonomously. User intervention should only be required to design, configure or initiate a test sequence. 5.
PHASE-I DESIGN CONSIDERATIONS
In order to manage the complexity of the project the system implementation is planned over several phases. In this section we discuss phase-I of the hardware and software framework. A. Hardware – Transistor Gate Arbitrary signal generation is required over the full voltage range of a transistors gate for the support of robust scenario simulation and characterization abilities. A review of industry datasheets yields rise and fall times on the order of 10ns and 50ns, for specified MOSFETS and IGBTs. Gate voltages are typically limited to a 20v maximum for both transistors. A driver that exceeds this maximum would be useful for hot carrier injection and TDDB aging scenarios. Slew rates in excess of 2V/ns are desired for fast large signal
swings. Gate capacitances for specified transistors are typically in the range of 500pF for MOSFETs and 6nF for IGBTs, requiring a powerful gate driver. The necessity for arbitrary signal generation at the transistors gates suggests the use of a linear amplifier. In order to achieve proper transient response, a bandwidth in excess of 100MHz is desired. Additional equipment with higher performance or special functionality may also need an access to the transistor gate. Therefore, a test board should incorporate a switching mechanism between various modes of operation. A switching network for the electrical isolation of the gate should also be implemented where noise, current leakage or high voltages may cause problems.
collector-emitter resistances will often change by an order of magnitude over a 100°C differential. Such shifts must not be attributed to changes in the intrinsic characteristics of the transistor. Aging and simulation scenarios involve extreme environmental conditions. The system should allow temperatures ranging from far below 0°C to above 300°C, where IGBTs have shown short term operability [2]. Internal junction temperature, often measured by threshold voltage, may prove problematic as certain degradations such as hot carrier also act on this characteristic. Special effort should be taken to measure silicon die, package epoxy and package heat sink temperatures by external methods to enable accurate temperature control and thermal impedance degradation measurements.
B. Hardware – Source / Load / Power supply E. Software – Control and data acquisition On the collector or drain port, it is desirable to accommodate load currents from 10A up to 100A. Contacts and PCB components must be rated for high amperages. Power supplies voltages should be programmable to accommodate dynamic scenarios and tests. Power conditioning is needed to reduce interference caused by power supply feedback circuits and unwanted inductance contributed by long power cables. Dynamic loads are also desirable for the emulation of rich system scenarios.
The chosen software development environment must support communication with multiple hardware devices with relative ease. The test software must perform a multitude of experiments; act as an in-the-loop feedback controller and save gigabytes of data collected over long test runs. It should interact easily with the user for the setup of experiments and display results in real-time for system monitoring. F. Software - Framework
C. Hardware - Electrical Signal Acquisition One must measure the transient response of voltage and current signals corresponding to the gate-emitter and the collector-emitter nodes during scenario simulation or accelerated aging tests. Acquisition rates on the order of 1ns or greater are desirable and bandwidths in excess of 300MHz are required to accommodate the fastest rise and fall times. PCB design must take transients into consideration. Overlap between collector and emitter traces should be minimized to reduce parasitic capacitance that may promote or dampen oscillations during measurement. Traces should be kept as short as possible or be impedance matched to prevent signal reflection. If possible, instrumentation amplifiers should be implemented to prevent interference from measurement wiring and equipment. Average voltages and currents across these all transistor nodes should also be measured. Hardware low pass filtering of these signals allows for more accurate measurements and can reduce interference with transient signals. These averaged signals are especially important for SMPS applications. Power management ICs in SMPS already implements average voltage monitors, making them an ideal candidate for future prognostic implementations. D. Hardware – Thermal Environment Controlling thermal environment is exceptionally important for transistor characterization as their parameters are heavily temperature dependant. Transistor datasheets reveal Vgth typically shift on the order of -10mV/C and
The software architecture coupled to the platform must support a dynamic and scalable system. New test and system requirements will rise as the system develops. Research results may direct new and novel aging tests. Equipment upgrades will require system adaptation. A thorough review of software engineering principles is crucial to the development of a successful software package. 6.
PHASE I IMPLEMENTATION
A. Overview The phase I implementation of the system consists of a set of commercially available instrumentation attached to a custom built hardware system under the control of a software framework developed in LabVIEW. B. Commercial Instrumentation The industrial hardware consists of a 300MHz Agilent DSO5034A oscilloscope with 1ns sample time and 1MB deep memory for large transient acquisition, a 20 MHz Agilent 33220A function generator for generating gate signals, a National Instruments PCI-6229 data acquisition and source card with a SCC-68 breakout containing three SCC-TC02 thermocouple measurement modules and one SCC-RTD01 resistance temperature detector, a DCS2050A analog programmable power supply capable of sourcing 20V and 50A, three thermocouple modules, a Raytek RACI3A infrared sensor, a Tenney T5STR environmental chamber
High Impedance Low Pass Filter
High Impedance Low Pass Filter
High Impedance Low Pass Filter
High Impedance Low Pass Filter
High Impedance Low Pass Filter
High Impedance Low Pass Filter
capable of temperature, humidity and altitude control, and a PC computer running both LabVIEW and Matlab.
a single op-amp directly connected to the driver board output for DC operation and three additional op-amps capacitively coupled to the driver board output to assist in driving the largely capacitive loads associated with power transistor gates. The capacitive coupling prevents damage to op-amps in the event of gain mismatch for steady state operation. The driver board additionally contains adjustable feedback resistors used in gain calibration to ensure stable operation. Amplifiers are powered with a -5V / 25V supply, in a configuration equivalent to a -+15V supplied op-amp operated as a difference amplifier.
Figure 1. Overview of the electrical test system
C. Transistor Test Board Custom hardware was developed to compliment the commercial instrumentation and serve as the physical test bed for the transistor under test. This hardware includes a primary test board with a built in 200KHz current sensor with a 100A maximum current, an infrared temperature sensor port, BNC transient output ports connected to the DSO5024A oscilloscope, and a bank of 30Hz low pass filtered output ports connected to the PCI-6229 data acquisition card. An onboard gate driver switching network allows for the in-situ swapping of two separate gate signal sources. A gate isolation switching network is also implemented to remove unnecessary instrumentation when performing current leakage measurements or tests involving high voltage.
Figure 2. Schematic for the high frequency gate driver
D. Power conditioner and Load Board A power conditioner and load board was also constructed. It includes a power conditioning stage with three parallel capacitors with staggered capacitance values of 120mF, 4700uF and 47uF. This filtering system effectively removes cable inductance and power supply interference from most transient measurements. The board also proves two series resistance networks with swappable load ports and a freewheeling diode port for flexible load emulation. Board voltages are low pass filtered and acquired by the PCI-6229. E. Gate Driver Board
Figure 3. Large signal step response of the gate driver into an IGBT
The gate driver board consists of several parallel LM7171 linear voltage amplifiers operating in a non-inverting configuration coupled to an Agilent 33220A waveform generator for signal generation. The gate driver board has an approximate bandwidth of 100MHz , rail to rail voltages from -2V to 23V and can achieve slew rates of .5V/ns into a 50Ω load. The design of the driver, shown in Figure 2, consists of
Figure 3 show a 23V step through a 50Ω resistor into the gate of an IGBT. Rise time is 40ns. Figure 4 shows an impedance test of an IGBT gate. A 0.25V RMS sine wave is coupled with a 5V DC bias. Voltage is measured with an ac coupled oscilloscope across a 50Ω resistor connected in series with the gate.
Figure 4. An impedance test of an IGBT gate
interfaces (dynamic VIs or purely virtual classes), design patterns, and incorporates dynamic GUI insertion. Such methodologies enable flexibility in system design and future development. In our framework, experiment instructions are constructed using generic instrumentation driver known as interfaces, virtual functions or dynamic VIs. Such a design methodology is known as a template method pattern. At runtime, any specific device driver class or adapter that implements the driver interface can be passed into the template method pattern as demonstrated in Figure 6. Methods are thus called from the implementing class, rather than the generic class, result in operation equivalent to a design where the test had been initially programmed for user specific equipment. Template method patterns thus enable the separation of test logic from vendor specific equipment. Such software considerations can limit dependence on aging legacy devices or poorly performing instrumentation and help encourage software compatibility among researchers. .
Figure 6. Template method pattern utilization applied against a function generator Figure 5. Overview of the thermal test system
F. Thermal Hardware System A custom thermal control unit is also under development to attach thermocouples to fixed positions on the transistor package and utilize a peltier unit capable of 60C temperature swings in both negative and positive directions for use in rapid thermal cycling. The peltier is driven by a 15A linear amplifier and attached to a large heat sink for that acts as a reservoir for heat dissipation. An infrared sensor is also included for applications requiring contactless measurements, though infrared sensors have exhibited large temperature errors in our applications due to emissivity and beam localization considerations. G. Custom software Framework An agile object oriented experiment framework has been developed in LabVIEW making extensive use of classes,
Test scenarios are built from reusable test component classes implementing the test module interface. Test modules are assembled into a container class called a test object as shown in Figure 7. Additional tests modules can easily be added to a test object, even in the middle of an experiment, granting significant flexibility. Such functionality is useful for the testing of prognostic algorithms, where algorithms will likely be added long after a test object is designed. Figure 7 illustrates this principle for a thermal aging test. These test objects, once filled, contain all the instruction and data that define a test scenario. When a user selects a sequence of test scenarios, these test objects are placed on the queue of an experiment object. When an experiment object is executed, test objects on the queue are run in sequence and looped until the experiment is finished. During the experiment, test module objects communicate using a data passing object or a common database reference. Module GUIs are mapped to the primary GUI dynamically at the beginning of each experiment.
increased from 0V to 4V over the course of several minutes, allowing the IGBT temperature to reach a set high point of 330°C. When the IGBT exceeded the temperature threshold the IGBT gate was turned off until it fell below a set low point of 329°C. A third set point of 340°C was set to turn off the power supply if crossed as a protection against thermal runaway and latching failures.
Figure 7. Overview of the construction of the thermal stress test which is extended to include prognostic algorithms
IGBTs tests in such a manner were found to either fail very early, within the first several minutes of testing, or survived from 1 to 4 hours before loss of gate control or thermal runaway was observed. Figure 8 demonstrates the averaged current before and during a failure. The average onstate current increases from approximately 4A to 10A, indicative of a transition from a 40% duty cycle to a 100% on state. This behavior is indicative of latch up attributed to the temperature stimulated parasitic Silicon Control Rectifier (SCR) found within IGBT module. The experiment was ended after the failure and the IGBT was found to be functional when returned to room temperature.
H. Custom aging and characterization test software Two test software packages have been thoroughly developed and others are under development. The software performs a thermal degradation scenario which self-heats a transistor to a specified temperature and holds it within a temperature boundary by gate switching. All transient, thermal and steady state signals are acquired and recorded. In the event of a gate failure the experiment is quickly ended usually preserving the transistor. The second software package performs thermal impedance characterization of transistor packaging. Transistors are self-heated to a constant temperature with a known power setting. The transistor then switched off and its temperature decay is measured. Additional aging software under development will perform thermal cycling, inject hot carrier and induce electrical overstress. Additional characterization software under development will measures gate impedance, perform pulsed I-V curve measurements and extract switching characteristics. 7.
IGBT THERMAL OVERSTRESS EXPERIMENT
Preliminary thermal overstress tests were conducted on IGBTs during system development. An IGBT with 600V/15A current rating and was attached to the transistor test board with no heat sink. The second node of the power condition board was loaded with a 0.2Ω resistor, with the first node bypassed with a short. A 50Ω resistor was chosen to be placed between the gate driver and the IGBT gate for current measurement. A thermocouple was attached to the IGBT heat sink for temperature measurement. The gate signal was chosen to be a Pulse Width Modulated (PWM) signal with amplitude of 10V, a frequency of 10 KHz and a duty cycle of 40%, similar to a slow SMPS. The supply voltage was slowly
Figure 8. Latch up failure of an IGBT during thermal overstress
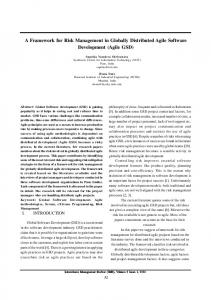
Transient switching signals recorded during the test were analyzed. Gate signals and currents remained fairly constant through out the test. Steady state voltages changes were minimal. Collector-emitter voltage characteristics during turn-on were also showed little changed. Current characteristics were not collected during this stage of development. A strong indicator was observed when viewing the collector-emitter voltage turn off characteristics. The transient turn-off peak decreased significantly, as a function of both temperature increases and thermal overstress degradation. Figure 9 displays the switching transient voltage, measure near 330C, at different degradation stages.
demonstrated, wherein thermal overstress of an IGBT showed caused shifts in switching transient voltage peaks. Phase II work includes expansion of the system for multiple parallel transistor testing, adding a USB capable onboard system controller, the addition of an microcontroller (MCU) based gate signal generator, addition of an impedance matched multiplexing board to scale oscilloscope applicability, adding instrumentation amplifier to board signals for increased signal isolation, addition of high voltage switches for damage prevention during IGBT collector overstress and leakage tests, addition of source measurement units (SMUs) for leakage current and threshold voltage measurement, and addition of a switching network to allow multiple load attachment to the main board. REFERENCES
Figure 9. A transient voltage generated at the collector-emitter when the IGBT is switched to an off state due to inductive effects. [1]
A scatter plot of transient peaks versus temperature was created with grayscale indicating the aging state as shown in Figure 10. A degradation trend can be clearly seen with transient peaks decreasing approximately 15% from initial to near failure voltage for similar external temperaturem easurements.
Figure 10. A scatter plot of the package temperature vs. switching transient peak voltage for a single IGBT
The origin of this indicator may have risen from intrinsic degradation. However, a more likely case is thermal impedance degradation of the package causing increases in internal temperatures. Regardless an indicator for semiconductor degradation under severe condition has been observed which warrants further investigation. 8.
FUTURE CONSIDERATIONS AND CONCLUSION
The design and initial implementation of an accelerated aging, scenario simulation and characterization system has been presented. A successful preliminary investigation of insitu degradation indicators using the system has also been
Wu, W., Held, M., Jacob, P., Scacco, P., and Birolini, A.; "Thermal Stress Related Packaging Failure in Power IGBT Modules", Proceedings of 1995 International Symposium on Power Semiconductor Devices & ICs, Yokohama, pp. 330-334, 1995. [2] Ginart, A., Roemer, M., Kalgren, P., and Goebel, K., ”Modeling Aging Effects of IGBTs in Power Drives by Ringing Characterization”, submitted to PHM’08, 2008. [3] Diaz, C.; “Automation of Electrical Overstress Characterization for Semiconductor Devices”, Hewlett-Packard Journal, October 1994, pp. 106-111, 1994. [4] Buh, G., Chung, H., and Kuk, Y., “Real-Time evolution of trapped charge in a SiO2 layer: An electrostatic force”, Applied Physics Letters, Vol. 79, No. 13, pp. 2010-2012, 2001. [5] Lifshitz, N., Smolinsky, G., “Hot-Carrier Aging of the MOS Transistor in the Presence of Spin-on Glass as the Inter level Dielectric”, IEEE Electron Device Letters, Vol. 12, No. 3, March 1991, pp. 140-142, 1991. [6] Ayten Kuntman, A., Ardalı, A., Kuntman, H., Kacar, F., ”A Weibull Distribution-Based New Approach To Represent Hot Carrier Degradation in Threshold Voltage of MOS Transistors”, Solid-State Electronics, Vol. 48, pp. 217-223, 2004. [7] A. Morozumi, K. Yamada, T. Miyasaka, S.Sumi, and Y. Seki, “Reliability of Power Cycling for IGBT Power Semiconductor Modules”, IEEE Transactions on Industry Applications, Vol. 39, No. 3, pp. 665-671, 2003. [8] J. Thébaud, E. Woirgard, C. Zardini, S. Azzopardi, O. Briat, and J. Vinassa, “Strategy for Designing Accelerated Aging Tests to Evaluate IGBT Power Modules Lifetime in Real Operation Mode”, IEEE Transactions on Components and Packaging Technologies, Vol. 26, No. 2, pp. 429-438, 2003. [9] D. Katsis and D. Wyk, ”Void-Induced Thermal Impedance in Power Semiconductor Modules: Some Transient Temperature Effects”, IEEE Transactions on Industry Applications, Vol. 39, No. 5, pp. 1239-1246, 2003. [10] M. Trivedi, K. Shenai, “Failure Mechanisms of IGBT’s Under ShortCircuit and Clamped Inductive Switching Stress”, IEEE Transactions on Power Electronics, Vol. 14, No. 1, 1999. [11] E. Ameraseka, and F. Najm, “Failure Mechanisms in Semiconductor Devices”, John Wiley & Sons Ltd, 1998. [12] F. Reynolds, “Thermally Accelerated Aging Of Semiconductor Components”, Proceeding of the IEEE, Vol. 62, No. 2, 1974. [13] Lim, S., and Tan, E., “Detection of Junction Spiking and its Induced Latch-Up By Emission Microscopy”, Proceedings of 26th Annual Reliability Physics Symposium, pp. 119-125, 1988. [14] Orsagh, R., Brown, D., Roemer, M., Dabney, T., and Hess, T., “Prognostic Health Management for Avionics System Power Supplies”, Proceedings of 2005 IEEE Aerospace Conference, 2005.