Jan 30, 2006 - make TCP recover from multiple packet losses per RTT in times of heavy .... Gigabit Ethernet DAG card and a harddisk to store traffic traces.
An Algorithm to detect TCP Spurious Timeouts and its Application to Operational UMTS/GPRS Networks Francesco Vacirca a,b Thomas Ziegler a Eduard Hasenleithner a a ftw.
Forschungszentrum Telekommunikation Wien, Donau-City-Strasse 1, A-1220 Vienna, Austria
b Infocom
Dept - University of Roma “La Sapienza,” Via Eudossiana 18, 00184 Roma, Italy
Abstract This paper proposes an algorithm to identify TCP spurious retransmission timeouts by post processing of packet traces monitored in operational networks. The operational principles of the algorithm and the assumptions behind its design are explained in detail as well as the situations in which the algorithm is prone to inaccuracies. By extensive measurements in a lab testbed using realistic round trip time characteristics as observed in operational wireless networks and FTP-like as well as Web-like traffic generators, it is shown that the algorithm is accurate in detection of spurious retransmission timeouts. Subsequently, the algorithm is applied to real traffic traces captured at several interfaces of an operational UMTS and GPRS network to analyze the frequency of spurious retransmission timeouts as well as the spurious timeout probability dependent on the load situation in the network and the flow size. This investigation, to our best knowledge the first on large scale TCP traffic traces monitored in an operational UMTS network, shows that spurious timeouts are infrequent events in the considered UMTS as well as the GPRS network. Among other findings, it is additionally shown that the ratio between spurious timeouts and other congestion recovery events experienced by TCP flows is low, indicating a negligible impact of spurious timeouts on TCP performance. Key words: TCP, Spurious Timeout, UMTS, GPRS.
1 Introduction
The characteristics of wireless networks as seen from the perspective of higher layer protocols are significantly different from their wireline counterparts. The orthogonality between the layers of the protocol stack, an invariant in the protocol Preprint submitted to Elsevier Science
30 January 2006
design of wireline networks for many years, has been shown invalid for the case of wireless networks due to crosslayer interactions between complex physical layer characteristics and the MAC layer, MAC layer and link layer ARQ mechanisms, and link layer mechanisms with transport protocols providing reliable end-to-end data delivery to applications. At the time when the Transmission Control Protocol (TCP), the Internet transport protocol for reliable service, was designed wireless packet switched networks were in their infancies and significantly less deployed than it is the case today. Consequently, TCP error control and the window based congestion control mechanism were designed with a wireline network in mind, agnostic to crosslayer interactions as observed in wireless networks. A well known example for crosslayer interaction between TCP and lower layers is the problem of Spurious (i.e. unnecessary) retransmission timeouts due to high variation of the round trip time (RTT). In the case of UMTS and GPRS networks high RTT variations are common due to: - mobility: the mobile terminal may experience intra- or inter routing area handovers implying signaling in the wireless network, storage of packets in SGSNs and/or RNCs, and a change in radio conditions usually causing a spike in the RTT of a TCP flow. We note that mobility mechanisms are different and more efficient in case of UMTS as compared to GPRS networks; - sudden increase of high priority traffic: in case of GPRS networks, GSM telephony traffic has higher priority when competing for timeslots on the channel with GPRS data traffic. If the load in GSM traffic suddenly increases GPRS data traffic experiences congestion causing significant queuing delays in GPRS core network devices and thus RTT variation; - overdimensioned buffers in core network equipment: as shown in (1) overdimensioned buffer sizes per mobile terminal in SGSNs can cause high maximum RTTs and high RTT variability in combination with time varying traffic demands and low link speeds; - changes in radio conditions: the variability in radio channel quality causes bit errors on the channel and retransmissions at the link layer. Link layer retransmissions introduce a delay jitter when transmitting TCP packets over the wireless link. Additionally, the channel is blocked causing buffering of packets and thus time varying queuing delays. The TCP retransmission timeout (RTO) fires if an acknowledgment for a segment is not received within the estimated RTT plus approximatively four times the mean deviation of the estimated RTT (2). The aim of the retransmission timeout is to make TCP recover from multiple packet losses per RTT in times of heavy congestion. A retransmission timeout caused by packet losses will be denoted as normal RTO (NRTO) for the remainder of this paper. The NRTO triggers a go-back-N in combination with Slowstart, reducing the congestion window to one segment and then increasing it exponentially as a function of the RTT as acknowledgments of retransmitted packets are seen. The combination of Go-back-N and Slowstart makes TCP reasonably efficient in terms of avoiding extensive retransmission of 2
segments that have already arrived at the data receiver. However, unnecessary retransmission of segments which have already arrived successfully at the receiver cannot be avoided. In wireline networks the heuristic for computation of the retransmission timeout has been shown to work well in making TCP recover from several packet losses per RTT and avoid unnecessarily firing the RTO in case of RTT variations due to time varying queuing delays in router buffers. In wireless networks, however, RTT variations are much more pronounced due to the reasons mentioned above. Consequently, the RTO may fire even in absence of packet loss only due to a sudden increase in the RTT. Such an RTO will be denoted as Spurious RTO (SRTO) for the remainder of this paper. Standard TCP derivatives are not able to distinguish between SRTOs and NRTOs and perform Slowstart in combination with Go-back-N in both cases. In case of SRTO this implies unnecessary retransmission of segments which already arrived successfully at the receiver beforehand and an unnecessary reduction of the congestion window. Unnecessary retransmissions and deflation of the congestion window obviously degrades network performance and TCP throughput in case the occurrence of SRTOs was frequent in wireless networks.
As will be shown in Section 2 analytical models of TCP SRTOs as well as suggestions to enhance TCP to be better able in dealing with SRTOs have been proposed by the research community. However, an algorithm discriminating NRTOs and SRTOs based on the analysis of packet traces as well as an extensive evaluation of the actual frequency of SRTOs in operational wireless networks carrying real user data is missing. This motivates the SRTO detection algorithm proposed in the current paper and its application to packet-level traces captured in Austria’s largest UMTS and GPRS network. In fact, one of the main findings of this paper is that for the considered network SRTOs are too infrequent to significantly impact TCP performance making the need for TCP enhancements in case of TCP over UMTS and GPRS networks questionable.
The paper is structured as follows: Section 2 discusses related work and makes the motivation for this paper explicit. The testbed and the traffic monitoring infrastructure in the operational network is described in Section 3. Section 4 explains the details of the SRTO detection mechanism and points at situations where the algorithm is prone to inaccuracies. Section 5 evaluates the accuracy of the mechanism using Testbed measurements. In Section 6 the algorithm is applied to GPRS and UMTS packet traces to infer the SRTO frequency. Section 7 compares standard TCP flavors (NewReno, SACK and Time Stamp) with TCP having the F-RTO algorithm enabled. Finally, Section 8 concludes this paper. 3
2 Related Works
Significant research efforts have recently been spent on modeling TCP’s reaction to RTT variations. (3; 4; 5) propose analytical models of TCP SRTOs and validate the models by simulation. Additionally, several proposals exist to upgrade TCP such that it is better able to avoid SRTOs. The Eifel Algorithm (6; 7) uses the TCP timestamps option and additional state variables at the TCP data sender and receiver to make TCP distinguish between SRTOs and NRTOs. The Duplicate SACK proposal (8; 9) aims at detecting SRTOs by an enhancement to the TCP SACK option. This proposal avoids unnecessary reductions of the congestion window but not unnecessary retransmissions in case of SRTOs. The F-RTO modification of TCP error control to detect SRTOs has been proposed in (10). F-RTO monitors the incoming acknowledgments to determine whether the timeout was spurious or not. Contrary to Duplicate SACK and Eifel, F-RTO is a TCP data sender only mechanism, facilitating incremental deployment. (11) proposes a proxy mechanism to detect SRTOs and to modify TCP acknowledgments in order to avoid SRTOs at the data sender. A validation of TCP performance over GPRS by investigating traces collected by passive monitoring at the Gi interface is shown in (1). This analysis, however, does not tackle the SRTO topic but concentrates on other TCP performance indicators. Similarly, (12) inspects traces from the wired Sprint backbone network but does not address the SRTO issue. They propose a rule to identify all unnecessary retransmissions, including for example unneeded duplicate retransmissions during Slowstart after a NRTO. On the contrary to (12), the present paper is focused on discriminating SRTOs from NRTOs and to measure the frequency of SRTOs and out of order packets due to SRTO by trace analysis. Additionally, the present paper is focused on wireless and not wired networks as it is the case in (12), where the occurrence of SRTOs is unlikely due to a low probability of outliers in RTT variations.
3 Monitoring and Testbed Infrastructure
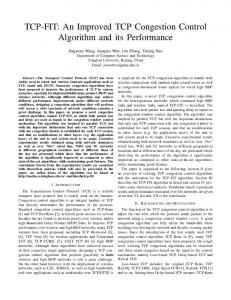
Two measurement infrastructures are used throughout this paper, the traffic monitoring infrastructure in the operational GPRS/UMTS network to retrieve packet traces and a laboratory testbed with a delay emulator and realistic traffic generators to evaluate the accuracy of the SRTO detection algorithm. The development of a large-scale passive monitoring system - including a parser for the whole protocol stack of the 3G Core Network - and its deployment in the operational network were accomplished within the METAWIN project (13). The monitored network is the large Mobilkom Austria network having more than 3 Million customers. For reasons of the provider’s privacy we omit more detailed information on the architecture of the Mobilkom core network. Packets are captured with Endace DAG cards (14) and recorded with GPS synchronized timestamps. For privacy requirements traces are anonymized by hashing any field related to user 4
identity at the lower layers of the 3G stack (IMSI, MSISDN, etc.). The traces include TCP/IP headers enabling the investigation of all kind of TCP related statistics using a variety of scripts which have been implemented. The monitoring infrastruc-
Fig. 1. METAWIN monitoring infrastructure.
ture is depicted in Figure 1. While we passively monitor all core network interfaces (Gi, Gn, Gb, Iu) the results presented in this work are based exclusively on traces captured at the GGSN side of Gn interfaces. All Gn links were monitored, covering 100% of GPRS and UMTS traffic from home subscribers, whereas the traffic of roaming subscribers is not considered in the following analysis. For proprietary reasons we can not disclose several absolute quantitative values (e.g., traffic volumes, number of users, number of Gn links, etc.) nor any other information that might indirectly lead to them. For these quantities we will provide only relative values, i.e. fractions, rather than absolute ones. In the context of this paper, traces were taken on the Gn interface during December 2004. HOST A
HOST B DELAY EMULATOR
�
��� � �� ��
�� � ���� ��
��
�� � �� �� �� �� �� �����
Ethernet Switch
�� ���� � � � � ��� � ��� ����� ��������� ��� �� �� � ��� ��� �� ��
Ethernet Switch
High Speed Disk
MONITOR HOST
Fig. 2. Testbed scenario.
The laboratory testbed is depicted in Figure 2. It is composed of two PCs on the left 5
hand side (server hosts) for traffic generation and two PCs on the right hand side (client hosts) for reception of traffic. Hosts run the Linux OS and are connected to two Ethernet switches with full duplex 100BaseTX links. The two switches are connected to a delay emulator PC with 1000BaseSX links. The delay emulator PC (15) is equipped with SysKonnect NICs and operated under realtime Linux for exact reproduction of propagation delays and delay variations. The purpose of the delay emulator is to reproduce delay variations allowing to trigger SRTO events in the testbed. This is required to evaluate the accuracy of the SRTO detection algorithm on the testbed; to this aim the delay emulator is fed with semi RTT samples captured in the GPRS operational network. Semi RTT is defined as the time elapsed when TCP DATA packet arriving from the Internet is captured at the Gn interface and the time the associated ACK coming from the MS is seen at the monitoring interface (see Figure 1). Investigating the RTT of GPRS and UMTS traces we observe that the RTT variations between the Gn interface and nodes in the wired Internet are negligible compared to the semi RTTs between the mobile node and the Gn interface. Thus using semi RTTs instead of full RTTs suffices to reproduce realistic RTT variations in our testbed. Using an optical splitter a monitoring host is connected to the link between the left hand side switch and the delay emulator. The monitoring host is equipped with a Gigabit Ethernet DAG card and a harddisk to store traffic traces. The traffic is generated by a FTP-like traffic generator and a web traffic generator. For FTP-like traffic (infinite length flows), we use ttcp (16) to generate TCP flows from the servers to the clients; for web traffic we use the websim tool (17) that generates traffic according to the Scalable URL Reference GEnerator (SURGE) model (18). This tool is divided into a multithreaded server application which listens for connection requests and a client application which sends the requests for pages and objects. For managing parallel TCP connections at the client side a thread is spawned for every connection; the client and server software contains logic for efficiently generating load representing several web users per host. SURGE random variables implemented in websim are the user think time (Pareto distributed), file size (combined Lognormal and Pareto distribution), inter object time (Weibull distributed), and the number of objects per page (Pareto distributed).
4 SRTO Detection Algorithm
The aim of the algorithm is the identification of SRTOs from traces captured by passive monitoring and to evaluate the frequency of such events in todays’ operational networks. The algorithm discriminates between a NRTO retransmission (due to packet losses) and a SRTO retransmission by exploiting the information contained in the ACK flow received by the monitoring interface before and after the retransmitted packet. 6
To our best knowledge, the SRTO detection algorithm for passive monitoring proposed in this paper is the first of its kind. Thus our design philosophy is to propose a rather simple algorithm and perform measurements to understand whether the simple approach is sufficiently accurate, instead of thinking about sophisticated solutions already at the beginning. As an important prerequisite to stay simple and generic, the algorithm is based on investigating only basic operational principles of TCP in standard situations. We do not exploit TCP options or specific properties of TCP derivatives in order to be able to cope with all TCP implementations. Thus the algorithm can not be perfect in identifying SRTOs, may fail to discriminate SRTOs from NRTOs in complex situations combining delay variations with packet losses, and may not be able to resolve some ambiguous situations. We will show in Section 5, however, that in spite of the design principle of keeping the algorithm relatively simple and inspecting solely essential TCP behavior in standard situations we can achieve a sufficiently high accuracy in detection of SRTOs.
4.1 Algorithm Description
In order to achieve a better understanding of the algorithm’s operation and the reasons behind its design we illustrate some NRTO and SRTO examples by investigating short snapshots of real GPRS traces. For ease of explanation we assume a lack of packet misordering in the network in this section. Additionally, we assume that packets are only lost between the measurement station and the TCP data receivers. We refer to Section 4.2 for comments on the effects of both assumptions.
ACK 73508
08
8
735
26 76
8
7350
72 22 8 73 50 8 74 88 8
ACK
Fig. 3. Normal timeout example.
AC
K
73
50
8
08 735
26 8 76
72
3508
22 8 73 50 8 74 88 8
7 ACK
Fig. 4. Timeout example showing ambiguity.
7
735 08
8 26 76
72 22 8 73 50 8 74 88 8
508
73 ACK
AC AC K 762 K7 6 488 8 8
Fig. 5. SRTO example.
Figure 3 shows an example of NRTO extracted from the GPRS traces. The TCP flow has a window of 3 segments; segment 73508 and segment 74888 are lost after they have been captured by the monitoring interface (dashed line). If we focus on the ACKs crossing the monitoring interface before the retransmission of segment 73508 it is easy to identify this retransmission as a retransmission due to NRTO because a duplicate ACK for the lost packet is received indicating a hole in the data receiver’s sequence number space. The second NRTO example (Figure 4) artificially modifies the trace snapshot shown in Figure 3 by dramatically increasing the RTT of the duplicated ACK 73508 such that it arrives at the monitoring interface after the retransmission of segment 73508. By observing the ACKs received before the retransmission of the lost packet it is impossible to discriminate between NRTO and SRTO. Comparing Figure 4 with Figure 5 depicting the SRTO example, it can be noticed that there is no difference in the sequence of segments and ACKs seen by the monitoring interface between the first transmission of segment 73508 and its retransmission. The two situations can be discriminated only by observing the ACKs seen after the retransmission at the monitoring interface: in case of packet loss we expect to see a duplicate ACK for the lost segment, whereas in the SRTO case we expect to see one or more ACKs acknowledging sequence numbers higher than the retransmitted segment. Exploiting this information we developed an algorithm that attempts to identify the cause of the timeout event; the algorithm has been implemented as an optional feature of the tcptrace tool 1 . The algorithm operates as follows (a detailed description of the algorithm in pseudo code is reported in the Appendix): if a segment with sequence number X is seen twice by the monitoring interface, the algorithm recognizes that the segment has been retransmitted and enters one of the following retransmission states: i) fast retransmission state (FRTX state), ii) normal timeout retransmission state (NRTO state) or iii) spurious timeout retransmission state (SRTO state). The selected state depends on the number of duplicate ACKs seen before the retransmission of the segment with sequence number X. If the number of duplicate ACKs is greater or equal to three, the algorithm enters the FRTX state assuming that the retransmission is due to a fast retransmit. If one or two duplicate ACKs are seen, the algorithm rec1
The modified tcptrace http://userver.ftw.at/∼vacirca/
version
8
can
be
downloaded
from
ognizes a hole in the receiver sequence space (i.e. packet losses) but the number of duplicate ACKs is too small to trigger a fast retransmit event. Thus the algorithm enters the NRTO state. In case zero duplicate ACKs between the first transmission of packet X and its retransmission have been captured the algorithm enters the SRTO state. In this case, the algorithm can not distinguish between SRTO and NRTO and it waits for the next ACKs to discriminate between the two situations (see Figures 4 and 5). Strictly speaking, if duplicate ACKs X are seen at the monitoring interface after the reception of the retransmission of X, the algorithm can be sure that there is a hole in the receiver sequence space because one or more packets with a sequence number greater than X have been received by the receiver. Assuming no packet misordering in the network this happens only if segment X has been lost. In this case the algorithm moves from the SRTO state to the NRTO state, otherwise it remains in the SRTO state. The algorithm gets out of a retransmission state when the ACK with the highest outstanding sequence number (recovery ACK) is seen indicating that the TCP flow has recovered from all packet losses. This prevents the algorithm from falsely detecting retransmissions following a fast retransmit event or a NRTO retransmission as retransmissions due to SRTO, and vice versa. The only exception to the previous description occurs when the retransmitted segment X has the highest sequence number seen so far indicating that the packet is the only outstanding packet at that moment. In this case the algorithm does not enter any retransmission state but solely marks the retransmission as ambiguous; this case will be discussed in detail in the next section.
4.2 Issues in SRTO Detection
In this section we discuss how the algorithm behaves in some particular situations which are the main reasons for errors in SRTO detection. As mentioned in Section 4, it has been assumed that packet losses happen solely between the monitoring station at the Gn interface and the data receiver. The algorithm has been defined such that retransmission states are only entered if a packet and its retransmission are seen by the monitoring interface. Thus, if the packet is dropped between the data sender and the monitoring station the algorithm does not enter the SRTO state which is correct because SRTO implies that no packets are lost. Some situations are necessarily ambiguous to SRTO identification due to the lack of information to infer the nature of the timeout. Normally, ambiguous situations happen when the number of outstanding packets is very low (i.e. small window) and/or the packet loss probability is very high. In these situations, it could happen that 1) there are no segments transmitted between the first transmission of the monitored segment and its retransmission; 2) every segment transmitted between the first transmission and the retransmission is lost; 3) all ACKs are lost. All these situations have been observed in real traces captured. It is worth to notice that these 9
37 18 2
AC
K3
864
2
2 864 K3 AC
37 18 2
37 18 2
37 18 2
ambiguous cases are more probable the higher the packet loss probability.
Fig. 6. Ambiguous retransmission example n.1.
Figure 6 depicts a possible time sequence graph of situation number 1. The window of the traced flow equals 1 segment. In this case from the passive monitoring interface point of view, there is no difference between SRTO and NRTO (upper part and the modified lower part of the figure, respectively)2 . A time sequence graph example of situation number 2 is depicted in Figure 7. In this case, the loss of all segments in TCP’s effective window makes it impossible to determine the nature of the retransmission event. The upper part of the figure depicts the situation in which the packet with sequence number 73508 is retransmitted by the sender after the RTO has fired. In this situation all the packets in the window are lost after the monitoring point (dashed line). The lower part of the figure depicts the situation in which the packet is retransmitted but the original packet has not been lost. In this case the round trip time increases and the ACK is delayed longer than the timeout expiration time. This situation leads to a false SRTO detection in case of the situation shown in the upper part of the figure and to a correct SRTO identification in case of the lower part figure. Based on a statistical analysis of UMTS and GPRS traces we find that the likelihood for the situation in the upper 2
A possible solution to distinguish between the two situations could be to observe the following ACKs that pass the monitoring interface; for example in the situation depicted in the figure, SRTO could be detected when we see a duplicate ACK (e.g. 38642 in this example) that indicates that the retransmitted packet has been received twice by the TCP receiver. However, the same behavior would be detected in the NRTO case if the packet successive to the retransmitted segment is lost as well. Thus the use of a more sophisticated mechanism would increase the causes for errors and the complexity of the implementation. For those reasons we prefer to mark that retransmissions as ambiguous and do not consider them as a SRTO in our evaluation.
10
64
8
735 08
K7
77 8
488
08
64
735
77
8 26
88 74
76
8
8
72 22 8 73 50 8 74 88 8 76 26 8 8
50
508
22
73 ACK
73
888
508
72
74 ACK
73 ACK
AC
8
Fig. 7. Ambiguous retransmission example n.2.
part figure is negligible with respect to the situation in the lower part figure. Thus situation number 2 is marked as SRTO by the algorithm.
6 7941
6 8631
7803 6 7941 6 8079 6
8631 6
7941 6
79
7803 6 7941 6 8079 6
K
AC
6 769 K8 AC
6 41
6
6
41
79
769
K8
AC
K
AC
Fig. 8. Ambiguous retransmission example n.3.
Figure 8 depicts the situation where all ACKs between the first and the second transmission are lost (situation number 3). The upper figure represents the NRTO event whereas the lower figure represents the SRTO event. This situation is particularly ambiguous and contradictory because it is difficult to define what SRTO means: in some sense the timeout is spurious because all segments have been received by the data receiver, on the other hand TCP’s timeout needs to expire to avoid starvation of TCP’s packet flow. In this case the algorithm does not allow to 11
distinguish between SRTO and NRTO and it marks them as spurious retransmissions. Another error source for the SRTO detection is caused by the possibility that a SRTO occurs when the algorithm is in one of the previously described detection states. In this case the algorithm can not distinguish the retransmission due to timeout expiration from normal retransmissions that occur during the recovery phase of a TCP timeout or fast retransmit. Moreover, by passive monitoring, it would be hard to distinguish between SRTOs and NRTOs when a timeout occurs during another congestion recovery period, because different TCP implementations behave in different way and it is not possible to forecast which should be the “correct” behavior in these situations. SRTOs occurring during another congestion recovery phase are not detected by the algorithm and lead to an underestimation of the number of SRTOs. As pointed out at the beginning of this section, the algorithm supposes that TCP flows are not affected by packet reordering inside the network. From the TCP point of view, out-of-order packets (19) are a problem because they can trigger unnecessary fast retransmits, but they are not a problem for SRTO detection. As far as the SRTO detection by monitoring is concerned, if the first transmission of a packet that triggers a SRTO is delivered to the TCP receiver after its following packets (e.g. if packet 74888 would arrive before packet 73058 in Figure 5), the algorithm may consider the SRTO as an NRTO causing an underestimation of the SRTO frequency. However, supposing that the two events are uncorrelated, the probability of this joint event (RTO and misordering) is negligible with respect to the error in SRTO detection reported in Section 5. The network duplication problem (20) does not impact the algorithm because in this case the packets are identified as hardware duplicates by the standard tcptrace software. Note, that we do not claim the completeness of this chapter in showing ambiguous situations, but that the most important cases are considered.
5 Algorithm Evaluation
To validate the accuracy of the algorithm a testbed scenario as depicted in Figure 2 has been set up. The aim of the testbed is to compare the results obtained by the SRTO detection algorithm running in the passive monitoring device with reliable information on the frequency of SRTOs obtained at the TCP data senders and receivers. To obtain the latter information, we modified the Linux kernel of the sender and receiver hosts to log events that occur during TCP operation. In particular, when a timeout expires the kernel of the TCP sender entity prints a line with the sequence number of the retransmitted segment, and, when an out-of-order segment is received, the hole in the receiver sequence number space is printed. From 12
this output we know every segment that has been retransmitted due to the RTO expiration (this is not true in case of passive monitoring) and we know when an out-of-order packet (i.e. loss) is seen by the receiver. Due to these kernel logs we are able to compare the output of the SRTO detection algorithm with reliable information at the data sender and receiver. In particular, by kernel log files we are able to detect all SRTOs without being affected by the ambiguity described in the first example of Section 4.2. Estimation Error
0.1 0.08 0.06 0.04
0
Out−of−order probability
NewReno SACK
0.02 10
20
30
40 50 60 # FTP Connections
70
80
90
100
0.08 0.06 0.04 0.02 0
NewReno SACK 10
20
30
40 50 60 # FTP Connections
70
80
90
100
Estimation Error
Fig. 9. SRTO estimation error and out-of-order probability in the FTP scenario. 0.08 0.06 0.04 0.02
Out−of−order probability
0
NewReno SACK 40
60
80
100 120 # Web Users
140
160
180
200
0.06
0.04
0.02 NewReno SACK 0
40
60
80
100 120 # Web Users
140
160
180
200
Fig. 10. SRTO estimation error and out-of-order probability in the Web scenario.
Figures 9 and 10 depict the SRTO estimation error probability and an estimation of the packet out-of-order probability in case of FTP connections and Web con13
nections, respectively. Two widely deployed versions of TCP are investigated, TCP SACK and NewReno. The accuracy of the algorithm is confirmed by an estimation error probability smaller than 10% over a range of out-of-order probabilities which can be assumed as realistic in case of a reasonably well engineered network. As expected the estimation errors increase as the loss probability increases; as explained in Section 4.2, that is due to algorithm not detecting SRTOs when it is already in a retransmission state.
0.14 NewReno: Estimation Error SACK: Estimation Error NewReno: Ambiguos Timeout SACK: Ambiguos Timeout NewReno: False Detection SACK: False Detection
0.12
0.1
0.08
0.06
0.04
0.02
0
10
20
30
40 50 60 # FTP Connections
70
80
90
100
Fig. 11. Estimation error, false detection probability and ambiguous detection probability in the FTP scenario.
A more accurate insight into the error estimation is given by Figure 11 for the FTP case; in this figure, the probability of falsely identifying an RTO as an SRTO (solid lines) and the probability for ambiguous situations described in Section 4.2 (dotted lines) are shown in addition to the mean estimation error. We observe that the false detection probability (i.e. the probability that the algorithm detects a spurious retransmission that is not present in the kernel log messages) is independent of the number of FTP connections (i.e. the load) and it remains constant. On the contrary, the number of ambiguous TCP retransmissions increases as the load increases. This can be explained by the increased likelihood for the ambiguous situation depicted in Figure 6 in case of high loss probabilities implying small congestion windows. Note again that there is no way to avoid this by any SRTO detection mechanisms using passive monitoring based on exploiting properties of TCP error control. 14
6 Results on Spurious Timeouts in the operational GPRS and UMTS network
Having verified the accuracy of the algorithm we aim at an understanding of the frequency of SRTOs in an operational GPRS/UMTS network and how SRTO events are correlated to TCP connection characteristics. As an initial step we use tcptrace 1 UMTS Dec. 6th UMTS Dec. 22nd GPRS Dec. 6th GPRS Dec. 22nd
Pr(RTT≥ x)
0.8
0.6
0.4
0.2
0 2 10
3
4
10 x (ms)
10
Fig. 12. Experimental Cumulative Distribution Function of semi RTT.
(21) standard features to derive network and traffic characteristics. The first characteristic derived is the Semi RTT Cumulative Distribution Function (CDF). The Cumulative Distribution Functions of the captured semi RTTs from the December 6th and 22nd traces are shown in Figure 12 for UMTS and GPRS network. We observe that the CDFs of RTTs derived from different days are similar. The second issue we address is the percentage of TCP connections that utilize TCP options. Table 1 shows the percentage of TCP connections that utilize the SACK Table 1 TCP flavor statistics. SACK
TS
SACK+TS
DSACK
UMTS - December 6th
93%
3.2%
1.5%
0.8%
UMTS - December 22th
92.1%
7.3%
4.9%
0.8%
GPRS - December 6th
91%
50.1%
49.8%
1.8%
GPRS - December 22th
93.9%
53.4%
52.7%
2%
option, the Time Stamp (TS) option, TS and SACK options together and the Duplicate SACK (DSACK) option in the analyzed GPRS and UMTS traces; the sets 15
of TCP connections that have the SACK, the TS and the DSACK enabled are not disjoint. It is to notice that most of the TCP connections (between 91 and 94%) enable the SACK option, the TS option is widespread (about 50%) in the GPRS terminals and quite rare in the UMTS terminals (between 1.5% and 5%), whereas the DSACK option is not so common (about 2% in GPRS and 1% in UMTS) 3 . It is worth to notice that in a technical report based on traces in May 2004 on the same GPRS network (22), the percentage of SACK and TS connections was about 80% and between 14% and 19% respectively. We also notice that the values for GPRS are sensibly different from those reported in (1, Table I) based on older measurements (at least 1 year) from different networks. As far as other TCP flavors are concerned, it is not straight forward to derive the deployment of options that are not negotiated explicitly during the setup phase of TCP connections (e.g. F-RTO) by passive monitoring.
6.1 Spurious RTOs in the GPRS Network Tables 4 2 and 3 report the percentage of TCP connections with a number of packets less than 10, between 10 and 100, between 100 and 1000, and greater than 1000 for two different days in December 2004. These four different TCP connection categories are further divided according to the number of SRTOs experienced on a per connection basis; in particular they are divided in the connections that experienced zero SRTOs, one SRTO and more than one SRTO. From the tables, it is clear that most of the TCP connections consist of only a few packets: approximately 55-57.5% of the connections have less than 10 TCP packets, 99% less than 100 packets and less than 1% of connections have more than 100 packets. Of all the connections, only 2% experience a single SRTO and 0.15% experience more than one SRTO. As shown in the tables, which exhibit very similar results for both days, SRTOs are more frequent for connections with a larger number of transmitted packets. For example 0.016% of the connections with more than 1000 packets experience more than one SRTO while no connection with more than 1000 packets experiences zero SRTOs. As for Tables 2 and 3 subsequent figures have shown very similar results for December 6th and December 22nd. Thus we only report December 22nd for the remainder of this section. Figure 13 shows a per connection scatterplot of the mean RTT (upper plot), the standard deviation of the RTT (middle plot) and the number of packets (lower plot) with respect to the number of SRTOs experienced by the connection. The solid line 3
It is worth noticing that the DSACK is not negotatiated in the connection setup. This makes difficult to measure its occurrence accurately, because it can only be observed when it is effectively used. 4 Some little discrepancies in the table results are due numerical approximations.
16
Table 2 GPRS - December 6th. Dependency of percentage of TCP connections on number of packets and SRTOs. Packets per > Connection x
Overall
0 SRTO
1 SRTO
1 SRTO
x < 10
57.65 %
57.44 %
0.21 %
0%
10 ≤ x < 100
41.62 %
39.93 %
1.63 %
0.072 %
100 ≤ x < 1000
0.703 %
0.551 %
0.094 %
0.058 %
x ≥ 1000
0.024 %
0%
0.009 %
0.015 %
Overall
100 %
97.917 %
1.943 %
0.144 %
Table 3 GPRS - December 22nd. Dependency of percentage of TCP connections on number of packets and SRTOs. Packets per
>
Connection x
Overall
0 SRTO
1 SRTO
1 SRTO
x < 10
55.579 %
55.338 %
0.241 %
0%
10 ≤ x < 100
43.671 %
41.928 %
1.649 %
0.094 %
100 ≤ x < 1000
0.721 %
0.569 %
0.107 %
0.046 %
x ≥ 1000
0.028 %
0%
0.013 %
0.016 %
Overall
100 %
97.834 %
2.01 %
0.156 %
represents the average of the mean RTT, RTT standard deviation and packets per connection, respectively. Moreover 95% confidence intervals of the average values are depicted showing the statistical relevance of the results. As far as the number of packets per connection is concerned, the increasing trend of the solid line in the lower part of the figure shows a clear positive correlation between the number of SRTOs per connection and the number of packets transferred during the lifetime of the connection. The upper and the middle plots show an evident correlation between the connections that do not experience any SRTO and the connections that have a low mean RTT and a low RTT standard deviation. Moreover, considering only the connections that experience one or more SRTOs, the correlation between the mean and the standard deviation of the RTT and the SRTO seems to be a negligible effect as revealed by the almost constant trend of the solid line of the upper and middle plots for one or more SRTOs. We argue that the TCP algorithm to estimate the RTO time takes the mean RTT deviation into account and that SRTOs happen rather due to infrequent outliers in RTT caused for instance by handovers. Due to their infrequency these outliers in RTT do not dramatically influence the standard deviation of the RTT. 17
Fig. 13. GPRS - December 22nd. Scatterplot of mean RTT, RTT standard deviation and packets per TCP connection with respect to the number of SRTOs per connection.
Figure 14 shows a per connection scatterplot of the number of Normal Timeout events (upper plot), number of Fast Retransmit events (middle plot) and Ambiguous retransmission events (lower plot) with respect to the number of SRTOs experienced by the connection. As in the previous plot, the average values (solid lines) and the 95% confidence intervals are reported. It can be seen from the figure that the 2% of the connections that experience SRTO always experience other congestion recovery events. There exists a clear positive correlation between connections experiencing a higher number of SRTOs and connections experiencing more fast retransmit and NRTO events. In case of the ambiguous retransmissions in the lower part figure the positive correlation is only weakly pronounced. With increased number of SRTO events, the dispersion of the number of congestion recovery events around the average value increases because of few available samples. Thus we note that results with 10 SRTOs are only presented for illustration and should not be considered as statistically relevant. The last issue we point out from the GPRS traces, is the effect of the network load on the SRTO events. In all four subplots of Figure 15 the x axis represents the 18
Fig. 14. GPRS - December 22nd. Scatterplot of Fast Retransmit, Normal Timeout and Ambiguous Timeout events per TCP connection with respect to the number of SRTOs per connection.
week from the 21th of December to the 27th of December 5 and on the y axis, the measured values for each parameters in time bins of one hour are presented. The upper part of the figure shows the normalized traffic volume; the values have been normalized to an arbitrary value in order to avoid disclosing the absolute volume of traffic. The second plot from the top of the figure shows the overall number of SRTO events divided by the number of packets per bin. The third part figure shows the overall number of SRTO events divided by the number of congestion recovery events performed by TCP, i.e. the number of SRTOs plus NRTOs plus fast retransmits and ambiguous retransmissions. The bottom plot shows the out-of-order probability. It is important to notice that the out-of-order probability is in the range of values where the SRTO detection algorithm has been shown to work sufficiently accurate in Section 5. Despite of the time of the day effect in the network load, the same effect is not present in the SRTO probability (2nd part figure) that maintains almost constant and is uncorrelated to the load of the network. This leads to the conclusion that the 5
Note that around December 26th no trace data is available explaining the empty parts.
19
1 Normalized Volume of Data 0.5
0 12/21
12/22
12/23
12/24
12/25
12/26
12/27
12/28
12/26
12/27
12/28
−3
8
x 10
6
SRTO events/number of packets
4 2 0 12/21
0.1
12/22
12/23
12/24
12/25
SRTO events / congestion recovery events
0.05 0 12/21
0.01
12/22
12/23
12/24
12/25
12/26
12/27
12/28
12/25
12/26
12/27
12/28
Out−of−order probability
0.005
0 12/21
12/22
12/23
12/24
Fig. 15. GPRS SRTO events divided by number of packets and number of congestion recovery events and out-of-order probability during the week between December 21st and December 27th.
delay variations that trigger SRTOs are caused by phenomena (e.g. fluctuations of the radio channel, increase in GSM traffic, handover) that are independent of the core network load. Moreover, it is important to observe that on average only two packets out of thousand experience a SRTO, showing their infrequency. Additionally, SRTO events are only a small fraction of the number of congestion recovery events performed by TCP (SRTOs, NRTOs, fast retransmits and ambiguous retransmissions). The ratio between SRTOs and congestion recovery events per time bin is approximatively one out of twenty. This implies that the performance degradation of TCP due to SRTOs is small because the number of fast retransmit and NRTO events is dominant as compared to the number of SRTO events. Investigating TCP connections that experience congestion recovery events (i.e. SRTOs, Normal Timeouts, Fast Retransmits and ambiguous retransmissions) in Table 4, the latter finding is confirmed. 20% of the TCP connections experience congestion recovery events 20
while only 2% experience SRTOs (see Tables 2 and 3). This indicates that 1 connection out of 10 experiences one or more SRTOs. Table 4 GPRS - December 22nd. Percentage of TCP connections dependent on number of packets and congestion recovery events. Packets per
>
Connection x
Overall
0 RTX
1 RTX
1 RTX
x < 10
55.555 %
49.765 %
4.13 %
1.66 %
10 ≤ x < 100
43.671 %
28.918 %
8.55 %
6.203 %
100 ≤ x < 1000
0.721 %
0.214 %
0.131 %
0.376 %
x ≥ 1000
0.0529 %
0%
0.006 %
0.047 %
Overall
100 %
78.897 %
12.816 %
8.287 %
6.2 Spurious RTOs in the UMTS Network
This section is equivalent to the Section 6.1: all tables and plots shown for GPRS data in Section 6.1 are reported for the UMTS network. We refer to Section 6.1 for an explanation of the meaning of plots and tables. Table 5 UMTS - December 6th. Percentage of TCP connections dependent on number of packets and SRTOs. Packets per > Connection x
Overall
0 SRTO
1 SRTO
1 SRTO
x < 10
59.502 %
59.37 %
0.132 %
0%
10 ≤ x < 100
38.78 %
37.505 %
1.215 %
0.06 %
100 ≤ x < 1000
1.641 %
1.296 %
0.244 %
0.102 %
x ≥ 1000
0.077 %
0%
0.029 %
0.047 %
Overall
100 %
98.171 %
1.62 %
0.209 %
From Tables 5 and 6, it is possible to observe that the distribution of the number of packets per connection is similar to the GPRS case. Between 59.5% and 60.7% of connections have less than 10 packets each and 98-99% less than 100 packets. Few connections (0.077% and 0.097%, respectively) have more than 1000 packets. Connections experiencing one SRTO event are less than in the GPRS case (0.73 and 1.6% in case of UMTS compared to 2% for GPRS) and connections with more than one SRTO event are rare (0.15 and 0.2% for UMTS). We observe that the 21
Table 6 UMTS - December 22nd. Percentage of TCP connections dependent on number of packets and SRTOs. Packets per > Connection x
Overall
0 SRTO
1 SRTO
1 SRTO
x < 10
60.733 %
60.703 %
0.029 %
0%
10 ≤ x < 100
36.888 %
36.374 %
0.477 %
0.037 %
100 ≤ x < 1000
2.281 %
2.04 %
0.185 %
0.057 %
x ≥ 1000
0.099 %
0%
0.038 %
0.061 %
Overall
100 %
99.117 %
0.729 %
0.154 %
percentage of connections experiencing SRTOs on the 22nd of December is halved as compared to December 6th. This change is due to a network upgrade as pointed out in (23). Thus we use the data of December 22nd for the remainder of this section. As depicted in the lower part of Figure 16, the positive correlation between the SRTO events and the number of packets per connection is confirmed in the UMTS scenario, where the arguments discussed in Section 6.1 hold. Similarly, the lack of correlation between number of SRTOs and mean as well as standard deviation of the RTT is the same for UMTS as observed already for GPRS. As expected, mean RTT and standard deviation are lower for UMTS as compared to GPRS. Figure 17 depicts the scatterplot of non-SRTO congestion recovery events classified by the algorithm with respect to the number of SRTO events per TCP connection. Similar to GPRS we find that for UMTS a positive correlation exists between SRTOs and NRTOs, fast retransmits and ambiguous retransmissions. 1% of the connections experiencing SRTOs have additional non-SRTO congestion recovery events. To show the dependency of congestion recovery events on the load of the UMTS network, Figure 18 depicts the SRTO event frequency, the ratio between SRTO events and congestion recovery events (including NRTOs, fast retransmits and ambiguous retransmissions) and the out-of-order probability for a whole week trace. The out-of-order probability (bottom plot) is low, between 0.002 and 0.005 with some spikes during the night with values up to 0.01 6 . The proportion between SRTOs and congestion recovery events is basically between 0.05 and 0.1 confirming the behaviour found in case of GPRS. Other congestion recovery actions than SRTOs influence the performance of TCP. Comparing the SRTO probability 6
It is important to pinpoint that statistics collected during the night, when the traffic load is low, can be biased by few TCP connections that are not relevant from a statistical point of view.
22
Fig. 16. UMTS - December 22nd. Scatterplot of mean RTT, RTT standard deviation and packets per TCP connection with respect to the number of SRTOs per connection.
(SRTO/number of packets) in the second part figure to the GPRS case we find that on average the SRTO probability is smaller for UMTS, but during the peak hours this probability can be greater than in the GPRS network. Concerning the behaviour of SRTOs with respect to the network load, comparing the first and the second plot, we note that the SRTO event frequency increases when the network load increases. This effect is particularly visible comparing the 22nd of December and the 23rd of December: on December 22nd the SRTO probability increases more dramatically during the peak hour than on December 23rd (about 15% smaller traffic volume in the peak hour). SRTO events correlate with the load on December 22nd but maintain almost constant during December 23rd. This suggests that the SRTO probability depends on the traffic load only if the traffic load exceeds a certain threshold: when the current load situation is below that threshold, the SRTO probability is almost constant, SRTO events are unlikely and they are correlated more to mobility events like handover than to network load conditions. When the load of the network exceeds this threshold (e.g. in the peak hour) the overall SRTO probability increases because of network congestion; an insight into this phenomenon has been shown in (23). However, we note that the overall SRTO probability is very low even in high load situations and that SRTOs are only a small fraction of all congestion recovery events. 23
Fig. 17. UMTS - December 22nd. Scatterplot of Fast Retransmit, Normal Timeout and Ambiguous Timeout events per TCP connection with respect to the number of SRTOs per connection.
Finally, Table 7 reports the percentage of connections experiencing congestion recovery events for December 22nd. Compared to the GPRS case, connections experiencing congestion recovery events are more infrequent. Retransmission events happen in 6.4% of all connections while SRTO events are experienced by 0.88% of the TCP connections; 93.4% of the connections do not retransmit packets, whereas 3.7% experience one congestion recovery event and 2.8% experience more than one congestion recovery events. This indicates that during the 22nd of December, the ratio between connections experiencing congestion recovery events and connections experiencing SRTOs is approximately 15:2 as compared to 10:1 for the GPRS network.
7 TCP performance evaluation
In this section we investigate the effectiveness of different TCP flavors with respect to TCP SRTOs exploiting the testbed described in Section 3. The TCP options 24
1 Normalized Volume of Data 0.5
0 12/21
12/22
12/23
12/24
12/25
12/26
12/27
12/28
12/26
12/27
12/28
−3
8
x 10
SRTO events/number of packets
6 4 2 0 12/21
12/22
12/23
12/24
12/25
SRTO events / congestion recovery events
0.15 0.1 0.05 0 12/21
12/22
12/23
12/24
12/25
12/26
12/27
12/28
12/25
12/26
12/27
12/28
Out−of−order probability
0.015 0.01 0.005 0 12/21
12/22
12/23
12/24
Fig. 18. UMTS SRTO events divided by number of packets and number of congestion recovery events and out-of-order probability during the week between December 21st and December 27th. Table 7 UMTS - December 22nd. Percentage of TCP connections dependent on number of packets and congestion recovery events. Packets per
>
Connection x
Overall
0 RTX
1 RTX
1 RTX
x < 10
60.66 %
59.122 %
1.067 %
0.471 %
10 ≤ x < 100
36.888 %
32.891 %
2.306 %
1.691 %
100 ≤ x < 1000
2.281 %
1.391 %
0.354 %
0.537 %
x ≥ 1000
0.172 %
0%
0.024 %
0.147 %
Overall
100 %
93.403 %
3.751 %
2.847 %
25
compared in the analysis are the Linux versions of NewReno, SACK, Time Stamp and F-RTO; as shown in Section 6, SACK and TS options are frequently applied in the GPRS and the UMTS network scenario.
Retransmissions per Spurious Timeout
14 NewReno SACK SACK+FRTO FRTO TS
12
10
8
6
4
2
0
10
20
30
40 50 60 # FTP Connections
70
80
90
100
Fig. 19. Average number of packet retransmissions per SRTO varying the number of FTP connections for different TCP flavors.
Figure 19 depicts the average number of retransmissions that occur after a SRTO expiration for different versions of TCP. It is possible to observe that when the network load is low F-RTO reacts well to the SRTO events and it avoids useless retransmissions. When the traffic load increases, the TCP congestion window becomes smaller reducing the number of unnecessary retransmissions during Slowstart after the timeout and thus the number of retransmitted packets for different versions of TCP converges to the same value. Figures 20 and 21 depict the TCP goodput in the FTP scenario and the goodput per object in the Web scenario, respectively. The Web object goodput is defined as the size of a TCP flow transferring an object in bytes divided by the lifetime of the TCP flow in seconds. The first figure shows that there are no big differences between the performance of different TCP flavors. However, we note that the SACK option combined with the F-RTO recovery procedure achieves the maximum goodput for every value of the load and that F-RTO alone obtains the worst performance. In case of Web traffic (Figure 21) the results show that the TCP SACK with F-RTO is only efficient if the number of users (i.e. the load) is high. If the number of users is low, the best performance is obtained by the TS option. We find that F-RTO minimizes the number of retransmitted packets during the recovery phase after a SRTO retransmission leading to a capacity saving in low load situations. However, in no scenario we can observe performance improvements in terms of goodput of F-RTO compared to other TCP flavors; this is consistent considering the low SRTO probability for GPRS-like RTT variations described in the 26
80 75 70
Goodput (kbytes/s)
65 60 55 50 45 NewReno SACK SACK+FRTO FRTO TS
40 35 30
10
20
30
40 50 60 70 # FTP Connections
80
90
100
Fig. 20. FTP goodput varying the number of connections for different TCP flavors.
600
Goodput per Object (bytes/s)
500
400
300
200 NewReno SACK SACK+FRTO FRTO TS
100
0
40
60
80
100 120 # Web Users
140
160
180
200
Fig. 21. Web object goodput varying the number of Web users for different TCP flavors.
context of Figure 15.
8 Conclusions
This paper defines an algorithm for the identification of spurious TCP timeouts (SRTO) from packet traces; to our best knowledge this algorithm is the first of its kind. The algorithm is deliberately kept simple in its design and based on generic properties of TCP error control. Thus it is applicable to all kinds of TCP derivates. By testbed experiments reproducing a realistic scenario with RTTs measured in 27
an operational GPRS network, we find that the algorithm is sufficiently accurate in SRTOs identification for the relevant range of load situations. The algorithm is then applied to evaluate the probability of SRTOs in a large operational UMTS and GPRS network. According to our best knowledge this is the first extensive investigation of TCP over an operational UMTS network transferring significant amounts of user data. Based on this trace analysis we find that the following common properties for the UMTS and the GPRS network hold: i) Spurious Timeouts are infrequent events for TCP flows. Less than 2% of the TCP flows experience one or more SRTOs; ii) there exists no correlation of SRTOs with the mean RTT of a flow and the standard deviation of the RTT; iii) there exists a positive correlation between the number of SRTOs a TCP flow experiences and the flow’s size; iv) on average, SRTO events are only a small fraction of the number of congestion recovery events performed by TCP (SRTOs, NRTOs, fast retransmits and ambiguous retransmissions). This implies that the performance degradation of TCP due to SRTOs is low because fast retransmits and NRTOs are dominant as compared to SRTO events. Investigating other metrics, more or less pronounced differences can be found in the UMTS and the GPRS case: i) on average, the probability that a packet experiences an SRTO is around one out of thousand for UMTS and two out of thousand for GPRS; ii) in the GPRS case there exists no dependency on the frequency of SRTOs on the load of the network. This leads to the conclusion that in the GPRS network conditions, SRTOs are caused by phenomena (e.g. fluctuations of the radio channel, increase in GSM traffic, handover) that are independent of the network load. In the UMTS network we observe a dependency of the probability that a packet experiences an SRTO on the load if the load exceeds a certain threshold. Given the infrequency of SRTOs in the monitored operational GPRS and UMTS network and the dominance of TCP flows experiencing other congestion recovery events than SRTOs we conclude that the effect of SRTOs on the performance of TCP is small. This makes the need to upgrade standard TCP versions to deal better with SRTOs questionable. We note, however, that although the investigated UMTS/GPRS network can be considered as a typical well-engineered network, results cannot necessarily be generalized to all other networks. Additionally, the present paper does not distinguish TCP flows from mobile terminals having mobility events from TCP flows experiencing no mobility events. Thus for mobile terminals experiencing an outstanding high numbers of mobility events upgrading TCP to deal better with SRTOs may be reasonable. In our future work we plan to crosscorrelate traces from Gn Interfaces with signaling information observed at Gb and IuPS links. This allows an in-depth investigation how mobility events affect the probability that flows experience SRTOs.
References [1]
P. Benko, G. Malicsko, A. Veres, “A Large-scale, Passive Analysis of Endto-End TCP Performance over GPRS,” Proceedings of IEEE Infocom 2004, 28
[2] [3] [4]
[5]
[6]
[7] [8] [9]
[10]
[11]
[12] [13] [14] [15] [16] [17] [18]
[19]
[20] [21] [22]
Hongkong, China, March 2004. W. Richard Stevens, “TCP/IP Illustrated, Volume 1,” Addison-Wesley, 1995. A. Abouzeid, S. Roy, “Stochastic Modelling of TCP in Networks with Abrupt Delay Variations,” Proceedings of MILCOM’2001. S. Fu, M. Atiquizzaman, “Modelling TCP Reno with Spurious Timeouts in Wireless Mobile Environment,” Proceedings of International Conference on Computer Communications and Networks, Dallas, USA, October 2003. M. Scharf, M. Necker, B. Gloss, “The Sensitivity of TCP to Sudden Delay Variations in Mobile Networks,” Proceedings of IFIP Networking 2004, Athens, Greece, May 2004. R. Ludwig, R.H. Katz, “The Eifel Algorithm: Making TCP Robust against Spurious Retransmission Timeouts,” ACM Computer Communications Review, 30(1), January 2000. A. Gurtov, R. Ludwig, “Responding to Spurious Timeouts in TCP,” Proceedings of IEEE Infocom 2003, San Francisco, USA, March 2003. S. Floyd, J. Mahdavi, M. Mathis, M. Podolsky, “An Extension to the Selective Acknowledgment Option for TCP,” RFC 2883, July 2000. E. Blanton, M. Allman, “Using TCP Duplicate Selective Acknowledgment (DSACKs) and Stream Control Transmission Protocol (SCTP) to Detect Spurious Retransmission Timeouts,” RFC 3708, February 2004. F-RTO: “A New Recovery Algorithm for TCP Retransmission Timeouts,” Report C-2002-17, Department of Computer Science, Helsinki University, February 2002. Y. Kim, D. Cho, “Considering Spurious Timeout in Proxy for Improving TCP Performance in Wireless Networks,” Elsevier Computer Networks Journal n. 44/2004, pp. 599-516, 2004. S. Jaiswal et al., “Measurement and classification of out-of-sequence packets in a tier-1 ip backbone,” Proc. IEEE INFOCOM 2003, Apr. 2003. METAWIN home page: http://www.ftw.at/ftw/research/projects. Endace Measurememt Systems, http://www.endace.com. E. Hasenleithner, T. Ziegler, “A Performance Evaluation of Software Tools for Emulation,” proc. of SPECTS 2005, Philadelphia, USA, July 2005. ttcp, available at http://ftp.arl.mil/˜mike/ttcp.html. E. Hasenleithner, T. Ziegler, “Testbed Report Phase1,” ftw. Technical Report, February 2002 P. Barford and M. Crovella, “Generating Representative Web Workloads for Network and Server Performance Evaluation,” Proceedings of ACM SIGMETRICS Conference, Madison, USA, 1998. J. Bennett, C. Partridge, and N. Shectman, “Packet reordering is not pathological network behavior,” IEEE/ACM Transactions on Networking, 7(6), Dec. 1999. V. Paxson. “End-to-End Internet Packet Dynamics,” IEEE/ACM Transactions on Networking, 7(3), 1999. Tcptrace 6.6.1, available at http://www.tcptrace.org. Francesco Vacirca, Thomas Ziegler and Eduard Hasenleithner, “Large Scale 29
Estimation of TCP Spurious Timeout Events in Operational GPRS Networks”, COST 279 Technical Report, TD (05)003. [23] F. Ricciato, F. Vacirca and M. Karner, “Bottleneck Detection in UMTS via TCP Passive Monitoring : A Real Case,” Proceedings of IEEE First International Conference on Wireless Internet, Budapest, Hungary, July 2005.
9 Appendix
In this section we show a simplified version of the algorithm with a pseudo code description. The following variables are used in the pseudo code: • state represents the state of the algorithm during its operation. Four states are permitted: N ORM AL when no retransmission is monitored, SRT O when a retransmitted packet is considered a spurious timeout retransmission, N RT O when a retransmitted packet is assumed to be a NRTO retransmission and F RT X when a retransmission is considered as caused by a fast retransmit event. • srto counter, nrto counter, f rtx counter and amb counter are the counters for the spurious timeout retransmissions, NRTOs, fast retransmits and ambiguous retransmissions events of the monitored connection respectively. for every packet do if packet is a DATA packet seen twice by the monitoring interface and state == N ORM AL then if no dupACK for the packet seen then if no packet is seen between the initial transmission and the retransmission then amb counter + + else enter in the SRT O state end if else if 1 or 2 dupACKs for the packet seen then enter in the N RT O state else if more than 2 dupACKs for the packet seen then enter in the F RT X state end if else if packet is an ACK then if state == SRT O then if it is a recovery ACK 7 then srto counter + + enter the N ORM AL state else if it is a dupACK then 7
According to the standard TCP terminology, the recovery ACK indicates the ACK that acknowledges for a new packet after a recovery event.
30
move to N RT O state end if else if state == F RT X then if it is a recovery ACK then f rtx counter + + enter in the N ORM AL state end if else if state == N RT O then if it is a recovery ACK then nrto counter + + enter in the N ORM AL state end if end if end if end for
31