An application framework for exploring the sustainability limits: The case of climate change impacts in Brazil Pinelopi Kapetanaki Wageningen University Droevendaalsesteeg 4 Wageningen, Netherlands pinelopikapetanaki88 @gmail.com
Peter Verweij Wageningen Environmental Research Droevendaalsesteeg4 Wageningen, Netherlands peter.verweij @wur.nl
Laurence Jones Centre for Ecology & Hydrology Deiniol Road, Bangor, North Wales, UK
[email protected]
Margareth Simoes Embrapa SolosBrazilian Agricultural Research Corporation (EMBRAPA), Rio de Janeiro, Brazil maggie.simoes@ gmail.com
Manuel Winograd Wageningen Environmental Research Droevendaalsesteeg 4 Wageningen, Netherlands manuel.winograd @wur.nl
Abstract In the era of development, technological evolution and population expansion, policies play a fundamental role in the maintenance of the economic, social and environmental wellbeing. Sustainable development is the general target of society to be ensured by policy decisions considering climate change, biodiversity loss, protection of endangered species, and so forth. Indicators have a fundamental role in providing new insights and clear statements by assessing progress and defining behaviours. In this paper, we test an application framework for the exploration of sustainability limits. We developed a set of sustainability limits for indicators and applied them in a Latin American context. We used QUICKScan, a tool to support the decision in participatory processes., by attempting to visualize any conceptual scenarios. Brazil was the case study country and the indicators used are: forest area coverage, carbon sequestration, the probability of being infected by Leishmaniosis and available water per capita. We present some results which illustrate the complexity of managing land use for multiple services, and the tradeoffs that inevitably result. By visualizing the current situation and comparing outcomes under future scenarios, we can support discussion with local experts to explore the policy options at local to regional scales. Keywords: QUICKScan, Indicators, threshold, ecosystem services
1
Introduction
The quality of life is embedded both in cultural and social contexts. Marans (2003), stated that the characteristics of a society like poverty, crime rates, and pollution contribute principally to people’s decisions of their lives. In the era of development, technological evolution and population expanding, policies play a fundamental role in the maintenance of the economic, social and environmental wellbeing. Sustainability and sustainable development are the general targets of society to be ensured when it comes to policy decisions about serious thresholds like climate change, biodiversity loss, protection of endangered species, and so forth. Economic, social and environmental prosperity are interlinked, but at the same time, they need separate methods of management. Kates et al. (2005) argue that one of the main observations that emerge regarding sustainable development is how it is measured. Indicative lists of characteristics are used, the indicators, to provide new insights and clear statements. They are meant to inform public and private actors and are used to assess progress, indicate a change in behaviors and define ongoing status. (Janssen et al., 2008). Without indicators, we
misguide ourselves in the belief that we can understand the meaning of the change that is taking place around us (Marans, 2003). Meaningful sustainability limits for a diverse set of indicators, need to be based on available data, which can be used for both current and future scenario analysis, and need to consider different policy and social contexts, at national and sub-national scales. An initial step to find the sustainability limits is the use of expert knowledge (Booker and McNamara 2004). In this paper, we test an application framework for the exploration of sustainability limits.
2
Sustainability limits
The concept of “sustainability” has been discussed a lot in the past, and a significant amount of research has been held to define and assess it. (Holling,2001; Tilman et al.,2002; Tsherning et al.,2008) For the environment, most sustainability versions “emphasize the conservation of biodiversity and the maintenance of the ecological integrity.” (Todes,2004: p.847).
AGILE 2017 – Wageningen, May 9-12, 2017
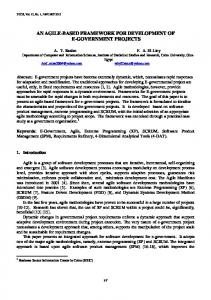
Figure 1., Examples of functions for transforming indicator values to acceptance levels based on limits. acceptance function.
A depicts an optima acceptance function for a quantitative indicator on basis of the assignment of a lower and upper limit indicator value; B shows a unilaterally restricted acceptance function based on a single upper limit indicator value and; C represents an ordinal optimum However, as Bertrand et al. (2008; p.405) notes “almost any environmental, social or economic system has the potential to reach a point or an area that is unsustainable, or outside acceptable limits.” The unacceptable damage of pressure on a social, economic or environmental system based on current knowledge is defined as sustainability limits (Perez-Soba et al...2008: p.397). The sustainability limits are of great importance when comes to indicator assessment; their fundamental role is to be set to assess a system as sustainable, semi-sustainable or not- sustainable (sometimes referred also as unsustainable). The values of the limits can be derived from existing policy, if available, or from related literature to the indicators that are to be assessed. (van Asselt et al., 2014). In cases when none of these sources of information is available, it is possible to use values that are the result of logical thinking based on what previous research has offered in this field of study. Thus, a discussion with other experts can start to evaluate the accuracy of these values and so, the correct sustainability limits to be set and used for the final assessment.
3 3.1
Method Calculation/Implementation into QUICKScan
Many GIS systems describe data based on its technical aspects like feature type, field type or bit depth. Stevens (1946) distinguishes between four levels of measurement to characterize what the data represents: quantitative-ratio (e.g. temperature in Kelvin), quantitative-interval (e.g. temperature in Celsius), qualitative-ordinal (e.g. ‘low,' ‘medium,' ‘high’) and qualitative-nominal (e.g. land use). This characterization allows doing automatic operations and visualizations when analyzing data. These levels of measurement are central to QUICKScan and are used to create zonal summaries, difference maps, difference charts, bar charts, trade-off spider diagrams and sustainability limit functions. Figure 2 illustrates how the
levels of measurement are linked to the concept DataKind to describe semantic information. Limits can be location specific, for instance, the amount of fertilizer to be used depends on the soil type selected, or the GDP target depends on the administrative region. The functional behavior of acceptability of an indicator value varies per indicator, e.g. some indicators have an optimal value (number of Panthers), while others are more linear by nature (carbon sequestration). Since nominal data cannot be ordered there are no limit functions available for this type of data. See Figure 2 for some examples of functions for transforming indicator values to acceptance levels based on limits.
3.2
Working together with experts
QUICKScan is a tool to support the decision in participatory processes (Verweij et.al., 2016.). Within the QUICKScan method, stakeholders sit together during a single, or multiple facilitated workshops in which they jointly define scenarios, indicators, and sustainability limits and link them with (map-) data using the QUICKScan software, to calculate indicators in situ. Multiple iterations take place within a single workshop. The interpretation of the intermediate results triggers refining of the scenarios, adding indicators and data as well as the assessment of following calculation results.
3.3
Test case: Climate change in Brasil
Current policy places an emphasis on the conservation of biodiversity (Todes,2004: p.847). There is a focus on tropical forests since they are hotspots for biodiversity and at the same time, they represent one of the largest carbon stocks in the planet. Latin America consists of such ecosystems, and Perez-
AGILE 2017 – Wageningen, May 9-12, 2017
Figure 2., Unified Modelling Language class diagram depicting how Limits functions are linked to the levelOfMeasurement.
Soba et.al (2013) notes that they suffer from high land use pressures that have led to dramatic loss of biodiversity. The FP7 (Seventh Framework Programme for Research and Technological Development) ROBIN (Role Of Biodiversity In climate change minitatioN) project focuses on developing countries of Latin America: Brazil, Bolivia, Mexico, and Guyana. The primary focus was on REDD+ (or REDD-plus: Reducing Emissions from Deforestation and forest Degradation in developing countries) (Turnhout et al., 2017) policies aiming at preventing carbon loss and safeguarding biodiversity while protecting ecosystem services. Since we had easy access to the local experts of Brazil and the acquired data was available immediately, we focus only on this country for this phase of the research.
3.4
Selection of scenarios and indicators
Scenarios portray possible futures and help stakeholders to explore how current and alternative development paths might affect that future (OECD, 2017). For this study, multiple scenarios were developed with a combination of climatic projections and different levels of policy implementation (Jones and Kok, 2013): • Current situation (2000) • Low climate forcing, sustainable development, high environmental protection (A) • High climate forcing, rapid economic growth, low environmental protection (B) As Bertrand et al. (2008) note, the sensitivity of an indicator or a relationship, in the environment, may operate differently or be governed by factors such as internal characteristics when
Table 1. Sustainability limits for Brazil per Biome (Beuchle et al., 2015: p.117) Indicator Probability of cases of Leishmaniosis (%) Water per capita (m3 per capita)
Functionality
Amazonia
Caatinga
Cerrado
Mata Atlantica
Pampa
Pantanal
“the less the better”
0.2
0.05
0.05
0.1
0.05
0.3
“the more the better”
1200
1200
1200
1200
1200
1200
per Region (Meyer, 2010)
Forest area coverage (%) Average carbon density (g C/ m2)
North
North East
South East
South
Central West
“the more the better”
80
15
15
15
50
“the more the better”
3380
2000
2500
1500
1500
AGILE 2017 – Wageningen, May 9-12, 2017
assessing on different levels (national, regional, local). In discussion with local experts, four indicators were chosen: Forest area (%), average carbon density (g C per m2), the probability of cases of Leishmaniasis (0-1) and potential water supply per capita (m3 per capita).
present situation. In Table 1, the four indicators chosen are shown together with the limit values set in either a biome or a region base. The values in this table were mainly a test of the methodology and application of QUICKScan as a tool to support the decision process.
4
4.2
Results
4.1
Indicator limits
Indicator limits were based on a combination of literature values, policy targets and an explorative dialog with experts. The values given are set as an example to serve a scientific test for visualizing the available data and make an estimation of the
Sustainability limits functionality
Sustainability limits were set with some regional variation, if relevant to the indicator, to compare the current status of the indicators in Brazil, and how they would change under the two contrasting future scenarios. Figure 3, illustrates four different maps of Brazil. From right to left:
Figure 3. Comparison of sustainability maps for forest cover under present day (2000) and the two future scenarios A and B.
The circle depicts that the sustainability limit set for the three different scenarios evaluates differently for (roughly) the same indicator value in the different acceptance levels of limits.
AGILE 2017 – Wageningen, May 9-12, 2017
•
the forest coverage of Brazil without any sustainability limit set. • The current situation (2000): the sustainability map of the present state of forest coverage in Brazil. • The sustainability map of Scenario A, where there is low climate forcing, the goal is the sustainable development, and the environmental protection is important. • The sustainability map of Scenario B, where there is a high climate forcing while the focus is given more to the economic growth and less to the environmental protection. It is interesting that even though the regions used for visualizing the limits are the same on all maps, sustainability limits evaluate the indicator values differently for the different crossover values of the regions. This is highlighted by using the yellow circle in the maps below. The same situation occurs in the other two maps that are not highlighted.
4.3
Trade-off (spider) diagram
A comparison of all limits set for the four indicators is illustrated in Figure 4. by using three trade-offs (spider) diagrams. The values included in the diagrams represent the cross over boundaries per the limits that we set. The red area in the center represents the unacceptable situation. As we move from the center to the borders of the cycles, the area turns green gradually and becomes acceptable. Even though in the entire region of Brazil, it seems that there are not extreme situations regarding the indicators, this is not the case when focusing on specific regions or biomes. The “Mato Grosso” and the “Mata Atlantica” spider diagrams are two representative examples of extreme situations occurring for different sets of indicators per situation. Mato Grosso in the current situation and Scenario B is mostly on the cross- over value or rather unacceptable This case is dramatically different in Scenario A where the department becomes very
unacceptable. On the contrary, when focusing on a biome for instance in Mata Atlantica, the biggest challenge is the water availability and the disease probability rather that the forest area and the carbon density. Availability of water, in this case, seems to reduce in the future scenarios, which is an issue while at the same time the probability of cases of Leishmaniosis is also raising in the future which is also a potential challenge.
5
Discussion & Conclusions
This research is a first attempt to visualize sustainability limits for four key ecosystem services in Brazil by using the data acquired during the ROBIN project and by leveraging the knowledge of the local experts. The results show that the scenarios can lead to big differences in sustainability for individual indicators; the outcomes seem to be both indicator- and area- specific. It is, also, worth noting that each scenario “functions” differently for each indicator. For instance, the Scenario B (high climate forcing) is worse for some of the indicators, but not all (e.g. the Leishmaniosis where Scenario A is worse). QUICKScan proved to be a valuable tool to support the decision in participatory processes. In the next steps, we will: Improve the results running again QUICKScan considering stakeholders’ information to create better scenarios based on the first Brazilian policies (Forest Code, Brazilian Low Carbon Agriculture Plan, Water Resources Program and so forth). Refine the sustainability limits and linking them with maps and data. The use of QUICKScan software to calculate indicators in situ with multiple iterations allows the interpretation of the intermediate results and the redefinition of scenarios.
Figure 4. Trade off (spider) diagrams for Brazil, Mato Grosso (one Brazilian department) and Mata Atlantica (one of the Brazilian Biomes)
AGILE 2017 – Wageningen, May 9-12, 2017
References
viewed 1 February 2017 < http://robinproject.info/home/wpcontent/uploads/2015/10/Factsheet-01-Overview.pdf >
Bertrand, N., Jones, L., Hasler, B., Omodei- Zorini, S.P. and Contini C. (2008) Limits and targets for a regional sustainability assessment: an interdisciplinary exploration of the threshold concept, In Helming, K., Perez-Soba, M. & Tabbush, P (eds.) Sustainability Impact Assessment of Land Use Changes, Heidelberg, Springer, pp.405-424
Stevens, S.S. (1946) On the Theory of Scales of Measurement, Science, 103, pp.677-680
Beuchle, R., Grecchi, R.C., Shimabukuro, Y.E., Seliger, R., Eva, H.D., Sano, E. and Achard, F. (2015) Land cover changes in the Brazilian Cerrado and Caatinga biomes from 1990 to 2010 based on a systematic remote sensing sampling approach, Applied Geography, 58, pp.116-127
Todes, A. (2004) Regional Planning and Sustainability: Limits and Potentials of South Africa’s Integrated Development Plans, Journal of Environmental Planning and Management, 47(6), pp. 843-861
Booker JM, McNamara LA (2004) Solving black box computation problems using expert knowledge theory and methods. Reliab Eng Syst Safe, 85, pp. 331–340 Holling, C.S. (2001) Understanding the Complexity of Economic, Ecological, and Social Systems, Ecosystems, 4 (5), pp.390-405 Ibge.gov.br. (2017). IBGE: Instituto Brasileiro de Geografia e Estatística. Viewed 1 February 2017 < http://www.ibge.gov.br/english/geociencias/geografia/default_ div_int.shtm > Jones, L., Kok, K, 2013, D2.3.1 Scenarios for use in ROBIN, Deliverable report for FP7-ENV-2011.2.1.4-1 Kates, R.W., Parris, T.M. and Leiserowitz, A.A. (2005) What is sustainable development? Goals, Indicators, Values and Practice, Environment, 47 (5), pp. 1-21 Marans, R.W. (2003) Understanding environmental quality through quality of life studies: the 2001 DAS and its use of subjective and objective indicators, Landscape and Unban Planning, 65, pp.73-83 Meyer, A. (2010), Brazil Geography Introduction. Retrieved from Viewed 20 April 2017 < http://www.brazil.org.za/brazilgeography-into.html > OECD, 2017, Why use scenarios, Viewed 18 April 2017, Perez-Soba, M., Petit, S., Jones, L., Bertrand, N., Briquel, V., Omodei- Zorini, c., Helming, K., Farrington, J., Tinacci Mossello, M., Wascher, D., Kienast, F. and de Groot, R. (2008) Land use functions- a multifunctionality approach to assess the impact of land use change on land use sustainability In: Helming, K., Tabush, P., Perez-Soba, M. (eds.) Sustainability Impact Assessment of Land Use Changes, Heidelberg, Springer, pp.375-404
ROBIN 2015, Fact Sheet 1: The Role of Biodiversity in Climate Change Mitigation (ROBIN): A whole system approach,
Tilman, D., Cassman, G., Matson, P.A., Naylor, R. and Polasky S. (2002) Agricultural sustainability and intensive production practices, Nature, 418, pp.671-677
Tsherning, K., Koning, H., Shober, B., Helming, S.S. (2008) Ex-ante Impact Assessments (IA) in the European Commission- an overview, In Helming, K., Perez-Soba, M. & Tabbush, P (eds.) Sustainability Impact Assessment of Land Use Changes, Heidelberg, Springer, pp.405-424 Turnhout, E., Gupta, A., Singh- Weatherley, J., Vijge, M.J, de Koning, J., Visseren- Hamakers, I.J, Herold, M. and Ledere, M. (2017) Envisioning REDD+ in a post- Paris era: between evolving expectations and current practice, Wiley Interdisciplinary Reviews: Climate Change, 8 (1), pp. 1-13 van Asset, E.D., van Bussel, L.G.J., van der Voet, H., van der Heijden, G.W.A.M., Tromp, S.O., Rijgersberg, H., van Evert, F., Van Wagenber, C.P.A. and van der Fels-Klerx, H.J (2014) A protocol for evaluating the sustainability of agri-food production systems- A case study on potato production in periurban argiculture in The Netherlands, Ecological Indicators , 43, pp.315-321 van Ittersum, M., Ewert, F., Wery, J., Heckelei, T., Belhouchette, H., Bergez, J-E., Hengsdijk, H., Jannsen, S., Russeli, G. and Therond, O. (2008) Integrated assessment of agricultural systems- A modular system for agricultural and environmental modelling (SEAMLESS-IF), Italian Journal of Agronomy, 3(3), pp.311-312 Verweij, P., Janssen, S., Braat, L., van Eupen, M., Perez-Soba, M., Winograd, M., de Winter, W. And Cormont, A. (2016) QUICKScan as a quick and participatory methodology for problem identification and scoping in policy processes, Environmental Science & Policy, 66, pp. 47-61 Verweij, P.J.F.M., Knapen, M.J.R., de Winter, W.P., Wien, J.J.F., te Roller, J.A., Sieber, S. and Jansen, J.M.L. (2010) An IT perspective on integrated environmental modelling: The SIAT case, Ecological Modelling, 221(18), pp. 2167-2176