Available online at www.sciencedirect.com
Procedia Computer Science 18 (2013) 2357 – 2366
2013 International Conference on Computational Science
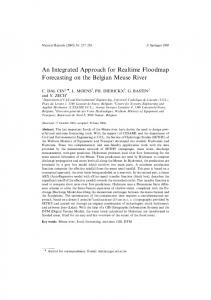
An approach for real-time levee health monitoring using signal processing methods Alexander L. Pyayta,b*, Alexey P. Kozionova,c, Ilya I. Mokhova, Bernhard Langd, Valeria V. Krzhizhanovskayab,e, Peter M.A. Slootb,e,f a
Siemens LLC, Corporate Technology, Volynskiy lane 3, 191186 St. Petersburg, Russia b University of Amsterdam, 1098 XH Amsterdam, the Netherlands c St. Petersburg State University of Aerospace Instrumentation, Bolshaya Morskaia 67, St. Petersburg, 190000, Russia d Siemens AG, 91050 Erlangen, Germany e NationalResearch University ITMO, St. Petersburg, Russia f Nanyang Technological University, Singapore 639798
Abstract We developed a levee health monitoring system within the UrbanFlood project funded under the EU 7th Framework Programme. A novel real-time levee health assessment Artificial Intelligence system is developed using data-driven methods. The system is implemented in the UrbanFlood early warning system. We present the application of dedicated signal processing methods for detection of leakage through the water retaining dam and subsequent analysis of the measurements collected from one of the UrbanFlood pilot levees at the Rhine river in Germany. © 2013 2013 The The Authors. Authors. Published Published by by Elsevier Elsevier B.V. B.V. Open access under CC BY-NC-ND license. © Selection and and/or under responsibility of organizers the organizers of 2013 the 2013 International Conference on Computational Selection peerpeer-review review under responsibility of the of the International Conference on Computational Science Science Keywords: signal analysis; levee health monitoring; UrbanFlood project; leakage detection; one-side classification
1. Introduction Recent statistical analyses indicate that the number of floods on our planet is still increasing [1]. There are about four times more floods registered nowadays as compared to the 1980s. In many cases levee/dike/dam collapse triggers further flooding [2, p. 86-87]. According to statistics, most dam failures are caused by overtopping, foundation defects, piping and seepage [2, p. 99] that occur due to the problems in structural
* Corresponding author. Tel.: +7 (812) 329-85-26; fax +7 (812) 324-83-42 E-mail address:
[email protected]
1877-0509 © 2013 The Authors. Published by Elsevier B.V. Open access under CC BY-NC-ND license. Selection and peer review under responsibility of the organizers of the 2013 International Conference on Computational Science doi:10.1016/j.procs.2013.05.407
2358
Alexander L. Pyayt et al. / Procedia Computer Science 18 (2013) 2357 – 2366
design, to underestimation of possible extreme flood and to the lack of understanding of geological properties beneath and around the dam. According to a study of dam failures in the USA [3] overtopping is the reason of 34% of floods. Foundation defects due to differential settlement, slides, slope instability, uplift pressures, and foundation seepage lead to 30% of all dam failures. Failure due to piping and seepage accounts for 20% of all failures. The remaining 16% of failures are caused by the problems with conduits and valves, and other miscellaneous problems. 1735 dikes failed in the Netherlands between 1134 and 2006 [4]. 67% of the events were caused by erosion of inner slope protection, 11% by ice drift, 6% by erosion or instability of outer slope protection, 5% by sliding inner slope, 4% by external reason (human and animal), 3% by sliding outer slope, 2% by liquefaction of shore line, 1% by piping, 1% by micro instability, horizontal shear and other related mechanisms. A conclusion that can be drawn from these statistics is that there are many mechanisms of levee failure that require constant levee health monitoring. Visual inspection will not guarantee detection of an onset of a levee failure early enough to prevent its collapse. Development of physical models provides a robust solution for levee behaviour assessment [24], but usually does not include real-time health monitoring. On-line monitoring requires installation of sensors into the levee to provide full information about behaviour of the object. Pore water pressure values play an important role in levee stability analysis [5, p. 42-43]. Inclinometers are generally used to measure tilt and to monitor lateral movements for embankments and dams [6, p. 788]. Leakage might be detected using fibre optic sensors measuring distributed temperature along the levee [7]. A detailed overview and comparison of existing sensor technologies for levee monitoring can be found in [8]. It must be emphasized that automated generation of alarms using real-time streams of measurements requires dedicated data-driven methods. For instance, in [9] the application of singular value decomposition to distributed temperature values is suggested for automatic leakage detection. Artificial neural networks were applied for slope stability analysis in [10]. Modern sensor technologies and intelligent data processing methods should be used for early detection of collapse processes. Both approaches are used within the UrbanFlood project. In this paper, we present the results of levee health monitoring based on the anomaly detection approach developed in the UrbanFlood project. 2. The UrbanFlood approach to levee health monitoring using signal processing methods One of the main goals of this project is the development of an on-line early warning system based on levee health monitoring [11-12]. Modern sensor networks were installed into several pilot sites in the Netherlands, Germany and in the United Kingdom. More details about these pilot sites can be found in [13]. Data collected from sensors measurements are evaluated by the Artificial Intelligence component. If there are anomalies due to different reasons (e.g., sensor fault, real developing failure), it produces an alarm. The most important benefit of this approach is that it uses reference data related to normal behaviour of the monitored object. This is possible due to a one-side classification approach using Neural Clouds (NC) [14]. The NC classification algorithm receives pre-processed data and a set of extracted features as an input. The core of the NC classification agent (a single classification algorithm) is a combination of an Advanced KMeans (AKM) clustering algorithm and an extended Radial Basis Functions (RBF) network approach. The NC encapsulates all previously known configurations of selected parameters for a given training period (Figure 1a). It provides more accurate classification of multidimensional data in normal and abnormal in comparison to simple hypercube approach: red points in the Figure 1a are incorrectly classified by hypercube approach to normal mode and are correctly classified by NC to abnormal mode. After training, the NC calculates a confidence value for every new state of the dike, describing the confidence value of normal behaviour.
2359
Alexander L. Pyayt et al. / Procedia Computer Science 18 (2013) 2357 – 2366
Figure 1b shows 3D presentation of the NC: X-Y plane contains 2D data shown in the Figure 1a, Z-axis interprets behaviour of the monitored object: value close to 1 is related to normal behaviour, values close to 0 can be interpreted as anomalies. Each one-side classification instance can use raw or pre-processed data, e.g. frequency or time-frequency transformation - Fourier or wavelet transformation. Confidence value of normal behaviour
1 x2
0
x1 -- GOOD CONDITION -- BAD CONDITION
x2
a)
x1 b)
Figure 1. a) Example of the Neural Clouds application to 2-D data, b) 3-D presentation of confidence value of object normal behaviour: value close to 1 is related to normal behaviour, values close to 0 can be interpreted as anomalies
Feature extraction
Figure 2. Anomaly detection concept
Cl2 x 10
-3
6
4
2
0
-2
-4
-5
-4
-3
-2
-1
0 X1
1
2
3
4
5 -3
x 10
Clk
-- NORMAL BEHAVIOUR -- ABNORMAL BEHAVIOUR
Confidence values
Analytical redundancy
Physical redundancy (the same placement)
Cl1
X2
Physical redundancy (type of sensor)
Sensor measurements
Multidimensional sensor measurements can be grouped according to a so-called physical redundancy (see Figure 2): neighbour sensors, sensors from the same cross-section or sensors measuring the same physical parameters can be analyzed by one one-side classifier. Another way of grouping is evaluation of analytical redundancy between the sensors: sensors are grouped if a relation between sensor values is detected. Stability of detected dependency is to be monitored in this case. More details about the use of this one-side classifier method can be found in Pyayt et al. [15-16]. In the next two sections we present the results of monitoring one of the UrbanFlood pilot sites, the Rhine levee. All these algorithms are implemented within the AI component [15] of the UrbanFlood early warning system. This component architecture utilizes the cloud computing infrastructure of the EWS efficiently. Each AI component instance is a separate Virtual Machine (VM) working on a virtualization host. Any required number of AI components can be started and configured.
2360
Alexander L. Pyayt et al. / Procedia Computer Science 18 (2013) 2357 – 2366
3. Rhine levee data analysis 3.1. Rhine dike installation There are two types of sensors installed into the Rhine levee: Alert Solutions (GeoBeads) in 2 cross-sections and a GTC Kappelmeyer fibre optic cable (250 m) placed across the levee (Figure 3). One of two Alert Solutions cross-sections is presented in the Figure 3. GeoBeads sensors provide temperature, pore pressure and inclination measurements in on-line mode [17]. Placement of the GTC Kappelmeyer fibre optic is marked in the Figure 3 in orange. The fibre optics provide spatio-temporal temperature measurements across the levee.
Figure 3. Alert Solutions sensors (marked with green balloons – left part of the picture, marked with blue circles – right part of the picture) and GTC Kappelmeyer fibre optic cable (marked with orange line) installed into the Rhine levee – second cross-section, left slope – waterside slope of the levee, right – landside slope
It must be emphasized that GTC Kappelmeyer uses a heat-pulse method that provides robust seepage detection: fibre is heated and possible leakage might be detected during the cooling-down phase. This is a socalled active method which, in comparison a passive method (without heat-up), can detect leakage in autumn and spring due to similar water and ground temperature. More details might be found in [7]. Pore pressure measurements gathered from Alert Solutions sensors are converted to water level values (Figure 4a). Each colour corresponds to a specific sensor (for example: the “E2” sensor is marked with red in Figure 4a,b). There are two lines per colour (sensor): a straight line indicates the height of the sensor installation in relation to water level, curve lines present a change of water height – if the water level is above a straight line, then this sensor is “covered” with water. The two green dotted boxes in the Figure 4a indicate the dates when the water level was higher than the ground water level (G1 sensor): 1st box - 9th of January 2012, 2nd box – 25th of January 2012. These peaks
Alexander L. Pyayt et al. / Procedia Computer Science 18 (2013) 2357 – 2366
2361
correspond to peaks in the Rhine water level of ~ 820 cm (09.01.2012) and ~ 710 cm (25.01.2012) [18]. According to the reported data [18] the levee was wet, but “strong seepage flow (> 10-4 m/s) can be excluded.” Summarizing all the abovementioned items, Alert Solutions sensors are useful for levee behaviour classifications (dry/wet). If piping starts close to the GeoBeads sensors, it will be easily detected. GTC Kappelmeyer fibre optic sensor should be applied for leakage test between cross-sections.
Figure 4. a) Alert Solutions pore pressure measurements converted to water level [m] in relation to NAP level (Y axis). X axis: number of timestamps, rate – 1 hour (period: November 2011 - February 2012). b) Positions of sensors plotted in the a) part of the Figure, left slope – waterside slope of the levee, right – landside slope
3.2. Analysis of measurements In this section we describe the collected GTC Kappelmeyer temperature measurements and the associated analysis. The process of a fibre optic heat-up is presented in the Figure 5. As it was mentioned, there was no piping detected. We detected, however, a so-called “air bubble” (Figure 5 – dotted bow) that was caused due to problems with the fibre optic cable installation: a cable was surrounded with air which has a lower thermal conductivity in comparison to the ground that covers the rest of the cable. The temperature across the whole cable is more or less the same during the heat-up process – about 28-30 degrees, but for the 209-221 m the temperature rises significantly. This effect might be interpreted as an anomaly. There are different approaches to detect a rapid change in time series, e.g. Student’s T-test [19], a detailed overview of such detection methods is presented in work [20]. Application of wavelets for abrupt fault detection is illustrated in [21]. In [22] wavelets were applied for analysis of water temperature measurements from the ‘Wivenhoe’ Dam. Each signal was decomposed using wavelets into daily, sub-annual and annual (DSA) components. Each of the components was used for further analysis. Time-frequency methods for data pre-processing were previously applied in the UrbanFlood project in [16], where Short Time Fourier Transforms were used for pre-processing the Zeeland levee data. The Maximum Overlap Discrete Wavelet Transform (MODWT) [23] is selected as a pre-processing procedure for Rhine levee data analysis. 8 levels of decomposition (“la8”: least asymmetric wavelet with 8 levels of decomposition) are presented in the Figure 6.
2362
Alexander L. Pyayt et al. / Procedia Computer Science 18 (2013) 2357 – 2366 Temperature (C)
Heat-up process - 24 Jan 2012 15:54:39 - 24 Jan 2012 16:59:39
40
“Air bubble” 209-221 m
35 30 25 20
Time
After the 1st minute of heat-up
15
After the 2nd minute of heat-up
After the 3rd minute of heat-up
10 5 0
5 minutes of “cold” cable
0
25
50
75
100
125
150
175
Cable close to air
200
225 250 Fibre optic cable section (m)
Figure 5. Rhine levee GTC Kappelmeyer fibre optic cable heat-up in time: X axis – length of the cable (m), Y axis – temperature (Celsius). The colours indicate temperature across the fibre optic cable in time.
Temperature (C) 40
Blue - "cold" fibre, red - after 10 minutes of heat-up Fibre optic cable(m)
20 0 30
78
10 0 -10 30
78
20 0 -20 30
78
126
1 level of decomposition (normalized)
174
222
“Air bubble”
126
174
222
126
174
222
126
174
222
126
174
222
126
174
222
2 level of decomposition (normalized)
3 level of decomposition (normalized)
10 0 -10 30
78
10 0 -10 30
78
20 0 -20 30
78
4 level of decomposition (normalized)
5 level of decomposition (normalized)
Figure 6. Results of MODWT application :X axis – length of the cable (m), Y axis – temperature (Celsius)
2363
Alexander L. Pyayt et al. / Procedia Computer Science 18 (2013) 2357 – 2366
Coefficients corresponding to the third and fourth levels of decomposition (Figure 6) after pre-processing were used as input for one-side classifier. Measurements related to the cold fibre and several first minutes of heat-up were used for the NC training. Values in the spatial time series after 10 minutes of heat-up (Figure 7a) are presented as normal/abnormal points in the Figure 7b: values close to 1 correspond to normal behaviour, close to 0 are interpreted as anomalies. Classification of the points in Figure 7a is clarified in Figure 7c that represents a 2D view of the constructed Neural Clouds. A cluster with normal data, related to the training set, is presented in Figure 7c with blue points, the test set is presented with black points and detected outliers are marked in red. MODWT doesn’t not have ’perfect’ localization properties according to the Gibbs phenomenon [23], that is why some points are not correctly classified as abnormal behaviour: lower points in Figure 7c correspond to normal temperatures in Figure 7a. This example proves in principle the functionality of the developed anomaly detection method. Application of this method to real-world leakage detection is presented in the next section. Temperature (C) blue - tempetature during heat-up, red - detected abnormal areas 34
a)
32 30 28 26 24 30
b)
78
126
174 222 Fibre optic cable (m)
Confidence value of normal behaviour 1
c)
0.8
2D presentation
8 6 4
0.6
2
0.4
0 -2
0.2
-4
0 30
78
126
174 222 Fibre optic cable (m)
-6 -8 -4
-3
-2
-1
0
1
2
3
4
Figure 7. “Air bubble” detection: 10th minute of heat-up. a) input time series; b) calculated confidence values: values close to 1 are related to normal behaviour, close to 0 mean anomaly; c) 3rd (X axis) and 4th (Y axis) levels of decomposition after pre-processing: blue – training set, black – test set related to normal behaviour, red – test set related to anomaly
4. Retaining dam data analysis GTC Kappelmeyer provided for further testing of the developed anomaly detection method a real example of abnormal behavior, registered in measurements collected at earth filled dam with bitumen sealing (total length > 2 km). It contained a leakage of a bitumen sealing made of asphalt-coated gravel and bitumen binder of the dam. This anomaly is presented in spatial time series as a rapid drop in the interval around 150 meter (Figure 8). MODWT has been applied for spatio-temporal time series pre-processing (“la8”, 8 levels of decomposition). The calculated wavelet coefficients are presented in the Figure 9. Coefficients corresponding to the second and third levels of decomposition after pre-processing were used as input for the one-side classifier.
2364
Alexander L. Pyayt et al. / Procedia Computer Science 18 (2013) 2357 – 2366
Temperature, degree
Leakage 74-163 m
Heat-up process: 12.06.2003 08:17 - 12.06.2003 09:35
35
30
25
Time 20
15
After the 1st iteration of heat-up (25 min) 10
0
After the 2nd iteration of heat-up (30 min)
200
400
4 iterations (20 minutes) of “cold” cable 600
800
1000
Meter, m
Figure 8. 3. Retaining dam GTC Kappelmeyer fibre optic cable heat-up in time: X axis – length of the cable (m), Y axis – temperature (Celsius). The colours indicate temperature across the fibre optic cable in time.
Blue - "cold" fibre (1st iteration), red - after 10 iterations (6 iterations of heat-up) 40 20 0
0
200
400 600 800 1 level of decomposition (normalized)
1000
1200
0
200
400 600 800 2 level of decomposition (normalized)
1000
1200
0
200
400 600 800 3 level of decomposition (normalized)
1000
1200
0
200
1000
1200
1000
1200
1000
1200
5 0 -5 5 0 -5 5 0 -5
400
600
800
4 level of decomposition (normalized) 5 0 -5
0
200
400
600
800
5 level of decomposition (normalized) 5 0 -5
0
200
400
600
800
Figure 9. Results of MODWT application: X axis – length of the cable (m), Y axis – temperature (Celsius)
Alexander L. Pyayt et al. / Procedia Computer Science 18 (2013) 2357 – 2366
Calculated confidence intervals (Figure 10a) show that the part of the cable between 150m and 160m is classified as abnormal: confidence values are close to 0. A 3D presentation of the constructed NC is provided in Figure 10b. Confidence value of normal behaviour 1 0.8 0.6 0.4 0.2 0 200
400
600
a)
800
1000
m
b)
Figure 10. Retaining dam leakage detection: 6th iteration. a) calculated confidence values: values close to 1 are related to normal behaviour, close to 0 mean anomaly; b) 3D view of constructed Neural Clouds
5. Discussion and conclusions Novel signal processing methods for anomaly detection in measurements gathered from sensor networks installed into dams are presented. Two sensor networks installed into the Rhine levee – one of the UrbanFlood [11] pilot sites - were considered: Alert Solutions and GTC Kappelmeyer. Alert Solutions sensors (GeoBeads) can measure pore pressure, inclination and temperature. They proved useful for identification of various levee failure modes. GTC Kappelmeyer fibre optic cable measures temperature following the so-called active principle where the cable is heated. Two types of anomalies were considered in this work. The first –“air bubble”– was associated with the installation of fibre optic cables across the Rhine levee. This levee is not affected by leakage; no other anomalies were found. The second data set that contains a pattern of real leakage at the retaining dam was provided by GTC Kappelmeyer. Both data sets were analyzed using an anomaly detection scheme developed within the UrbanFlood project. The anomalies have been detected as a rapid change in the spatial time series. One of the main methods is the one-side classifier (Neural Clouds (NC) [14]) that doesn’t require anomalies in a training set. The presented one-side classification approach has been successfully applied also for other levees health monitoring [15-16]. Application of the NC for available data analysis is not possible without special pre-processing because absolute values are changing during heat-up. Maximum Overlap Discrete Wavelet Transform (MODWT) was selected as a pre-processing procedure. This method is useful for detection of a rapid change in the observed time series. A combination of time-frequency pre-processing and one-side classification seems to provide robust identification of anomalies for both spatio-temporal data sets. Automatic selection of parameters of signal processing procedures is one of the next steps of research. It must be emphasized that detection of leakage is an important issue, even though leakage by itself is not a specific criterion of a possible levee collapse. Levee behaviour assessment should always be carried out by physical models and experts. The presented anomaly detection approach can be used for any complex object monitoring. This approach is implemented within the Artificial Intelligence (AI) component that can be integrated in any existing decision support system. Condition monitoring using the UrbanFlood early warning system provides scalable solution: required number of Virtual Machines (VM) containing AI component will be started in the cloud computing infrastructure of the EWS on demand.
2365
2366
Alexander L. Pyayt et al. / Procedia Computer Science 18 (2013) 2357 – 2366
Acknowledgements This work is supported by the EU FP7 project UrbanFlood # 248767; by the Russian Leading Scientist Programme contracts 11.G34.31.0019. Many thanks to GTC Kappelmeyer (particularly, Philipp Heidinger), Alert Solutions (particularly, Erik Peters) for providing data and support in data explanation. Peter Sloot acknowledges the Complexity Program of NTU.
References [1] Flood - Data and statistics, http://www.preventionweb.net/english/hazards/statistics/?hid=62 [2] Wohl, E.E.: Inland Flood Hazards: Human, Riparian, and Aquatic Communities, Cambridge University Press, 2000, 512 p. [3] City of Roseville Multi-Hazard Mitigation Plan, January 2011, http://www.roseville.ca.us/civica/filebank/blobdload.asp?BlobID=19067 [4] Baars, S., Kempen, M.: The Causes and Mechanisms of Historical Dike Failures in the Netherlands, Official Publication of the European Water Association (EWA), 2009, p. 1-14 [5] Department of water resources: Urban Levee Design Criteria, May 2012, http://www.water.ca.gov/floodsafe/leveedesign/ULDC_May2012.pdf [6] Dantal, V., Aubeny, C., Lytton, R.L.: Suction and movement monitoring of levees, http://ussdams.com/proceedings/2012Proc/777.pdf [7] Vries, G., Koelewijn, A.R., Hopman, V.: IJkdijk Full Scale Underseepage Erosion (Piping) Test: Evaluation of Innovative Sensor Technology, Physical Model Tests, p. 649-657 [8] Ng, G., Oswalt, K.: Levee Monitoring System. Better Management through Better Information, CEE 180: Engineering Systems, April 2010, p. 1-12 [9] Khan, A.A., Vrabie, V., D'Urso, G., Mars, J.I.: SVD based automated dike monitoring system using DTS data, Industrial Electronics, 2008. IECON 2008. 34th Annual Conference of IEEE, p. 1931 - 1936 [10] Kaunda, R., Chase, R., Kehew, A., Kaugars, K., Selegean, J.: Neural network modeling applications in active slope stability problems. Environmental Earth Sciences, 60, 2010, p. 1545–1558 [11] Official site of the UrbanFlood project: www.urbanflood.eu [12] Krzhizhanovskaya, V.V., et al. Flood early warning system design, implementation and computational modules. Procedia Computer Science, V. 4, pp. 106-115, 2011. http://dx.doi.org/10.1016/j.procs.2011.04.012 [13] Simm, J., Jordan, D., Topple A., Mokhov, I., Pyayt, A., Abdoun, T., Bennett, V., Broekhuijsen, J., Meijer, R.: Interpreting sensor measurements in dikes - experiences from UrbanFlood pilot sites. Comprehensive Flood Risk Management – Klijn & Schweckendiek (eds). 2013 Taylor & Francis Group, London, ISBN 978-0-415-62144-1. Proceedings of the 2nd European Conference on FLOODrisk Management. 20-22 November 2012, Rotterdam, The Netherlands, p. 327-336 [14] Lang, B., Poppe, T., Minin, A., Mokhov, I., Kuperin, Y., Mekler, A., Liapakina, I.: Neural Clouds for Monitoring of Complex Systems. Optical Memory and Neural Networks (Information Optics). 2008. Vol. 17. No. 3. Pp. 183–192, 2008 [15] Pyayt, A.L., Mokhov, I.I., Kozionov, A., Kusherbaeva, V., Melnikova, N.B., Krzhizhanovskaya, V.V., Meijer, R.J.: Artificial intelligence methods and finite element model application for on-line dike measurements processing. Proceedings of the 2011 IEEE Workshop on Environmental, Energy, and Structural Monitoring Systems, Milan, Italy, 28 September 2011, p 1-7. [16] Pyayt, A.L., Mokhov, I.I., Kozionov, A.P., Kusherbaeva, V.T., Krzhizhanovskaya, V.V., Broekhuijsen, B.J., Meijer, R.J.: Signal Processing Methods for Flood Early Warning Systems. Proceedings of the 10th International Conference on Hydroinformatics – HIC 2012, ISBN 978-3-941492-45-5, Hamburg, 14-18 July. p. 1-8 [17] Peters, E.: GeoBeads, multi-parameter sensor network for levee monitoring, http://www.urbanflood.eu/Documents/p5_urbanflood_2010.pdf [18] GTC Kappelmeyer: Fibre Optical Leakage Detection System at the Rhine-Dyke section Haffen of the “Deichverband Bislich Landesgrenze” (internal report), November 2011 [19] Carter, B.C., Vershinin, M., Gross, S.P.: Comparison of Step-Detection Methods: How Well Can You Do?, Biophysical Journal, Vol. 94, January 2008, p. 306–319 [20] Basseville, M., Nikiforov, I.V.: Detection of abrupt changes: theory and application, Prentice Hall, 1993, 528 p. [21] Zhang, J.Q.: A wavelet-based approach to abrupt fault detection and diagnosis in sensors, IEEE Transactions on Instrumentation and Measurement, Vol. 50, No. 5, 1992, pp. 1389-1396 [22] Percival, D.B., Lennox, S.M., Wang, Y.-G., Darnel, R.E.: Wavelet-Based Multiresolution Analysis of Wivenhoe Dam Water Temperatures, Water resources research, Vol. 47, 2011, 19 pp. [23] Percival, D.B., Walden, A.T.: Wavelet Methods for Time Series Analysis, Cambridge University Press, (2000) [24] Melnikova, N.B., Shirshov, G.S., Krzhizhanovskaya, V.V. Virtual Dike: multiscale simulation of dike stability. Procedia Computer Science, V. 4, pp. 791-800, 2011. http://dx.doi.org/10.1016/j.procs.2011.04.084