Geosci. Model Dev., 8, 1033–1046, 2015 www.geosci-model-dev.net/8/1033/2015/ doi:10.5194/gmd-8-1033-2015 © Author(s) 2015. CC Attribution 3.0 License.
An approach to enhance pnetCDF performance in environmental modeling applications D. C. Wong1,** , C. E. Yang2,** , J. S. Fu2 , K. Wong2 , and Y. Gao2,* 1 U.S.
Environmental Protection Agency, Research Triangle Park, NC, USA of Tennessee, Knoxville, TN, USA * now at: Pacific Northwest National Laboratory, Richland, WA, USA ** These authors contributed equally to this work. 2 University
Correspondence to: D. C. Wong (
[email protected]) Received: 2 September 2014 – Published in Geosci. Model Dev. Discuss.: 6 November 2014 Revised: 20 March 2015 – Accepted: 20 March 2015 – Published: 8 April 2015
Abstract. Data intensive simulations are often limited by their I/O (input/output) performance, and “novel” techniques need to be developed in order to overcome this limitation. The software package pnetCDF (parallel network Common Data Form), which works with parallel file systems, was developed to address this issue by providing parallel I/O capability. This study examines the performance of an application-level data aggregation approach which performs data aggregation along either row or column dimension of MPI (Message Passing Interface) processes on a spatially decomposed domain, and then applies the pnetCDF parallel I/O paradigm. The test was done with three different domain sizes which represent small, moderately large, and large data domains, using a small-scale Community Multiscale Air Quality model (CMAQ) mock-up code. The examination includes comparing I/O performance with traditional serial I/O technique, straight application of pnetCDF, and the data aggregation along row and column dimension before applying pnetCDF. After the comparison, “optimal” I/O configurations of this application-level data aggregation approach were quantified. Data aggregation along the row dimension (pnetCDFcr) works better than along the column dimension (pnetCDFcc) although it may perform slightly worse than the straight pnetCDF method with a small number of processors. When the number of processors becomes larger, pnetCDFcr outperforms pnetCDF significantly. If the number of processors keeps increasing, pnetCDF reaches a point where the performance is even worse than the serial I/O technique. This new technique has also been tested for a real application
where it performs two times better than the straight pnetCDF paradigm.
1
Introduction
The Community Multiscale Air Quality (CMAQ) model (Byun and Schere, 2006) is a regional air quality model which is widely used in air quality research and regulatory applications (e.g., Fu et al., 2012). This model was developed in the 1990s by the US Environmental Protection Agency (US EPA) and it has continued to evolve. Recently, CMAQ was combined with the WRF (Weather Research and Forecasting model) to form a WRF-CMAQ twoway coupled model (Wong et al., 2012) with direct aerosol effects on radiation. CMAQ has been and continues to be extensively used to provide guidance in rule making such as CSAPR (Cross-State Air Pollution Rule, http://www.epa. gov/airtransport/CSAPR/), used by state and local agencies for air quality management analyses such as SIP (State Implementation Plan), and also used by academia and industry for studying relevant atmospheric processes and model applications. CMAQ has also been adapted into the real-time US National Air Quality Forecasting system (AQF) (Otte et al., 2005) operationally at the National Weather Service since 2003 and was recently deployed for forecasting air quality for the 2010 Shanghai World Expo. CMAQ uses IOAPI (Input/Output Applications Programming Interface; http://www.cmascenter.org/ioapi) to handle I/O since the initial model inception. In recent years, I/O has
Published by Copernicus Publications on behalf of the European Geosciences Union.
1034
D. C. Wong et al.: An approach to enhance pnetCDF performance
been shown as one of the bottlenecks in the CMAQ model system. I/O consumes about 24–35 % of the entire simulation time. For many applications model runtime is critically important, such as air quality forecasting which requires meeting operational time constraints, studies of relationships between climate change and air quality that involve decadalscale simulations (e.g., Gao et al., 2013), or multiscale model simulations involving multiple coarse- and fine-grid resolutions. For such runtime critical applications, improving the efficiency of I/O becomes an even more important element that needs to be addressed. To increase the I/O efficiency, we turn to a data aggregation technique (Palmera et al., 2011) which has been used to achieve high I/O bandwidth as well as a parallel I/O approach which has been applied in other computer science fields but not for existing environmental models and their processes. Section 2 provides background information about what has been done regarding parallel I/O applications. Section 3 describes the current implementation of I/O in CMAQ through IOAPI. Section 4 depicts our application level data aggregation technique to enhance I/O performance using pnetCDF (parallel network Common Data Form; Li et al., 2003; http://trac.mcs.anl.gov/projects/parallel-netcdf/ wiki/Download) and demonstrates I/O enhancement through testing with a smaller-scale model. This technique was applied to CMAQ and preliminary results are presented in Sect. 5 while Sect. 6 summarizes the main findings and presents discussion of future work.
2
the I/O by using the network Common Data Form (http: //www.unidata.ucar.edu/software/netcdf/), a set of software libraries and self-describing, machine-independent data formats, has been discussed regarding the performance of different I/O libraries (Li et al., 2003), including serial netCDF, pnetCDF and Hierarchical Data Format (Cheng and Folk, 2000). An auto-tuning framework (Behzad et al., 2013) has been developed to attempt to provide the best I/O setting with respect to the entire I/O stack automatically. It used a genetic algorithm to search the “optimal” solution from the parameter space. Our approach gears toward application level rather than the I/O stack level but we also deal with two parameters, stripe count and stripe size, in the parallel file system level. File data striping on parallel file systems also influences I/O performance. Data is distributed using a fixed block size in a round-robin manner among available I/O servers and disks based on a simple striping data distribution function. An optimal striping setup on parallel file systems can significantly reduce the I/O time (Nisar et al., 2012) while inappropriate settings may incur striping overhead for both metadata and file read/write operations (Yu et al., 2007). Research work has shown degradation of parallel I/O efficiency when large numbers of processors are applied to scientific applications such as CMAQ (Kordenbrock and Oldfield, 2006). To overcome these shortcomings, we re-engineered the current CMAQ I/O module to better utilize more processors on highperformance computational machines as well as quantifying the optimal data-striping setup on Lustre file systems.
Previous work in parallel I/O 3
The independent I/O and collective I/O are the two most common I/O strategies in parallel applications. However, a shortcoming of the independent I/O approach is the servicing of the I/O requests of each process individually (Chen et al., 2010). The collective I/O provides a better solution of managing non-contiguous portions of a file with multiple processes interleaved (Thakur et al., 1999). Several collective I/O techniques are hence developed to improve the parallel I/O performance at various levels by enabling the compute nodes to cooperate with efficient parallel access to the storage system. Examples include two-phase I/O (del Rosario et al., 1993), data sieving (Thakur et al., 1999), and the collective buffering (Nitzberg and Lo, 1997). To optimize the I/O performance, software is designed to access non-contiguous patterns by implementation of collective I/O. Data is rearranged and aggregated in memory prior to writing to files, which reduces the number of disk accesses and the seek-time overhead due to large amounts of noncontiguous write requests. Improved I/O efficiency is observed through split writing and hierarchical striping of data (Yu et al., 2007). The benefits of utilizing the improved parallel I/O techniques on applications in various research areas have been recognized (Li et al., 2003; Kordenbrock and Oldfield, 2006; Huang et al., 2014). The approach to parallelize Geosci. Model Dev., 8, 1033–1046, 2015
I/O in CMAQ
The Community Multiscale Air Quality (CMAQ) modeling system, an active open-source development project of the US Environmental Protection Agency, is an air quality model for regulatory and policy analysis. The interactions of atmospheric chemistry and physics are studied through this threedimensional Eulerian atmospheric chemistry and transport modeling system. The primary goal for CMAQ is to simulate ozone, particulate matter, toxic airborne pollutants, visibility, and acidic and nutrient pollutant species within the troposphere and across spatial scales ranging from local to hemispheric. IOAPI, a third-party software, was created concurrently with the initial development of the CMAQ model. It provides a simple interface to handle read and write data in netCDF format in CMAQ. It originally operated in serial mode and was later expanded to run on SMP (Symmetric Multiprocessing) machines using OpenMP. It has never been implemented with capability to run on a distributed system. When CMAQ was parallelized in late 1998, a “pseudo” parallel I/O library, PARIO, was created to enable CMAQ to run on a distributed system. PARIO was built on top of the IOAPI library to handle regular data operations (read and write) from each MPI (Message Passing Interface) prowww.geosci-model-dev.net/8/1033/2015/
D. C. Wong et al.: An approach to enhance pnetCDF performance
1035
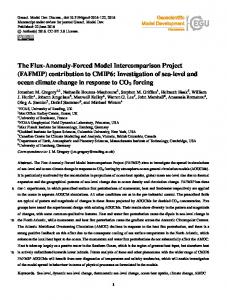
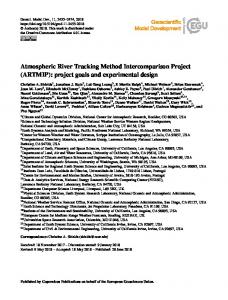
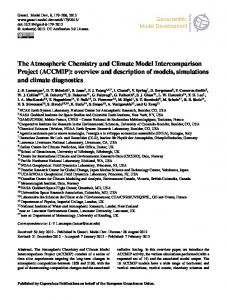
of this new technique is data aggregation which can be considered as mitigation for the second shortcoming described above. Generally speaking, data can be either aggregated along the row dimension or column dimension of a rectangular horizontal grid to enhance the I/O efficiency. During aggregation, a small number of localized MPI communication processes were introduced, which does not diminish the overall benefit of the technique. In order to determine the performance of this new technique, a small-scale code was devised. This smaller code, which is designed to mimic the CMAQ model, contains a time step loop with artificial workload. Data is output at the end of each time step. This small-scale code was tested with three time steps and was run on two different machines. The following two subsections provide brief information about the machines as well as how the test was setup. Figure 1. Conceptual diagrams of four I/O modules: serial I/O used in current CMAQ with netCDF data format (a), straight pnetCDF implementation (b), with data aggregation along row dimension and then use of pnetCDF (c), and with data aggregation along column dimension and then use of pnetCDF (d). PE denotes a processor. Arrows show the direction of data movement.
cess. Each individual processor can read its subdomain portion of data straight from the input files. However, for output, PARIO requires that all processors send their portion of data to the designated processor, i.e., processor 0, which will stitch all data together and write en masse to the output file (Fig. 1a). Clearly, there are a few shortcomings of this strategy: (1) as the number of processors increases, the network will be flooded with more MPI messages and require longer synchronization time to accomplish an output task; (2) if the domain size remains the same but the number of processors increases, the output data size in each processor decreases which will lower the I/O efficiency; and (3) it requires extra memory for processor 0 to hold the entire data set before writing to the file.
4
An application-level data aggregation approach
Besides the shortcomings mentioned in Sect. 3, IOAPI has another major drawback, which is not taking advantage of existing technology advancements such as parallel file systems and a parallel I/O framework, for example, pnetCDF. Kordenbrock and Oldfield (2006) have shown an enhancement of model I/O performance with the adoption of pnetCDF. Our new approach not only utilizes advanced parallel I/O technology, it also addresses all the shortcomings directly. This new approach performs I/O through pnetCDF using a collective parallel netCDF API (applications programming interface) on a parallel file system basis, thus eliminating the first and third shortcomings discussed above. Spatial domain decomposition is widely used in parallelizing scientific models such as CMAQ. The key characteristic www.geosci-model-dev.net/8/1033/2015/
4.1
High-performance computational systems (HPCs)
The experiments were performed on two HPCs to examine the CMAQ I/O performance with various methods. (1) Edison: a Cray XC30 system with 236 Tflop s−1 , 5200 compute nodes with 64 GB memory per node, 333 TB of aggregate memory, Cray Aries high-speed interconnect and 6.4 PB of scratch storage space. Each node has dual-socket 12-core Intel Ivy Bridge processors at 2.4 GHz. The software packages we used were cray-mpich/7.0.4, cray-netcdf/4.3.0, parallelnetcdf/1.3.1, and lustre: 2.5.0. (2) Kraken: a Cray XT5 system with the peak performance of 1.17 petaflops s−1 , 112 896 compute cores, 147 TB of compute memory, 3.3 PB of raw parallel file system disk storage space, and 9408 compute nodes. Each node has two 2.6 GHz six-core AMD Opteron processors (Istanbul), 16 GB of memory, and is connected by a Cray SeaStar2+ router. The software packages we used were Cray MPT 5.3.5, netcdf 3.6.3, pnetcdf 1.2.0, and lustre 2.5.0. The file system on both HPCs is managed by Lustre, a massive parallel-distributed file system that has the ability to distribute the segments of a single file across multiple object storage targets (OSTs). A striping technique is applied when a file with a linear sequence of bytes is separated into small chunks. Through this technique, the bandwidth of accessing the file and the available disk space for storing the file both increase as read and write operations can access multiple OSTs concurrently. The default value of stripe count is 1 OST of stripe count and 1 MB of stripe size on both Kraken and Edison. 4.2
Experimental design
To examine the I/O performance of each module, a smallscale model (pseudo-code I/O module) written in Fortran90, which includes the basic functions, reading data, writing data and performing arithmetic in between read and write operations, was tested to imitate the complex CMAQ model with Geosci. Model Dev., 8, 1033–1046, 2015
1036
D. C. Wong et al.: An approach to enhance pnetCDF performance
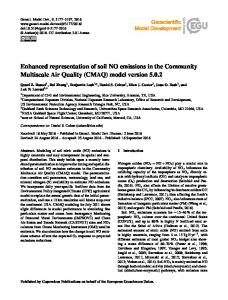
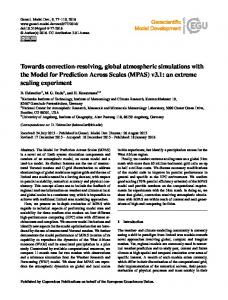
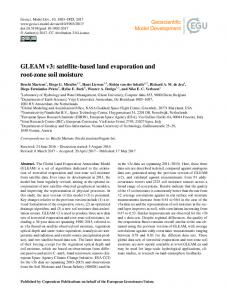
the emphasis on the I/O behavior. The code cycles three times to represent three time steps as in regular CMAQ simulations. The pseudo code of this small-scale model (is available on request) looks like this: DO I = 1, 3 Read in data Perform numerical calculation Output result END DO Three domain sizes were chosen to represent the typical 12 km resolution settings in the CMAQ community: a small domain that covers the entire State of California and its vicinity (CA), 89 × 134 × 35 × 146 (column by row by layer by species), a medium-sized domain that covers the Eastern US (EUS) 279 × 299 × 35 × 146, and a large domain that covers the entire continental US (CONUS), 459 × 299 × 35 × 146 (Fig. 2). Various combinations of stripe counts (2, 5, 11, 20, and 40) and stripe sizes (1, 2, 4, 8 and 16 MB) are tested on different processor configurations (4 × 4, 4 × 8, 8 × 8, 8×16, and 16×16 on CA and EUS domains and 4×8, 8×8, 8 × 16, 16 × 16, and 16 × 32 on CONUS domain). Regular domain decomposition is applied on the spatial domain (column by row) as in the CMAQ model. Each experiment was carried out multiple times and the averaged values were reported. Four different I/O techniques were setup: the serial I/O scheme used in the current CMAQ model which uses regular netCDF (rnetCDF), I/O implementation with straight pnetCDF (Fig. 1b), our new technique with data row-wise aggregation among MPI processes plus I/O through using pnetCDF (pnetCDFcr) (Fig. 1c), and our new technique with data column-wise aggregation among MPI processes plus I/O through using pnetCDF (pnetCDFcc) (Fig. 1d). Figure 1 illustrates the essence of these methods. Timing includes the actual I/O time (disk writing time) plus any additional time such as data gathering as in the method shown in Figure 1a or additional MPI communication as needed in data aggregation techniques. The results provided by the small-scale model serve as a basis to determine the optimal striping information (count and size) for further experiments with the pre-released CMAQ version 5.0.2. The 1-day simulations of CMAQ at a 4 km resolution EUS domain (423×594×14×146) were run to evaluate the differences among rnetCDF, pnetCDF, and the data aggregation schemes using pnetCDF with respect to I/O performance. These tests were conducted on Kraken and Edison with three different processor configurations: 10×12, 12 × 15, and 18 × 20.
Geosci. Model Dev., 8, 1033–1046, 2015
Figure 2. Regional representation of the CA (blue box), EUS (red box) and CONUS domains.
5 5.1
Results Small-scale model results
In Figs. 3–8 and 10, a relative performance calculation shown in formula (1) is plotted against the stripe counts and sizes: rel.performance(%) =
(Tm1 − Tm2 ) 100%, Tm1
(1)
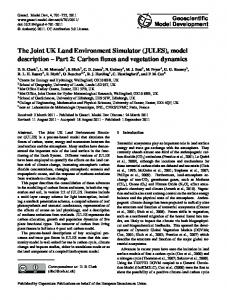
where Tm1 and Tm2 denote the averaged maximum I/O time for method 1 and method 2, respectively. Since, all the runs were done on non-dedicated system environments, the same setup was run multiple times for consistency purposes and outliers were filtered. To avoid visual blocking when displaying negative values below the xy plane, absolute values are plotted, solid bars represent positive values and checkered bars represent negative values. In each figure, a larger positive solid bar is the desirable outcome. The CA case, which represents a relatively small domain, shows a general trend where performance degrades as the stripe count increases and/or the stripe size increases. For this case, pnetCDF performance can be worse than the serial approach using regular netCDF (Fig. 4). With the data aggregation technique, aggregation along the row dimension is better. Overall, for data aggregation along row dimension, pnetCDFcr outperforms pnetCDF. Setting the stripe count to 5 and stripe size to 1 MB seems to be the “optimal” settings on both machines and among all processor configurations. Furthermore, as the number of processors increase, the relative performance of pnetCDF drops (from ∼ 50 to ∼ 20 % on Kraken (Fig. 3) and from ∼ 40 to about − 25 % on Edison (Fig. 4). Conversely, with the optimal settings, relative performance of pnetCDFcr increases as the number of processors increases (increases from ∼ 20 to 75 % except the 4 × 4 case on Kraken, Fig. 3, and increases from ∼ 20 to 80 % on Edison, Fig. 4). www.geosci-model-dev.net/8/1033/2015/
D. C. Wong et al.: An approach to enhance pnetCDF performance
1037
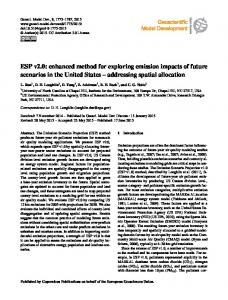
Figure 3. Relative I/O performance of pnetCDF to rnetCDF, and pnetCDFcc and pnetCDFcr to pnetCDF on the CA domain with 4×4, 4×8, 8 × 8, 8 × 16, and 16 × 16 processor configurations from Kraken. Red color denotes positive value in relative performance while blue color denotes negative value in relative performance.
www.geosci-model-dev.net/8/1033/2015/
Geosci. Model Dev., 8, 1033–1046, 2015
1038
D. C. Wong et al.: An approach to enhance pnetCDF performance
Figure 4. Relative I/O performance of pnetCDF to rnetCDF, and pnetCDFcc and pnetCDFcr to pnetCDF on the CA domain with 4×4, 4×8, 8 × 8, 8 × 16, and 16 × 16 processor configurations from Edison. Red color denotes positive value in relative performance while blue color denotes negative value in relative performance.
Geosci. Model Dev., 8, 1033–1046, 2015
www.geosci-model-dev.net/8/1033/2015/
D. C. Wong et al.: An approach to enhance pnetCDF performance
1039
Figure 5. Relative I/O performance of pnetCDF to rnetCDF, and pnetCDFcc and pnetCDFcr to pnetCDF on the EUS domain with 4 × 4, 4 × 8, 8 × 8, 8 × 16, and 16 × 16 processor configurations from Kraken. Red color denotes positive value in relative performance while blue color denotes negative value in relative performance.
www.geosci-model-dev.net/8/1033/2015/
Geosci. Model Dev., 8, 1033–1046, 2015
1040
D. C. Wong et al.: An approach to enhance pnetCDF performance
Figure 6. Relative I/O performance of pnetCDF to rnetCDF, and pnetCDFcc and pnetCDFcr to pnetCDF on the EUS domain with 4 × 4, 4 × 8, 8 × 8, 8 × 16, and 16 × 16 processor configurations from Edison. Red color denotes positive value in relative performance while blue color denotes negative value in relative performance.
Geosci. Model Dev., 8, 1033–1046, 2015
www.geosci-model-dev.net/8/1033/2015/
D. C. Wong et al.: An approach to enhance pnetCDF performance
1041
Figure 7. Relative I/O performance of pnetCDF to rnetCDF, and pnetCDFcc and pnetCDFcr to pnetCDF on the CONUS domain with 4 × 8, 8 × 8, 8 × 16, 16 × 16, and 16 × 32 processor configurations from Kraken. Red color denotes positive value in relative performance while blue color denotes negative value in relative performance.
www.geosci-model-dev.net/8/1033/2015/
Geosci. Model Dev., 8, 1033–1046, 2015
1042
D. C. Wong et al.: An approach to enhance pnetCDF performance
Figure 8. Relative I/O performance of pnetCDF to rnetCDF, and pnetCDFcc and pnetCDFcr to pnetCDF on the CONUS domain with 4 × 8, 8 × 8, 8 × 16, 16 × 16, and 16 × 32 processor configurations from Edison. Red color denotes positive value in relative performance while blue color denotes negative value in relative performance.
Geosci. Model Dev., 8, 1033–1046, 2015
www.geosci-model-dev.net/8/1033/2015/
D. C. Wong et al.: An approach to enhance pnetCDF performance
1043
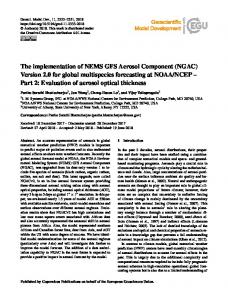
Figure 9. The impact of stripe count and size on parallel netCDF I/O performance on the CONUS domain. Left: various stripe sizes with fixed 11-stripe counts. Right: various stripe counts with fixed 2 MB stripe size.
Figure 10. Relative performance of pnetCDF and pnetCDFcr with respect to rnetCDF in a large number of processors scenario on Kraken. Red color denotes positive value in relative performance while blue color denotes negative value in relative performance.
The EUS case, which represents a moderately large domain, shows similar result as in the CA case. Relative performance of aggregation along the row dimension is much better than along the column dimension (Figs. 5, 6). With a small number of processor scenarios, 4×4 and 4×8, pnetCDF performs better than pnetCDFcr. At 8 × 8, pnetCDFcr performs better than pnetCDF slightly, ∼ 10 %. As the number of processors grows, the enhancement becomes more significant. Overall, the optimal setting on Kraken is a stripe count of 11 and stripe size of 2 MB, and on Edison it is a stripe count of 5 and stripe size of 2 MB. Again, with pnetCDF, the relative performance drops as the number of processors increases (decreases from ∼ 90 to ∼ 75 % on Kraken and from ∼ 50 to ∼ 40 % on Edison). However, the pnetCDFcr shows the op-
www.geosci-model-dev.net/8/1033/2015/
posite behavior: as the number of processors increases, the relative performance increases significantly. The CONUS case represents a relatively large domain, showing similar results for the CA and EUS cases (Figs. 7, 8). When the number of processors increases, the relative performance of pnetCDF decreases (from ∼ 80 down to ∼ 60 % on Kraken and from ∼ 75 down to ∼ 50 % on Edison). However, the relative performance of the pnetCDFcr scheme increases dramatically. Overall, the “optimal” settings are a stripe count of 11 and stripe size of 2 MB. 5.2
Stripe size and stripe counts effect with pnetCDF
Stripe size and stripe count are two of the key factors that affect I/O performance as shown in Figs. 3–8. The CONUS Geosci. Model Dev., 8, 1033–1046, 2015
1044
D. C. Wong et al.: An approach to enhance pnetCDF performance 400
200
300
MByte
250 200 150
160 140
100
120 100 80 60 40
50
20
0
0 pnetCDFcr
pnetCDFcc
pnetCDF
pnetCDFcr
1400
pnetCDF
800 600 400
4x4 4x8 8x8 8x16 16x16
120 100 MByte / sec
1000 MByte
pnetCDFcc
140 4x4 4x8 8x8 8x16 16x16
1200
200
80 60 40 20
0
0 pnetCDFccr
pnetCDFcc
pnetCDF
pnetCDFccr
2500
pnetCDFcc
pnetCDF
140
1500 1000
4x8 8x8 8x16 16x16 16x32
120 100
MByte / sec
4x8 8x8 8x16 16x16 16x32
2000
MByte
2x2 4x4 4x8 8x8 8x16
180
MByte / sec
2x2 4x4 4x8 8x8 8x16
350
80 60 40
500 20 0
0 pnetCDFcr
pnetCDFcc
pnetCDF
pnetCDFcr
pnetCDFcc
pnetCDF
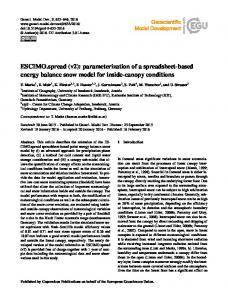
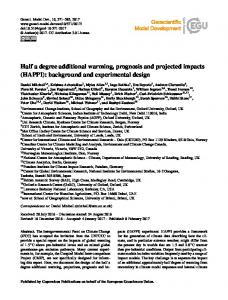
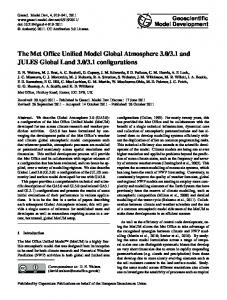
Figure 11. The maximum data size (left panel) and I/O rate (right panel) among all I/O processors in the CA (top), EUS (middle) and CONUS domains (bottom), respectively, in the pseudo-code experiment running on Edison.
domain is chosen with various stripe counts (2, 5, and 11) and stripe sizes (1, 2, 4, 8, and 16 MB) here to summarize these effects (Fig. 9). Among all stripe counts, the cases using stripe counts of 11 demonstrate the best performance compared to other stripe counts; for stripe sizes, the 2 MB cases were better than the other stripe sizes. As more processors were applied, larger stripe sizes resulted in decreasing performance in writing out data while 2 MB cases had relatively better results compared to the other four sizes. Shorter writing time was found when fewer processors were requested. The stripe count effect showed that stripe counts of 11 had the best performance compared to the other two stripe count cases. The differences became more significant when more processors were used.
Geosci. Model Dev., 8, 1033–1046, 2015
5.3
The impact of large number of processors on I/O efficiency
Section 5.1 has shown pnetCDF performance decreases as the number of processors increases. When the number of processors continues to increase, the performance of pnetCDF reaches a point that is worse than the serial I/O scheme (Fig. 10). In contrast, the pnetCDFcr scheme continues to improve significantly as the number of processors increases. The I/O efficiency is defined as the rate of data being output. In parallel applications with a spatial domain decomposition strategy, the domain size in each processor becomes smaller as the number of processors increase (Fig. 11 left panel). It is known that the I/O rate is higher if a large chunk of data is being output. Figure 11 (right panel) reflects this assertion which was tested on Kraken. When the data is aggregated, no matter whether it is along row or column dimension, it will increase the data size in the processor which is responsible for the I/O. This is clearly shown in Fig. 11 left www.geosci-model-dev.net/8/1033/2015/
D. C. Wong et al.: An approach to enhance pnetCDF performance
1045
Figure 12. Total write time in a 1-day CMAQ simulation by different I/O approaches on a 4 km EUS domain with stripe size of 2 MB and stripe count of 11 (Kraken left and Edison right).
panel. With data aggregation (pnetCDFcc or pnetCDFcr), the data size decreases slower than the pnetCDF approach as the number of processors increases. This translates into a higher I/O rate in aggregated schemes than the pnetCDF approach with respect to the same number of processors. pnetCDFcc is worse than pnetCDFcr due to the internal data alignment in the netCDF internal format (row major). 5.4
Application to CMAQ
Based on this small-scale code experiment, the setting of 11-stripe count and 2 MB stripe size is selected to employ in a real CMAQ application: a 1-day simulation on a 4 km resolution EUS domain (423 × 594 × 14 × 142). Figure 12 shows the overall writing time recorded on Kraken and Edison with respect to three different ways to perform I/O: the current way using rnetCDF, using straight pnetCDF with 11stripe count and 2 MB stripe size (pnetCDF), and our new approach (pnetCDFcr) with 11 stripe counts and 2 MB stripe size. Clearly pnetCDFcr shortens the writing time significantly. 6
addition, an overall “optimal” setting has been shown based on the experiments: 5-stripe count and 1 MB stripe size for small domain, 11-stripe count and 2 MB stripe size or 5stripe count and 2 MB stripe size for the moderately large domain, and 11-stripe count and 2 MB stripe size for the large domain. This data aggregation I/O module was also tested for a 1-day, 4 by 4 km EUS domain using CMAQ compared to the serial I/O mode, which is currently implemented in CMAQ, and conventional parallel netCDF method. The results show significant reduction of I/O writing time when this new data aggregated pnetCDF (pnetCDFcr) technique is used compared with serial I/O approach and with application of straight pnetCDF. With this finding, the overall runtime of scientific applications which require I/O will be significantly reduced. A more important implication is that it allows users to use a large number of processors to run applications and still maintain a reasonable parallel speedup thereby deferring speedup degradation governed by Amdahl’s law. Furthermore, the technique can be transferred to other environmental models that have large I/O burdens.
Conclusions
We performed a series of experiments with four different I/O modules to examine their I/O efficiencies in CMAQ. First, a small-scale code was tested on three different domains: CA, EUS and CONUS, which represent small, moderately large, and large data sizes of CMAQ outputs. The I/O modules include serial mode which is currently used in CMAQ, direct application of parallel netCDF (pnetCDF), and a new technique based on data aggregation which can be along row or column dimension (pnetCDFcr and pnetCDFcc) before applying the parallel netCDF technique. The experiment results show: (1) pnetCDFcr performs better than pnetCDFcc; (2) pnetCDF performance deteriorates as the number of processors increases and becomes worse than serial mode when certain large numbers of processors are used; and (3) even though pnetCDFcr does not perform as well as pnetCDF in the small number of processors scenarios, it does outperform pnetCDF once the number of processors becomes larger. In www.geosci-model-dev.net/8/1033/2015/
Acknowledgements. Yang Gao was partly supported by the Office of Science of the US Department of Energy as part of the Regional and Global Climate Modeling Program. The Pacific Northwest National Laboratory is operated for DOE by the Battelle Memorial Institute (DE-AC05-76RL01830). The Kraken is a supercomputing facility through National Science Foundation TeraGrid resources provided by the National Institute for Computational Sciences (NICS) under grant numbers TG-ATM110009 and UT-TENN0006. Disclaimer. This paper has been subjected to an EPA review and approved for publication. The views expressed here are those of the authors and do not necessarily reflect the views and policies of the US Environmental Protection Agency (EPA). Edited by: P. Jöckel
Geosci. Model Dev., 8, 1033–1046, 2015
1046
D. C. Wong et al.: An approach to enhance pnetCDF performance
References Behzad, B., Luu, H. V. T., Huchette, J., Byna, S., Prabhat, Aydt, R. A., Koziol, Q., and Snir, M.: Taming parallel I/O complexity with auto-tuning, SC 2013, ACM, Denver, CO, USA, 17–22 November 2013, p. 68, 2013. Byun, D. W. and Schere, K. L.: Review of the governing equations, computational algorithms, and other components of the Models3 Community Multiscale Air Quality (CMAQ) Modeling System, Appl. Mech. Rev., 59, 51–77, 2006. Chen, Y., Sun, X.-H., Thakur, R., Song, H., and Jin, H.: Improving Parallel I/O Performance with Data Layout Awareness, Cluster ’10: Proceedings of the IEEE International Conference on Cluster Computing 2010, Heraklion, Crete, Greece, 20–24 September 2010: IEEE Computer Society, 2010. Cheng, A. and Folk, M.: HDF5: High performance science data solution for the new millennium, Proceedings of SC2000: High Performance Networking and Computing, Dallas, TX, ACM Press and IEEE Computer Society Press, 4–10 November 2000. del Rosario, J., Brodawekar, R., and Choudhary, A.: Improved Parallel I/O via a Two-Phase Run-time Access Strategy, Workshop on I/O in Parallel Computer Systems at IPPS ’93, Apr. 1993, 56– 70, 1993. Fu, J. S., Dong, X., Gao, Y., Wong, D., and Lam Y. F.: Sensitivity and linearity analysis of ozone in East Asia: The effects of domestic emission and intercontinental transport, J. Air Waste Manage., 62, 1102–1114, 2012. Gao, Y., Fu, J. S., Drake, J. B., Lamarque, J.-F., and Liu, Y.: The impact of emission and climate change on ozone in the United States under representative concentration pathways (RCPs), Atmos. Chem. Phys., 13, 9607–9621, doi:10.5194/acp-13-96072013, 2013. Huang, X. M., Wang, W. C., Fu, H. H., Yang, G. W., Wang, B., and Zhang, C.: A fast input/output library for high-resolution climate models, Geosci. Model Dev., 7, 93–103, doi:10.5194/gmd-7-932014, 2014.
Geosci. Model Dev., 8, 1033–1046, 2015
Kordenbrock, T. H. and Oldfield, R. A.: Parallel I/O Advancements in Air Quality Modeling Systems, Poster on 5th annual CMAS conference, Chapel Hill, NC, USA, 16–18 October 2006. Li, J., Liao, W.-K., Choudhary, A., Ross, R., Thakur, R., Gropp, W., Latham, R., Siegel, A., Gallagher, B., and Zingale, M.: Parallel netCDF: A High-Performance Scientific I/O Interface, Proceedings of the 2003 ACM/IEEE conference on Supercomputing, Phoenix, AZ, USA, 15–21 November 2003, p. 39, doi:10.1145/1048935.1050189, 2003. Nisar, A., Liao, W.-K., and Choudhary, A.: Delegation-Based I/O Mechanism for High Performance Computing Systems, IEEE Transactions on Parallel and Distributed Systems, 23, 271–279, doi:10.1109/TPDS.2011.166, 2012. Nitzberg, B. and Lo, V. M.: Collective Buffering: Improving Parallel I/O Performance, HPDC, 148–157, 1997. Otte, T. L., Pouliot, G., Pleim, J. E., Young, J. O., Schere, K. L., Wong, D. C., Lee, P. C. S., Tsidulko, M., McQueen, J. T., Davidson, P., Mathur, R., Chuang, H.-Y., DiMego, G., and Seaman, N. L.: Linking the Eta Model with the Community Multiscale Air Quality (CMAQ) modeling system to build a national air quality forecasting system, Weather Forecast., 20, 367–384, 2005. Palmera, B., Koontza, A., Schuchardta, K., Heikesb, R., and Randallb, D.: Efficient data IO for a Parallel Global Cloud Resolving Model, Environmental Modelling and Software, 26, 1725–1735, 2011. Thakur, R., Gropp, W., and Lusk, E.: Data sieving and collective I/O in ROMIO. Proceedings of the Seventh Symposium on the Frontiers of Massively Parallel Computation, IEEE Computer Society Press, 182–189, 1999. Wong, D. C., Pleim, J., Mathur, R., Binkowski, F., Otte, T., Gilliam, R., Pouliot, G., Xiu, A., Young, J. O., and Kang, D.: WRFCMAQ two-way coupled system with aerosol feedback: software development and preliminary results, Geosci. Model Dev., 5, 299–312, doi:10.5194/gmd-5-299-2012, 2012. Yu, W., Vetter, J., Canon, R. S., and Jiang, S.: Exploiting Lustre File Joining for Effective Collective IO, The Seventh IEEE International Symposium on Cluster Computing and the Grid, Pio de Janeiro, Brazil, 14–17 May 2007.
www.geosci-model-dev.net/8/1033/2015/