Dec 2, 2015 - stability, capital adequacy and others economic and financial variables are ... with data mining approach using AHP-ANP, SENSITIVITY or TOPSIS and ... cost sensitive decision tree approach for fraud detection (Sahin et al.
Asian Research Consortium Asian Journal of Research in Business Economics and Management Vol. 6, No. 3, March 2016, pp. 153-172 ISSN 2249-7307 A Journal Indexed in Indian Citation Index
Asian Journal of Research in Business Economics and Management www.aijsh.com
An Assessment on Banking Returns with Data Mining Approach: A Critical Investigation on Deposit Banks in Turkey Şenol Emir, Corresponding Author: Asst. Prof., Faculty of Economics, Istanbul University, 34126 Beyazit, Istanbul, Turkey
Hasan Dinçer, Associate Professor of Finance, Istanbul Medipol University, School of Business and Management, Kavacik, Beykoz, 34810 İstanbul
Ümit Hacıoğlu Associate Professor of Finance, Istanbul Medipol University, School of Business and Management, Kavacik, Beykoz, 34810 İstanbul
DOI NUMBER:
10.5958/2249-7307.2016.00028.1
Abstract The latest advances in performance assessment techniques in finance-based literature spotlighted the importance of qualitative and quantitative hybrid models for an effective investment decisions. In this study, it has been aimed to analyze the returns of deposit banks in Turkey by utilizing two data mining technique namely Classification and Regression Trees (CART) and Multi-Layer Perceptron (MLP). For this purpose a dataset containing 47 variables of 29 deposit banks in Turkey for the period of 2004-2014 are collected. For choosing the most relevant features for the banking returns, CART method, which provides a variable importance measure, is utilized. For the classification purpose on the dimensionally reduced dataset, MLP method, which is considered a powerful tool, is employed. Results indicate (i) two of the most important independent variables for classifying banks according to ROA is (“Income Before Taxes / Total Assets”) and (“Net Operating Income(Loss) / Total Assets”) having the values of 100% and 93.7% respectively, (ii) two of the most important independent variables for classifying banks according to ROE is (“Net Profit (Losses) / Paid-in Capital”) and (“Income Before Taxes / Total Assets”) having the values of 100% and 86.2% respectively, (iii) using CART is a very convenient way for feature selection step in data mining and MLP is an efficient tool for using classification in finance domain.
Keywords: banking returns, CART, MLP, feature selection I. Introduction Investment decisions in volatile market conditions urge decision makers to make critical assessments on risk and return combination. As well as generally know, investment portfolios include equity based and debt based financial instruments among capital and monetary markets. Banks with issued bonds and outstanding shares in financial markets are closely assessed based on their performance with future growth prospects. Hence, a critical assessment on banking 153
Emir et al. (2016). Asian Journal of Research in Business Economics and Management, Vol. 6, No. 3, pp. 153-172
performance is required for decision makers to develop efficient investment strategies. Ratio analysis with balanced-score card approach is an example of traditional assessment techniques. New investment strategies require more attention on qualitative techniques in addition to quantitative one. In the last decade, data mining approach is used in the field and academic studies to understand the way how banks or other financial institutions enhance their performance. Explorative data analysis on bank’s asset or liability side of balance sheet may be not useful as major figures are to be assessed easily by traditional approaches. However, the cash flows or others figures and quantitative parameters which could be a source of failure and risk, are extracted from the banking activities. Then, the data mining technique becomes a useful model to interpret necessary data into meaningful sentences for decision makers inside and outside of institutional environment. Data mining technique also becomes an integral part of technology based advances in banking environment while outstanding date is attached to consumption preferences in market conditions. Potential clients or rivalry strategies are affected by economic conditions. Inflation, growth, trust, stability, capital adequacy and others economic and financial variables are directly affecting market conditions and preferences of clients in banking sector. Their choice of time for loans or deposits is affected with major economic conditions. Data mining has been also applied as an early warning system in banking industry as numerical figures on economic activities and financial interactions closely shape major banking operational strategies on the combination of their assets which might change the actual or required level of capital adequacy. In this study, the Classification and Regression Tree (CART) are used, which is one of the decision trees algorithms developed by Breiman et al. (1984). We utilized embedded feature selection property of CART to identify the most relevant features for banking returns to be able to reduce the dimension of the dataset and building a simpler model. Artificial Neural Networks (ANN) are among the most powerful of the data mining techniques, which were originated in the artificial intelligence (AI) field. These models are often portrayed as a brain in a computer. They can be thought as mathematical representations mimicking the functioning of human brain. Thus, most of the ANN terminology comes from biology (Francis 2001).In this study, Multi-Layer Perceptron (MLP), which is a nonparametric ANN, is employed for the classification analysis. Economics and Finance fields benefit from the MLP in a wide spectrum from prediction to classifications. Some of the applications are about: stock trading (Mabu et al. 2015), stock prediction (Guresen et al. 2011), stock selection (Ince 2014, Quah 2008), stock movement (Mostafa 2010, Kara et al. 2011, Patel 2015), bankruptcy prediction (Perez 2006, Tsai 2009, Rafiei 2011), prediction of financial crisis (Claveria 2015), predicting exchange rates (Sermpinis 2012), timeseries forecasting(Qi and Zhang 2008), input-output mapping (Erbas and Stefanou 2009). This study begins with a brief introduction on the data mining technique in banking for decision makers. Following section continues to assess the empirical studies on data mining and assessment on banking return. In the methodology part, it has been clearly explained how the model was constructed. Section four describes an application on banking returns in Turkish banking sector. Findings and discussion are presented in the last section.
154
Emir et al. (2016). Asian Journal of Research in Business Economics and Management, Vol. 6, No. 3, pp. 153-172
II. Literature Review With respect to existing studies and finance literature, it is possible to argue that new hybrid models with data mining approach using AHP-ANP, SENSITIVITY or TOPSIS and MOORA techniques have not been sufficiently used to assess banking performance and return or risks attached to banking activities. The learning process of decision makers is attached to outside and inside factors of operational environment in banking industry. Decision trees are one of the most commonly used methods in data mining for classification and regression tasks. They are nonparametric models in a sense that there is no need to assume any parametric form for the class densities (Alpaydın 2009). Structure of the tree is not fixed as a priori and trees can grow during learning process considering the structure of the data. Decision trees seem to be quite a powerful and versatile tool in modern finance applications by inspecting the results of the studies. They are not a mere effective non-parametric classification/regression tool but also an easy way of explorative data analysis because of their remarkable interpretation capabilities (Andriyashin 2005). A brief summary on financial applications using decision trees can be spotlighted here. Bielikova and colleagues used decision trees to classify the agricultural enterprises (Bieliková et al. 2014). Tofan examined the usage of decision tree method in cost-based decisions in an enterprise (Tofan 2015). Bastı and his colleagues used decision trees to investigate under-pricing of Turkish companies in the initial public offerings (IPOs) issued and traded on Borsa Istanbul between 2005 and 2013 (Bastı et al. 2015). Sevim and his colleagues developed and early warning system to predict currency crises by employing artificial neural networks, decision trees and logistic regression models (Sevim et al. 2014). Kuzey and colleagues investigated the impact of multinationality and fourteen other financial indicators on firm value using decision trees and artificial neural networks (Kuzey et al. 2014). Kim and Upneja examined the key financial distress factors for publicly traded U.S. restaurants for the period from 1988 to 2010 using decision trees and AdaBoosted decision trees (Kim and Upneja 2014). Sahin and colleagues developed a novel cost sensitive decision tree approach for fraud detection (Sahin et al. 2013). Delen and his colleagues employed decision tree algorithms to analyze the impact of financial ratios on firm performance (Delen et al. 2013). Chuang used Classification and Regression Trees for developing hybrid case based models aiming to predict the business bankruptcy (Chuang 2013). The banking performance analysis has been centralized in the finance-based literature in the last decade with the latest advances in financial markets. The recent developments in financial markets affect the banking sector critically. Financial turmoil in 2008 has risen to the crisis in global level for all financial institutions. Legal and administrative authorities are not keen on to perform precautionary practices while banking assets and liabilities are in the excessive risk. By the global crisis, the activities of banking sector are redesigned due to perceived weakness and threats. Hence, it is seen that banking activities highly correlated the risk and returns in the volatile environment. Different types of banking activities contribute to the diversification of the risks and increasing returns. Main banking operations are divided into two areas as interest and non-interest based activities. Conventional banks generally focus on the interest based incomes besides the other alternative income flows. Whereas competitive banking activities in the globalized world force to the opponents in order to be more offensive to offer the product and service range of banks within the constraints of high returns. Commercial banks combine interest and non-interest activities get around one-third of their income from fee-generating activities as investment banks excess over three-fourth (Demirgüç-Kunt and Huizinga 2010; Stiroh 2006). As a result of this, most banks tend to enhance the fee income shares for high returns continuously.
155
Emir et al. (2016). Asian Journal of Research in Business Economics and Management, Vol. 6, No. 3, pp. 153-172
Diversification of the banking activities could raise the overall performance of banking incomes. Thus, overall performance criteria of the banking sector should be considered to evaluate the banking returns in detail. There are many financial ratios to analyze the financial institutions; CAMELS based approach is one of the most comprehensive methods to assess the overall banking returns. In the literature, bank returns are highly related to bank profits. Most studies shows that the dependent variables of banking profits are defined as return on asset and return on equity separately or conjointly (Demirgüç-Kunt and Huizinga 2010; Sufian and Chong 2008; Kosmidou et al.2007; Athanasoglou et al. 2006; Athanasoglou et al. 2008). Essential parameters considering CAMELS method can be presented as the ratios of Capital, Balance sheet, Asset quality, liquidity, profitability, income-expenditure structure, and activity. These parameters commonly reflect the banking performance and it is easy to use for analyzing banking returns. Balance sheet structure implies bank asset and liability management which is simultaneous planning of all asset and liability positions under consideration of the different bank management objectives and legal, managerial and market constraints (Kosmidou and Zopounidis 2002). The features of asset, liquidity, and profitability are among the critical factors of the balance sheet quality. Success of the banking activities depends on the quality of asset and liability management in unstable economic environments especially. The maturity transformation process affects the banking returns and overall performance due to different lending and borrowing periods. Therefore, general tendency on the maturities is to have higher short-term liability accounts compared with short-term asset accounts and higher long term asset compared with long term liability accounts (Oguzsoy and Gu 1997). Capital structure is one way of understanding the ability of the bank to use excess capital to fund risky investments (Cornett et al. 2003).The ratio of equity means book value to total asset can be considered as one of bank capital. A high degree of capitalization signals high-risk aversion. More highly capitalized banks are less risky and have lower returns. The opposite capital-profit relationship underlines the higher cost of insurance against bankruptcy for a bank with a low capital-assets ratio (Brighi and Venturelli 2014). The incomes and activities of banks can be viewed into three approaches. The first approach considers service-producing organizations use resources of labour, capital, and equipment to develop such products as payments, loan funding, and other financial services. The second approach emphasizes the profitability of a bank in relation to the various expenditures such as interest expenses. The third approach defines financial intermediaries whose primary business is to borrow funds from savers and lend those funds to others profits. In other words, the approach examines the efficiency of essential intermediary functions of banks (Yeh 1996). Studies on banking profit that implies the returns widely emphasize the productivity and efficiency of banking activities (DeYoung and Hasan 1998; Cyree and Spurlin 2012; Akhigbe and McNulty 2011; Das and Ghosh 2009; Ariff and Can 2008; Chu and Lim 1998; Akhigbe and McNulty 2003; Grifell-Tatjé 2011; Tortosa-Ausinaet al. 2012; Maudos et al. 2002). Another important area is use of the domestic and international parameters to evaluate bank profit and returns (Williams 2003; Kosmidou et al. 2007). Discussion of banking outcomes by the market competition is the main focal point of the sector returns (Berger 2000; Goddard et al. 2011). However, some different areas of the banking return and profits can be illustrated as the effects of the constraints on the banking sector (Gnezditskaia 2003), risk-avoidance decisions (Gander 2013), profit distribution management (Farook et al. 2012), the effects of information technology and advertising (MartínOliver and Salas-Fumás 2008), the impacts of taxes (Chiorazzo and Milani 2011).
156
Emir et al. (2016). Asian Journal of Research in Business Economics and Management, Vol. 6, No. 3, pp. 153-172
III. Research and Methodology The Classification and Regression Trees (CART) for Feature Selection Decision trees method is based on a set of hierarchical decisions on the features that are arranged in a tree-like structure. For a particular node in tree, decision that is referred as split criterion is typically a condition on one or more features in the training data must be determined. Each node divides the data into subsets by using combination of criteria in the nodes above it (Aggarwal 2015). The main goal is to identify the split criterion for each node so that the homogeneity of the class (dependent) variables in each branch of the tree is increased as much as possible. Essentially, there are two types of nodes namely internal nodes and leaf (terminal) nodes. Each leaf node assigned to the dominant class at that node. At the top there is a root node corresponding to the entire data space can be considered a special type of internal node. A terminal node having observations of the same value for the dependent variable is a homogeneous, “pure” node. İt requires no further splitting because it is “pure”. Growing of the tree is stopped when a stopping criterion is met. Given an input to decision tree, at each node, a decision (splitting criteria) is applied and one of the branches is taken with respect to the outcome. This process starts at the root node and recursively continued until a leaf (terminal) node is reached (Alpaydın 2009). CART constructs trees by using only binary splits that is multiway splitting is not supported in this method. CART uses several impurity measures such as information gain, Gini, towing or ordered towing. Authors of CART favor the Gini criterion because it can be extended to include symmetrized costs and it is computed more rapidly (Kantardzic 2011). In this study, Gini diversity index is employed. It is based on squared probabilities of membership for each category of the dependent variable reaching its minimum (zero) when all cases in a node fall into a single category. İf there are classes, with the probability of the th class being at node , the Gini index is defined as (Bramer 2007):
It takes its largest value (frequency of each class is
when the classes are evenly distributed between instances ).
At data mining projects, the majority of time and effort spent in the model-building process involves examining which variables to include in the model. Fitting a computationally intensive model to a set of variables this large may require more time than is practical. The term redundant data refers to a problem when two or more features that are strongly correlated. A special case of redundant data is irrelevant data, where features are insignificant with respect to data analysis (Cios 2010). Redundant and irrelevant data can be identified by feature selection algorithms. Feature selection allows the variable set to be reduced in size, creating a more manageable set of attributes for modelling. Adding predictor selection to the analytical process has several benefits (IBM SPSS Statistics 21 Algorithms): Simplifies and narrows the scope of the variables essential to building a predictive model. Minimizes the computational time and memory requirements for building a predictive model because focus can be directed to a subset of predictors. Leads to more accurate and/or more parsimonious models.
157
Emir et al. (2016). Asian Journal of Research in Business Economics and Management, Vol. 6, No. 3, pp. 153-172
Reduces the time for generating scores because the predictive model is based upon only a subset of predictors.
Decision Trees have embedded feature selection capabilities (Derelioglu and Gurgen 2011, Gayatri et al. 2010, Arvaneh et al. 2010, Bittencourt and Clarke 2004, Khanbabaei and Alborzi 2013, Saeys and Larranaga 2007, Toutanova and Manning 2002). CART also has a pre-processing stage to decrase dimensionality through subset input selection and therefore reduction of node complexity (Kantardzic 2011). In this study, CART, which is one of the most widely used decision tree algorithm, is used for ranking the predictors according to their importance and by doing so reducing the dimension of the dataset. Multi – Layer Perceptron (MLP) Architecture MLP architecture consists of computational units (neurons) in layers, which are responsible for processing inputs and generating one output value. Each neuron transmits its output to the neurons in the next layer. Models commonly have three interconnected layers namely input, hidden and output layers. During the learning process, units in the hidden layer nonlinearly transform the d dimensional input space to h dimensional space (Equation 2). In each step, weighted sum of input values are fed into hidden units. At hidden layer, nonlinear activation/transfer function is applied. Activation functions in the network give the capability of modelling non-linear relationships inherent in data. In Equation 2, ( shows the input values, denotes the weights between input and hidden layer units, is bias term, which plays a similar role as the intercept term in a classical regression model (Baesens et al. 2003).
Units in the output layer produce the output as a combination of the h dimensional nonlinear activation values that are computed in hidden layer (Equation 3). denotes the weights between hidden units and output unit and is the number of hidden units. To be able to map the output of network to a classification label a threshold function is applied.
Commonly linear
used
activation functions , logistic (sigmoid)
are
(Pereira 2009) hyperbolic tangent and softmax function which is a generalization of logistic function. In activation functions formulas is used for denoting the slope. For all connections on the network, weights ( and are assigned. For a given input, the network model gives an output (or a set of outputs) and this response is compared to the desired response. Weights are the crucial parameters so they need to be calculated during the learning process to reduce the error (Smith and Gupta 2002). To update the weights, an algorithm such as back-propagation (BP) is used. BP algorithm uses the output value of each layer is used for previous layer updates. Process is continued until one of the predefined convergence criterion is met. This criterion can be either maximum number iterations or minimum error rate (Steeb 2005).
158
listed
as
follow
Emir et al. (2016). Asian Journal of Research in Business Economics and Management, Vol. 6, No. 3, pp. 153-172
IV. An Application on Deposit Banks in Turkish Banking Sector For analyzing bank returns, a dataset containing 47 financial ratios are collected. Financial ratios are determined from seven different categories. Details of financial ratios and categories, which are utilized as predictors in the analysis, are given in Table 1-7. The category containing highest number of predictor is “Income-Expenditure Structure” having 13 variables. After removing cases having missing values, number of observation is 271 for the 2004-2014 period. Table 1: Capital Ratios (7 Ratios) Variable Name
Symbol
Shareholders’ Equity / ((Capital to be Employed to credit + market + operational risk)*12.5)*100
C1
Shareholders' Equity / Total Assets
C2
(Shareholders' Equity-Permanent Assets) / Total Assets
C3
Shareholders' Equity / (Deposits + Non-Deposit Funds)
C4
On Balance-sheet FC Position / Shareholders' Equity
C5
Net on Balance-sheet Position / Total Shareholders' Equity
C6
N(on+off) Balance-sheet Position / Total Shareholders' Equity
C7
Table 2: Balance-Sheet Ratios (8 Ratios) Variable Name TC Assets / Total Assets FC Assets / Total Assets TC Liabilities / Total Liabilities FC Liabilities / Total Liabilities FC Assets / FC Liabilities TC Deposits / Total Deposits TC Loans and Receivables / Total Loans and Receivables Total Deposits / Total Assets
Table 3: Assets Quality Ratios (6 Ratios) Variable Name Financial Assets (Net) / Total Assets Total Loans and Receivables / Total Assets Total Loans and Receivables / Total Deposits Loans under follow-up (gross) / Total Loans and Receivables Specific Provisions / Loans under follow-up (gross) Permanent Assets / Total Assets
159
Symbol BS1 BS2 BS3 BS4 BS5 BS6 BS7 BS8
Symbol AQ1 AQ2 AQ3 AQ4 AQ5 AQ6
Emir et al. (2016). Asian Journal of Research in Business Economics and Management, Vol. 6, No. 3, pp. 153-172
Table 4: Liquidity Ratios (5 Ratios) Variable Name Liquid Assets / Total Assets Liquid Assets / Short-term Liabilities TC Liquid Assets / Total Assets Liquid Assets / (Deposits + Non-Deposit Funds) FC Liquid Assets / FC Liabilities
Table 5: Profitability Ratios (2 Ratios) Variable Name Income Before Taxes / Total Assets Net Profit (Losses) / Paid-in Capital
Symbol L1 L2 L3 L4 L5
Symbol P1 P2
Table 6: Income-Expenditure Structure Ratios (13 Ratios) Variable Name
Symbol
Net Interest Income After Specific Provisions / Total Assets
IE1
Net Interest Income After Specific Provisions / Total Operating Income
IE2
Non-Interest Income / Non-Interest Expense
IE3
Total Income / Total Expense
IE4
Interest Income / Total Assets
IE5
Interest Expense / Total Assets
IE6
Interest Income / Total Expenses
IE7
Interest Expense / Total Expenses
IE8
Non-Interest Income (Net) / Total Assets
IE9
Non-Interest Income (Net) / Other Operating Expenses
IE10
Other Operating Expenses / Total Operating Income
IE11
Provision For Loan or Other Receivables Losses / Total Assets
IE12
Interest Income / Interest Expense
IE13
160
Emir et al. (2016). Asian Journal of Research in Business Economics and Management, Vol. 6, No. 3, pp. 153-172
Table 7: Activity Ratios (6 Ratios) Variable Name
Symbol
(Personnel Expenses + Reserve for Employee Termination Benefit) / Total Assets
A1
(Personnel Expenses + Reserve for Employee Termination Benefit) / Number of Personnel(Thousand TRY) Personnel Expenses / Other Operating Expenses
A2
Other Operating Expenses / Total Asset
A4
Total Operating Income / Total Assets
A5
Net Operating Income(Loss) / Total Assets
A6
A list of banks, which are included in the analysis, is given in Table 8. Table 8: Banks Included in Analysis ID 1 2 3 4 5 6 7 8 9 10 11 12 13 14 15 16 17 18 19 20 21 22 23 24 25 26 27 28 29
Bank Name Adabank A.Ş. Akbank T.A.Ş. Alternatifbank A.Ş. Anadolubank A.Ş. Arap Türk Bankası A.Ş. Bank Mellat Burgan Bank A.Ş. Citibank A.Ş. Denizbank A.Ş. Deutsche Bank A.Ş. Fibabanka A.Ş. Finans Bank A.Ş. Habib Bank Limited HSBC Bank A.Ş. ING Bank A.Ş. JPMorgan Chase Bank N.A. Şekerbank T.A.Ş. Société Générale (SA) Tekstil Bankası A.Ş. The Royal Bank of Scotland Plc. Türk Ekonomi Bankası A.Ş. Turkish Bank A.Ş. Türkiye Cumhuriyeti Ziraat Bankası A.Ş. Türkiye Garanti Bankası A.Ş. Türkiye Halk Bankası A.Ş. Türkiye İş Bankası A.Ş. Türkiye Vakıflar Bankası T.A.O. Turkland Bank A.Ş. Yapı ve Kredi Bankası A.Ş.
161
A3
Emir et al. (2016). Asian Journal of Research in Business Economics and Management, Vol. 6, No. 3, pp. 153-172
An Analysis on the Return on Assets (ROA) as Categorical Dependent Variable In this step of the analysis, ROA is used as categorical dependent variable and 47 financial ratios described earlier are predictors. For this purpose, ROA values of banks are sorted and ones that above the median value labelled as “1” (Successful) and others as “0” (Unsuccessful). Before feature selection process, MLP method is applied on whole data set (dataset containing all the independent variables). During learning process of MLP 70% of dataset is used for training. For testing purpose, remaining 30% is employed. Scaled conjugate gradient procedure is chosen as an optimization procedure. A network, which has three hidden layer units and use hyperbolic tangent and identity activation function for hidden and output layers respectively. Classification results of MLP are given for training and testing sets in Table 6. Usually testing results are more informative about the success of a model. By inspecting table MLP, it can be concluded that model classifies banks 87.5% correctly and very slightly better in classifying “Successful” banks. Table 9: MLP Confusion Matrix before Feature Selection Classification Results Predicted Observed 0 1 Percent Correct 0 81 11 88,0% Training 1 6 93 93,9% Overall Percent 45,5% 54,5% 91,1% 0 38 6 86,4% Testing 1 4 32 88,9% Overall Percent 52,5% 47,5% 87,5% Dependent Variable: ROA
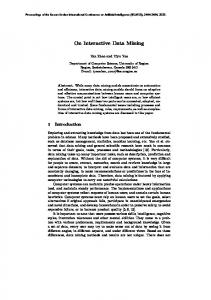
ROC (Receiver Operating Characters) curves presents performance of a classification model graphically. From Figure 1 it can be seen that curves for “Unsuccessful” and “Successful” are quite close to upper left corner, which is an indication of good achievement of classification.
Figure 1: ROC Curve for MLP Classification before Feature Selection 162
Emir et al. (2016). Asian Journal of Research in Business Economics and Management, Vol. 6, No. 3, pp. 153-172
For identifying the most relevant variables CART method is run on the whole dataset. 10 fold cross validation is used for model selection and Gini index is utilized for impurity measure. Results showing the normalized importance of independent variables sorted decreasingly are given in Table 10. A threshold value of 15% is determined. A set of 11 predictors are detected having a normalized importance value above the threshold. Results indicate that two of the most important independent variables for classifying banks according to ROA is P1 (“Income Before Taxes / Total Assets”) and A6 (“Net Operating Income (Loss) / Total Assets”) having the values of 100% and 93.7% respectively. Table 10: Variable Importance Values Produced by CART Independent Variable Importance Independent Importance Normalized Importance Variable P1 0,415 100,0% A6 0,389 93,7% IE4 0,206 49,5% IE11 0,199 47,8% P2 0,148 35,6% IE10 0,113 27,3% IE3 0,113 27,3% AQ1 0,093 22,3% AQ5 0,078 18,8% A5 0,073 17,5% IE9 0,065 15,6%
After feature selection, a reduced dataset containing independent variables in Table 10 is generated. By running MLP on this reduced dataset, a neural network model is created which have eight hidden layer units, using hyperbolic and identity activation functions in hidden and output layers respectively. A graphical representation of the network is given in Figure 2.
Figure 2: Network Model produced by MLP on Reduced Dataset 163
Emir et al. (2016). Asian Journal of Research in Business Economics and Management, Vol. 6, No. 3, pp. 153-172
Confusing matrix showing classification performance of MLP on reduced dataset is presented in Table 11. MLP performs better on reduced data having an overall classification performance on test set as 89.4%. Model performs better for “Successful” banks. As a result, classification of banks according to ROA can be performed by using the most relevant 11 predictors instead of using a set of 47 variables that contains irrelevant predictors. This is an indication that is CART is useful for feature selection process before MLP analysis. Table 11: MLP Confusion Matrix on Reduced Data Set Observed
Training
Testing
Predicted 0
1
Percent Correct
0
88
6
93,6%
1
3
80
96,4%
Overall Percent
51,4%
48,6%
94,9%
0
35
7
83,3%
1
3
49
94,2%
Overall Percent
40,4%
59,6%
89,4%
Dependent Variable: ROA Figure 3 shows the ROC curve for MLP model on reduced data set.
Figure 3: ROC Curve for MLP Classification on Reduced Data Set
An Analysis on the Return On Equity (ROE) as a categorical dependent variable In this step of the analysis, ROE is used as categorical dependent variable and 47 financial ratios as predictors. ROE values of banks are sorted and ones that above the median value labelled as “1” 164
Emir et al. (2016). Asian Journal of Research in Business Economics and Management, Vol. 6, No. 3, pp. 153-172
(Successful) and others as “0” (Unsuccessful).Before the feature selection process, dataset is partitioned as training and testing set containing 70% and 30% respectively. MLP network is built on training set and tested on test set. Scaled conjugate gradient procedure is chosen as an optimization procedure. A network, which has two hidden layer units and use hyperbolic tangent and softmax activation function for hidden and output layers respectively. Classification results of MLP are given for training and testing sets in Table 12. By inspecting table, it can be concluded that model classifies banks 94.0% correctly in overall and slightly better in classifying “Successful” banks. MLP performs better in classifying banks according to ROE compared to ROA on the whole dataset. Table 12: MLP Confusion Matrix before Feature Selection Classification Observed Training
Testing
0 1 Overall Percent 0 1 Overall Percent
Predicted 0 87 1 47,1% 39 2 48,8%
1 7 92 52,9% 3 40 51,2%
Percent Correct 92,6% 98,9% 95,7% 92,9% 95,2% 94,0%
Dependent Variable: ROE
From Figure 4 it can be seen that curves for “Unsuccessful” and “Successful” are quite close to upper left corner, which is an indication of good achievement of classification.
Figure 4: ROC Curve for MLP Classification before Feature Selection Table 13 shows the normalized importance of independent variables sorted decreasingly. For identifying the most relevant variables CART method is run on the whole dataset. 10fold cross validation is used for model selection and Gini index is utilized for impurity measure. A set of 18 165
Emir et al. (2016). Asian Journal of Research in Business Economics and Management, Vol. 6, No. 3, pp. 153-172
predictors are detected having a normalized importance value above the threshold value of 15%. Predictors in the reduced set for ROE have close normalized importance values compared to normalized importance values of reduced set for ROA. Results indicate that two of the most important independent variables for classifying banks according to ROA is P2 (“Net Profit (Losses) / Paid-in Capital”) and P1 (“Income Before Taxes / Total Assets”) having the values of 100% and 86.2% respectively. Table 13: Variable Importance Values Produced by CART Independent Variable Importance Independent Importance Normalized Variable Importance P2 0,264 100,0% P1 0,228 86,2% A6 0,208 78,7% IE11 0,171 64,9% IE4 0,158 59,8% A2 0,136 51,6% IE10 0,120 45,5% IE3 0,120 45,5% C2 0,088 33,4% IE8 0,080 30,2% IE13 0,062 23,5% C4 0,061 22,9% BS5 0,058 22,1% AQ1 0,055 20,7% AQ4 0,054 20,5% A1 0,049 18,6% IE7 0,045 17,2% C3 0,045 17,0% After feature selection, a reduced dataset containing independent variables in Table 13 is generated. By running MLP on this reduced dataset, a neural network model is created which have eleven hidden layer units, using hyperbolic and softmax activation functions in hidden and output layers respectively. Table 14: MLP Confusion Matrix after Feature Selection Classification Observed 0 Training 1 Overall Percent 0 Testing 1 Overall Percent Dependent Variable: ROE
Predicted 0 94 0 53,1% 36 4 42,6%
166
1 4 79 46,9% 2 52 57,4%
Percent Correct 95,9% 100,0% 97,7% 94,7% 92,9% 93,6%
Emir et al. (2016). Asian Journal of Research in Business Economics and Management, Vol. 6, No. 3, pp. 153-172
Confusing matrix showing classification performance of MLP on reduced dataset is presented in Table 14. MLP gives very close results on reduced data set compared to whole dataset having an overall classification performance on test set as 93.6%. Model performs better for “Unsuccessful” banks. As a result, classification of banks according to ROE can be performed by using the most relevant 18 predictors instead of using a set of 47 variables that contains irrelevant predictors. This is an indication that is CART is useful for feature selection process before MLP analysis. ROC curve for MLP model on reduced data set is presented in Figure 5.
Figure 5: ROC Curve for MLP Classification after Feature Selection V. Discussions and Conclusions A dataset containing 47 financial ratios are collected to analyses the banking returns for deposits banks in Turkey. Financial ratios are determined from seven different categories. The values of predetermined dependent and independent variables of 29 deposit banks operating in Turkey are covered in the study. Assessments on the Return on Assets and Return on Equites were major categorical dependent variables in this application. MLP method is applied on whole data set (dataset containing all the independent variables). During learning process of MLP 70% of dataset is used for training. Scaled conjugate gradient procedure is chosen as an optimization procedure. A network, which has three hidden layer units and use hyperbolic tangent and identity activation function for hidden and output layers respectively. Classification results of MLP are given for training and testing sets as usually testing results are more informative about the success of a model. By inspecting table MLP, it can be concluded that model classifies banks 87.5% correctly and very slightly better in classifying “Successful” banks. For identifying the most relevant variables CART method is run on the whole dataset. 10 fold cross validation is used for model selection and Gini index is utilized for impurity measure. Results showing the normalized importance of independent variables sorted decreasingly. Results indicate that two of the most important independent variables for classifying banks according to ROA is P1 (“Income Before Taxes / Total Assets”) and A6 (“Net Operating Income (Loss) / Total Assets”) having the values of 100% and 93.7% respectively. By running MLP on this reduced dataset, a neural network model is created which have eight hidden layer units, using hyperbolic and identity activation functions in hidden and output layers respectively. MLP performs better on reduced data having an overall classification performance on test set as 89.4%. Model performs better for “Successful” banks. As a result, classification of banks
167
Emir et al. (2016). Asian Journal of Research in Business Economics and Management, Vol. 6, No. 3, pp. 153-172
according to ROA can be performed by using the most relevant 11 predictors instead of using a set of 47 variables that contains irrelevant predictors. This is an indication that is CART is useful for feature selection process before MLP analysis. MLP performs better in classifying banks according to ROE compared to ROA on the whole dataset. Results indicate that two of the most important independent variables for classifying banks according to ROA is P2 (“Net Profit (Losses) / Paid-in Capital”) and P1 (“Income Before Taxes / Total Assets”) having the values of 100% and 86.2% respectively. As a result, classification of banks according to ROE can be performed by using the most relevant 18 predictors instead of using a set of 47 variables that contains irrelevant predictors. This is an indication that is CART is useful for feature selection process before MLP analysis. The study could be developed by using hybrid models in the FUZZY environment for future directions. It is also possible to increase the effects of this study with new hybrid models including data mining approach using AHP-ANP, SENSITIVITY or TOPSIS and MOORA techniques to compare banking performance in advanced and emerging economies.
References Aggarwal, C (2015), Data Mining: The Textbook, Springer. Akhigbe, A. & McNulty, J. E. (2003). The profit efficiency of small US commercial banks. Journal of Banking & Finance, 27: 307–325. Alpaydın, E. (2009). Introduction to Machine Learning (2nd ed.). The MIT Press. Andriyashin, A. (2005). Financial applications of classification and regression trees. Master Thesis, Humboldt University, Berlin. Ariff, M. & Can, L. (2008). Cost and profit efficiency of Chinese banks: A non-parametric analysis. China Economic Review, 19: 260–273. Arvaneh, M., Guan, C., Ang, K. K., & Quek, H. C. (2010). EEG Channel Selection Using Decision Tree in Brain-Computer Interface. In Proceedings of the Second APSIPA Annual Summit and Conference (pp. 225–230). Athanasoglou, P. P., Brissimis, S. N., & Delis, M. D. (2008). Bank-specific, industry-specific and macroeconomic determinants of bank profitability. Journal of international financial Markets, Institutions and Money, 18(2), 121-136. Athanasoglou, P. P., Delis, M. D., & Staikouras, C. K. (2006). Determinants of bank profitability in the South Eastern European region. Bnk of Greece. Baesens, B., Van Gestel, T., Viaene, S., Stepanova, M., Suykens, J., & Vanthienen, J. (2003). Benchmarking state-of-the-art classification algorithms for credit scoring. Journal of the Operational Research Society, 54(6), 627–635. Bastı, E., Kuzey, C., Delen, D. (2015). Analyzing initial public offerings' short-term performance using decision trees and Decision Support Systems, Volume 73, 15-27.
168
Emir et al. (2016). Asian Journal of Research in Business Economics and Management, Vol. 6, No. 3, pp. 153-172
Berger, A. N., Bonime, S. D., Covitz, D. M. & Hancock, D. (2000). Why are bank profits so persistent? The roles of product market competition, informational opacity, and regional/macroeconomic shocks. Journal of Banking & Finance, 24: 1203-1235. Bieliková, T., Bányiová, T., Piterková, A. (2014). Prediction Techniques of Agriculture Enterprises Failure, Procedia Economics and Finance, Volume 12, 48-56. Bittencourt, H. R., & Clarke, R. T. (2004). Feature selection by using classification and regression trees (CART). The International Archives of the Photogrammetry, Remote Sensing and Spatial Information Sciences. Bramer, M. (2007). Principles of Data Mining, Springer. Breiman, L., Friedman, J.H., Olshen, R., and Stone, C.J. (1984). Classification and Regression Tree Wadsworth & Brooks/Cole Advanced Books & Software, Pacific California. Brighi, P., & Venturelli, V. (2014). How do income diversification, firm size and capital ratio affect performance? Evidence for bank holding companies. Applied Financial Economics, 24(21), 13751392. Chiorazzo, V. & Milani, C. (2011). The impact of taxation on bank profits: Evidence from EU banks. Journal of Banking & Finance, 35: 3202–3212. Chu, S. F. & Lim, G.H. (1998). Share performance and profit efficiency of banks in an oligopolistic market: evidence from Singapore. Journal of Multinational Financial Management, 8: 155–168. Chuang C.L. (2013). Application of hybrid case-based reasoning for enhanced performance in bankruptcy prediction, Information Sciences, Volume 236, Pages 174-185. Cios, K. J., Pedrycz, W., Swiniarski, R. W., & Kurgan, L. A. (2010). Data Mining: A Knowledge Discovery Approach, Springer. Claveria, O., Monte, E., Torra, S. (2015). A self-organizing map analysis of survey-based agents׳ expectations before impending shocks for model selection: The case of the 2008 financial crisis, International Economics, In Press, Corrected Proof, Available online 2 December 2015. Cornett, M. M., Hovakimian, G., Palia, D., & Tehranian, H. (2003). The impact of the manager– shareholder conflict on acquiring bank returns. Journal of Banking & Finance, 27(1), 103-131. Cyree, K. B., & Spurlin, W. P. (2012). The effects of big-bank presence on the profit efficiency of small banks in rural markets. Journal of Banking & Finance, 36(9), 2593-2603. Das, A. & Ghosh, S. (2009). Financial deregulation and profit efficiency: A nonparametric analysis of Indian banks. Journal of Economics and Business, 61, 509–528. Delen, D., Kuzey, C., Uyar, A. (2013). Measuring firm performance using financial ratios: A decision tree approach, Expert Systems with Applications, Volume 40, Issue 10, 3970-3983. Demirgüç-Kunt, A., & Huizinga, H. (2010). Bank activity and funding strategies: The impact on risk and returns. Journal of Financial Economics, 98(3), 626-650.
169
Emir et al. (2016). Asian Journal of Research in Business Economics and Management, Vol. 6, No. 3, pp. 153-172
Derelioğlu, G., & Gürgen, F. (2011). Knowledge discovery using neural approach for SME’s credit risk analysis problem in Turkey. Expert Systems with Applications, 38(8), 9313–9318. DeYoung, R. & Hasan, I. (1998). The performance of de novo commercial banks: A profit efficiency approach. Journal of Banking & Finance, 22: 565-587. Erbas, B. C., & Stefanou, S. E. (2009). An application of neural networks in microeconomics: Input–output mapping in a power generation subsector of the US electricity industry. Expert Systems with Applications, 36(2), 2317–2326. Farook, S., Hassan, M. K. & Clinch, G. (2012). Profit distribution management by Islamic banks: An empirical investigation. The Quarterly Review of Economics and Finance, 52: 333– 347. Francis, L. (2001). The basics of neural networks demystified. Contingencies, (11/12 2001), 56–61. Gander, J. P. (2013). Integrating bank profit and risk-avoidance decisions for selected European countries: A micro–macro analysis. Economic Modelling, 31: 717–722. Gayatri, N., Nickolas, S., Reddy, A.V. (2010). Feature Selection Using Decision Tree Induction in Class level Metrics Dataset for Software Defect Predictions, Proceedings of the World Congress on Engineering and Computer Science 2010 Vol I, WCECS 2010, October 20-22, 2010, San Francisco, USA. Gnezditskaia, A. (2003). Russian banks’ profit strategies: the evidence from various types of banks. Communist and Post-Communist Studies, 36: 163–191. Goddard, J., Liu, H., Molyneux, P., & Wilson, J. O. (2011). The persistence of bank profit. Journal of Banking & Finance, 35(11), 2881-2890. Grifell-Tatjé, E. (2011). Profit, productivity and distribution: Differences across organizational forms–The case of Spanish banks. Socio-Economic Planning Sciences, 45(2), 72-83. Guresen, E., Kayakutlu, G., Daim, T.U. (2011). Using artificial neural network models in stock market index prediction, Expert Systems with Applications, Volume 38, Issue 8, 10389-10397. Ince, H. (2014). Short-term stock selection with case-based reasoning technique, Applied Soft Computing, Volume 22, 205-212. Kantardzic, M. (2011). Data Mining: Concepts, Models, Methods, and Algorithms (2nd Edition). New Jersey: Wiley-Blackwell. Kara, Y., Boyacioglu, M.A, Baykan, Ö.K (2011). Predicting direction of stock price index movement using artificial neural networks and support vector machines: The sample of the Istanbul Stock Exchange, Expert Systems with Applications, Volume 38, Issue 5, 5311-5319. Khanbabaei, M., & Alborzi, M. (2013). The Use of Genetic Algorithm, Clustering and Feature Selection Techniques in Construction of Decision Tree Models for Credit Scoring. International Journal of Managing Information Technology, 5(4), 13–32. Kim, S.Y., Upneja, A. (2014). Predicting restaurant financial distress using decision tree and AdaBoosted decision tree, Economic Modelling, Volume 36, 354-362. 170
Emir et al. (2016). Asian Journal of Research in Business Economics and Management, Vol. 6, No. 3, pp. 153-172
Kosmidou, K. Pasiouras, F. & Tsaklanganos, A. (2007). Domestic and multinational determinants of foreign bank profits: The case of Greek banks operating abroad. Journal of Multinational Financial Management, 17: 1-15. Kosmidou, K., & Zopounidis, C. (2002). An optimization scenario methodology for bank asset liability management. Operational Research, 2(2), 279-287. Kuzey, C., Uyar, A., Delen, D. (2014) .The impact of multinationality on firm value: A comparative analysis of machine learning techniques, Decision Support Systems, Volume 59, Pages 127-142. Mabu, S., Obayashi, M., Kuremoto, T. (2015). Ensemble learning of rule-based evolutionary algorithm using multi-layer perceptron for supporting decisions in stock trading problems, Applied Soft Computing, Volume 36, 357-367 Martín-Oliver, A., & Salas-Fumás, V. (2008). The output and profit contribution of information technology and advertising investments in banks. Journal of Financial Intermediation, 17(2), 229255. Maudos, J., Pastor, J., Francisco, M. & Quesada, J. (2002). Cost and profit efficiency in European banks. Journal of International Financial Markets, Institutions and Money, 12: 33–58. Min Qi, & Zhang, G. P. (2008). Trend Time Series Modelling and Forecasting With Neural Networks. IEEE Transactions on Neural Networks, 19(5), 808–816. Mostafa, M.M. (2010). Forecasting stock exchange movements using neural networks: Empirical evidence from Kuwait, Expert Systems with Applications, Volume 37, Issue 9, 6302-6309. Oguzsoy, C. B., & Gu, S. (1997). Bank asset and liability management under uncertainty. European Journal of Operational Research, 102(3), 575-600. Patel, J., Shah, S., Thakkar, P., Kotecha, K. (2015). Predicting stock and stock price index movement using Trend Deterministic Data Preparation and machine learning techniques, Expert Systems with Applications, Volume 42, Issue 1, 259-268. Pereira, B. D. B., & Rao, C. R. (2009). Data Mining Using Neural Networks: A Guide for Statisticians (1st ed.). Chapman & Hall. Perez, M. (2006). Artificial neural networks and bankruptcy forecasting: a state of the art. Neural Computing & Applications, 15(2), 154–163. Quah, T.S. (2008). DJIA stock selection assisted by neural network, Expert Systems with Applications, Volume 35, Issues 1–2, 50-58. Rafiei, F.M, Manzari, S.M, Bostanian, S. (2011). Financial health prediction models using artificial neural networks, genetic algorithm and multivariate discriminant analysis: Iranian evidence, Expert Systems with Applications, Volume 38, Issue 8, 10210-10217. Saeys, Y., Inza, I., & Larranaga, P. (2007). A review of feature selection techniques in bioinformatics. Bioinformatics, 23(19), 2507–2517. 171
Emir et al. (2016). Asian Journal of Research in Business Economics and Management, Vol. 6, No. 3, pp. 153-172
Sahin, Y., Bulkan, S., Duman, E. (2013). A cost-sensitive decision tree approach for fraud detection, Expert Systems with Applications, Volume 40, Issue 15, 5916 - 5923. Sermpinis, G., Laws, J., Karathanasopoulos, A., Dunis, C.L. (2012). Forecasting and trading the EUR/USD exchange rate with Gene Expression and Psi Sigma Neural, Expert Systems with Applications, Volume 39, Issue 10, 8865-8877. Sevim, C., Oztekin, A., Bali, O., Gumus, S., Guresen, E. (2014). Developing an early warning system to predict currency crises, European Journal of Operational Research, Volume 237, Issue 3, 1095-1104. Smith, K., & Gupta, J. (2002). Neural Networks in Business. Hershey, PA: IDEA Group Publishing Steeb, W. H. (2005). The Nonlinear Workbook (3rd ed.). World Scientific Publishing Stiroh, K. J. (2006). New evidence on the determinants of bank risk. Journal of Financial Services Research, 30(3), 237-263. Sufian, F., & Chong, R. R. (2008). Determinants of bank profitability in a developing economy: Empirical evidence from the Philippines. Asian academy of management journal of accounting and finance, 4(2), 91-112. Tofan, C.A. (2015). Decision Tree Method Applied in Cost-based Decisions in an Enterprise, Procedia Economics and Finance, Volume 32, 1088-1092. Tortosa-Ausina, E., Armero, C., Conesa, D., & Grifell-Tatjé, E. (2012). Bootstrapping profit change: An application to Spanish banks. Computers & Operations Research, 39(8), 1857-1871. Toutanova, K., & Manning, C. D. (2002). Feature selection for a rich HPSG grammar using decision trees. Proceedings of the 6th conference on Natural language learning-Volume 20 (pp. 1– 7). Association for Computational Linguistics. Tsai, C.F. (2009), Feature selection in bankruptcy prediction, Knowledge-Based Systems, Volume 22, Issue 2, Pages 120-127. Williams, B. (2003). Domestic and international determinants of bank profits: Foreign banks in Australia, Journal of Banking & Finance, 27: 1185–1210. Yeh, Q. J. (1996). The application of data envelopment analysis in conjunction with financial ratios for bank performance evaluation. Journal of the Operational Research Society, 980-988.
172