This article has been accepted for publication in a future issue of this journal, but has not been fully edited. Content may change prior to final publication. Citation information: DOI 10.1109/ACCESS.2018.2831209, IEEE Access
Date of publication xxxx 00, 0000, date of current version xxxx 00, 0000. Digital Object Identifier 10.1109/ACCESS.2017.Doi Number
An Automated Remote Cloud-Based Heart Rate Variability Monitoring System Ahmed Faeq Hussein1, Member, IEEE, Arun Kumar N2, Member, IEEE, Marlon Burbano-Fernandez3, Gustavo Ramirez-Gonzalez3, Enas Abdulhay4, Victor Hugo C. de Albuquerque5, Member, IEEE 1
Bio-Medical Engineering Department, Faculty of Engineering, AL-Nahrain University, 10072, Baghdad, Iraq. Department of Electronics and Instrumentation, SASTRA University, Thanjavur, 613401, India. 3 Telematics Department, University of Cauca, Colombia. 4 Department of Biomedical Engineering, Faculty of Engineering, University of Science and Technology, Irbid, Jordan. 5 Graduate Program in Applied Informatics, University of Fortaleza, Fortaleza/CE, Brazil. 2
Corresponding author: Gustavo Ramirez-Gonzalez (
[email protected])
ABSTRACT The online telemedicine systems are helpful since they provide timely and effective healthcare services. Such online healthcare systems are usually based on sophisticated and advanced wearable and wireless sensor technologies. A rapid technological growth has improved the scope of many remote health monitoring systems. Here, the researchers employed a cloud-based remote monitoring system for observing the health status of the patients after monitoring their Heart Rate Variability (HRV). This system was developed after considering many factors like the ease of application, costs, accuracy and the data security. Furthermore, this system was also conceptualised to act as an interface between the patients and the healthcare providers, thus ensuring a two-way communication between them. The major aim of the study was to provide the best healthcare monitoring services to the people living in the remote areas, which was otherwise very difficult owing to the small doctor-to-patient ratio. The researchers also analysed their monitoring system using two different databases. First comes from MIT Physionet database i.e., the MIT-BIH sinus rhythm and the MIT-St. Petersburg. While the second Database was collected after monitoring 30 people who were asked to use these wearable sensors. After analysing the performance of the proposed scheme, the obtained results for accuracy, sensitivity and specificity were 99.02%, 98.78% and 99.17% respectively. The achieved results concluded that the proposed system was quite reliable, robust and valuable. Also, the data analysis revealed that this system was very convenient and ensured data security. Additionally, this developed monitoring system generated warning messages, directed towards the patients and the doctors, during some critical situation. INDEX TERMS Telemedicine, Cloud Computing, IoT, ECG, HRV Analysing, QRS, Homomorphic Encryption
I. INTRODUCTION
In the past few decades, researchers and scientists have made massive developments in the field of medical and healthcare services. Also, decrease in the costs of wireless communication and integration of several health monitoring systems into the common devices such as smartphones, have also helped in tackling problems like scarce medical facilities and resources [1, 2]. The integration of the wearable sensors with the mobile communication systems has helped in shifting the provision of the healthcare services from a clinic-centric level to a patient-centric level. This process is called as telemedicine [3, 4]. Based on the perspective, telemedicine is described using 2 different concepts: the first, live communication VOLUME XX, 2018
concept requires the presence of the patient and the doctor, along with a high data quality. The second concept is the data storage and transfer concept, wherein the doctors can access and share the patient’s medical data like the acquired vital sign data, biomedical videos or images with the specialists in other hospitals [5]. However, an increased sharing of the vital patient data can lead to many security concerns associated with the patient’s privacy. Many factors were listed by the Health Insurance Portability and Accountability Act (HIPAA) for defining the measures that could be employed while protecting the health information of the patients. But, this list is still incomplete and inadequate against the various health information databases, which breach the patient’s privacy [6].
2169-3536 © 2017 IEEE. Translations and content mining are permitted for academic research only. Personal use is also permitted, but republication/redistribution requires IEEE permission. See http://www.ieee.org/publications_standards/publications/rights/index.html for more information.
1
2169-3536 (c) 2018 IEEE. Translations and content mining are permitted for academic research only. Personal use is also permitted, but republication/redistribution requires IEEE permission. See http://www.ieee.org/publications_standards/publications/rights/index.html for more information.
This article has been accepted for publication in a future issue of this journal, but has not been fully edited. Content may change prior to final publication. Citation information: DOI 10.1109/ACCESS.2018.2831209, IEEE Access
Studies have shown that the telemedicine services are able to provide a high-quality medical solution to the patients in the areas where access to global networks and internet is easily provided. Around 94% of the total global population owns a cell phone and ≈ 2.7 billion subscribers use the internet services [7]. Many researchers have investigated the application of the mobile phones in the healthcare and the clinical sector, and have observed that the use of inbuilt smartphone applications has enabled the independent functioning of many old patients having frailties [8, 9]. According to the recently published medical reports, many telemedicine systems were developed for taking care of patients suffering from chronic illnesses like cardiovascular diseases, cardiopulmonary diseases, and cardiomyopathy, which could lead to the heart failure in the patients living in remote and urban areas and who cannot seek timely medical services [10-12]. As per the reports published by the World Health Organisation (WHO), a majority of the medicalrelated deaths (≈17.7 million) in the world are due to heart diseases, and it has been estimated that this rate would increase to >31% till 2030 [13, 14]. Furthermore, the treatment of these chronic diseases requires a constant and long-term monitoring of the patients [15]. Heart rate variability (HRV) discusses the variation (over time) in the period concerning the consecutive heartbeats in a person, which reflects his physiological signs that modulate his heart rhythm. HRV is an indication of the current heartrelated abnormalities and can warn about the imminent cardiac diseases. These indications are constantly present or occur randomly during the day [16]. Many complicated heart diseases such as arrhythmia, myocardial ischemia, and Long QT Syndrome are diagnosed using the HRV signals [17-19]. Body Sensor Network (BSN) is a specific form of Wireless Sensor Network (WSN) which is used for monitoring the human body. The wearable BSN consists of wireless wearable physiological sensors that are attached to the body (using elastic straps, skin electrodes or smart fabrics) for a cost-effective, constant and real-time monitoring [20]. Many BSN applications are proposed such as the early detection, prevention, and monitoring of the serious neurodegenerative, cardiovascular and other similar diseases. This technology helps in continuously monitoring the important and physiological signs in the patients without obstructing their daily activities. The combination of BSNs with the cloud-based services leads to reliable, speedy and high-quality medical services, which are constantly available and cover a wide area. These are especially beneficial to the people living in remote regions who require these services urgently [21, 22]. Here, the researchers have proposed an automated and cloud-based heart monitoring system after HRV evaluation. In this study, the researchers would collect the data from the patients with the help of the Electrocardiogram (ECG) wearable devices that measure the HRV rates which determine the heart rate and this data would be used for
determining the preliminary heart condition. This HRV data contains important cardiac and cardiovascular-related data, which can be used for localising the abnormalities and determining the warning signals. The researchers have presented a proof-of-concept system, which consists of many ECG cases that were compared to the MIT-BIH Physionet database along with the readings from the healthy people. The using of cloud-based and fast analysis of heart condition can provide an urgent aid to those who live in remote or urban places and cannot get a sufficient medical care. Moreover, the automation of the system contributes to reduce the expense that should be paid by the user. On the other hand, the proposed system can be used to collect a numerous datasets from various places around the world that can be used in cardiovascular related researches. II. LITERATURE REVIEW
Many studies were carried out for improving the heart monitoring technologies, which have been outlined and described below. In one study, Miao et al. [23] designed a power-saving, wearable, context-aware ECG nursing scheme. This device integrated the kinetic and built-in sensors of a smartphone with their ECG sensor design. Furthermore, this wearable ECG sensor consisted of a completely-integrated Analogue FrontEnd, a Secure Digital card, a commercial Micro Control Unit along with the Bluetooth module. Pandian and Srinivasa [24] designed the prototype for a wearable physiological monitoring system that was used to assess several physiological parameters like Heart Rate (HR), ECG, ElectroEncephaloGram (EEG) and the body temperature. They acquired the ECG and the EEG signals with the help of textile electrodes that were attached to the individual’s clothes. Thereafter, these signals were processed for noise removal, all parameters were extracted and the researchers carried out a trend analysis. All physiological parameters were monitored with the ZigBee wireless communication system at a remote monitoring station. In another study, Liu et al. [25] have presented a novel sensor design for monitoring the BCG signals. This design comprised of 2 differently sized piezoelectric film sensors that were fitted into the foot insole and the chair seat cushions, respectively, for acquiring the BCG signals during the standing and the sitting activities. They also discussed the design, engineering implementation of their signal processing circuit along with the data transmission system used in their study. Fortino et al. [26] proposed BodyCloud, a SaaS approach, which was used by the community BSNs supporting the application. The BodyCloud system consisted of a multi-tier application-level architecture which integrated the cloud computing platform along with the BSN DataStream middleware. BodyCloud provided the programming abstraction helped in the development of the community BSN applications. In this paper, the researchers outlined their 2
VOLUME XX, 2018
2169-3536 (c) 2018 IEEE. Translations and content mining are permitted for academic research only. Personal use is also permitted, but republication/redistribution requires IEEE permission. See http://www.ieee.org/publications_standards/publications/rights/index.html for more information.
This article has been accepted for publication in a future issue of this journal, but has not been fully edited. Content may change prior to final publication. Citation information: DOI 10.1109/ACCESS.2018.2831209, IEEE Access
proposed approach and presented a case study that demonstrated a real-time monitoring and analysis of the cardiac data for different test individuals. Park et al. [27] proposed a new approach for solving the problems related to the Human-Activity Recognition (HAR) and the Energy Expenditure (EE). Their technique involved the use of an ECG and an accelerometer. Firstly, they designed a database comprising of 6 different human activities (like standing, sitting, resting, walking, ascending and running) performed by 13 volunteers. Thereafter, they compared the HAR performance of the 3 models with the input data (consisting of 0, 100% and a few HRV parameters). In another study, Mora et al [28] described the distributed framework that was Internet-based and acted as a model for monitoring the human biomedical signals after the users performed some physically-exerting activities. This system was flexible during the computation of the health applications and used the resources from the devices that were present within the body area network around the individual. Furthermore, this framework could be used in other portable environments, particularly those which required concentrated data acquisition systems and better processing. Also, the realtime data that was acquired by such devices presented a social objective which could predict the occurrence of probable injuries and even sudden death of the user.
ventricle repolarisation. The 3 ECG waves are different in every individual with regards to their shape, amplitude and duration, however, they still have many similar general morphologies, which makes it easier to analyse the ECG signals using one algorithm [30, 31]. Furthermore, the 3 wave components in the ECG signals are a multi-component complex that arises due to special cellular and electrical activities [32]. Thus, the special heart cells which carry out specific cardiac activities (Sinus nodes, Atrial muscles, A-V nodes, Common bundles, Bundle branches, Purkinje fibres, and Ventricular muscles) give rise to the ECG signal. Any problem in one or many cardiac components disturbs the normal heart rhythm and affects the ECG signal. A different combination of the components helps in the collection of different cases that describe the various heart conditions, which are then classified into different categories. This complicates the diagnosis procedures [33]. Many heart and cardiovascular diseases are identified by analysing the ECG signal data for the signal components, like the RR interval is used for determining the HRV (Figure 2) [34].
A. The ECG
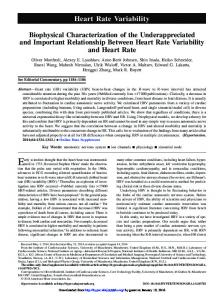
ECG measures the electrical activity of the human heart, which indirectly reflects the health of the circulatory system of the body. The ECG signals are a composite of the heart beats and are presented in the form of peaks and valleys. They are further arranged in 3 basic waves, i.e., P, QRS and T. The ECG signal indicating a single heartbeat has been described in Figure 1 [29].
FIGURE 1. Typical ECG pulse
P wave occurs due to atrium depolarisation and is the primary ECG component, while the QRS wave occurs due to ventricle depolarisation, and finally, the T wave occurs due to
FIGURE 2. The RR interval
B. HRV ANALYSIS
Studies have used 2 types of HRV analysis techniques, i.e., the time-domain or frequency-domain. These techniques help in determining the heart rates at either a specific time point or during a particular time interval between the successive normal complexes. The continuous ECG record detects every QRS complex along with either the Normal-to-Normal (NN) intervals (i.e., intervals between the adjacent QRS complexes which arise due to a sinus node depolarisation) of an instantaneous heart rate. Also, the simple time-domain variables, which are estimated, include the average heart rate, average NN intervals, differences occurring between the shortest and the longest NN interval, differences between the day and night heart rates, etc. The original RR time interval series were used for calculating the HRV parameters, like the average HR (mean heart rate, bpm), SDNN (Standard Deviation of the NN intervals, ms), and the RMSSD (square root of the average value of the sum of squares of the difference between the adjacent NN intervals, ms) [35]. Thereafter, the researchers resampled at the frequency of 4 Hz, using a piecewise cubic Hermite interpolation, and estimated the HRV frequency parameters. The irregular, timesampled signals were presented as the even sample time series before the spectrum estimation for preventing the generation of additional harmonic constituents in this spectrum [36]. 3
VOLUME XX, 2018
2169-3536 (c) 2018 IEEE. Translations and content mining are permitted for academic research only. Personal use is also permitted, but republication/redistribution requires IEEE permission. See http://www.ieee.org/publications_standards/publications/rights/index.html for more information.
This article has been accepted for publication in a future issue of this journal, but has not been fully edited. Content may change prior to final publication. Citation information: DOI 10.1109/ACCESS.2018.2831209, IEEE Access
Though the resampling frequency rule for the RR intervals is not properly defined, many of the HRV-related studies [37, 38]. The researchers selected the resampling rate, based on the Nyquist criterion; and hence, a frequency of 4 Hz was acceptable when the RR interval was below 120 bpm (or 2 Hz) [39]. The Power Spectral Density (PSD) is used for obtaining the basic information regarding the manner in which the power was distributed as a function of frequency. The true PSD value can only be calculated using proper mathematical algorithms, irrespective of the method used [37]. The PSD results obtained using the fast Fourier transform were classified into Very Low Frequency (VLF) band (0.003 – 0.04 Hz), Low Frequency (LF) band (0.04 – 0.15 Hz), and High Frequency (HF) band (0.15 – 0.4 Hz), based on their frequency ranges. In this study, the researchers considered the LF and HF for detection. They normalised the sum of every component and presented it as the norm LF and norm HF, while the ratio of the normalised components was described as LF/HF [40]. This LF/HF ratio is a common index that reflects the vagal balance, which indicates the sympathetic nerve activity [41]. III. MATERIALS AND METHODS
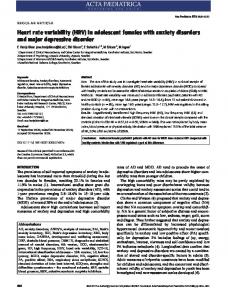
In this study, the researchers developed a remote and automated diagnostic system for monitoring the patient’s heart condition. This helped in preventing the potential heart diseases and provided therapy to the patients, who were recovering from their illnesses. The researchers configured a wearable ECG device for extracting vital HRV data that reflects the patient’s condition and helps in the early detection of probable abnormalities like hypertension, hypotension, arrhythmia and ischemia. Figure 3 presents the system architecture, comprising of a wearable ECG device, ECG system nodes, a main processing server, data files and a web Graphical User Interface (GUI) server.
A. ECG MONITORING DEVICE
The wearable ECG device, used here, was developed and described in an earlier report [42]. This ECG device is wearable, lightweight, and simple, as it only consists of a single switch for initiating the detection process. This device uses the Bluetooth Low Energy (BLE) for transmitting the ECG data, and this helps the device to operate for long time durations without any charging or battery replacement. Though this device helps in capturing the ECG signals for 7 leads, the researchers have only used a single lead here (Lead II). This Lead II is sufficient for computing all the necessary HRV data, which forms the basis of the analysis process. B. ECG MONITORING DEVICE
The ECG system node comprises of 3 separate components, i.e., pre-processing, QRS detection, and data transmission. The acquired raw ECG data is initially preprocessed using a high pass filter at the cut-off frequency value of 0.5 Hz frequency for eliminating the baseline shift which occurs in the ECG signal due to normal human activities like breathing [1]. Thereafter, the Pan-Tompkins QRS detection algorithm was used. This was supplemented with the other extracted parameters (like the R wave amplitude, Q, R and T-wave peak location, and the RR interval) for obtaining a reliable and robust QRS detection and classification [2]. During the data transmission stage, the RR intervals were organised and sent to the data files that were managed in the cloud environment. Furthermore, all the data for the RR intervals was also included in the user files, which were formatted in the flexible XML format and could be easily accessed and used. C. ECG ANALYSIS
As stated earlier, the heart monitoring process, used here, is based on the HRV analysis and is described in Figure 4.
FIGURE 3. The proposed system
4 VOLUME XX, 2018
2169-3536 (c) 2018 IEEE. Translations and content mining are permitted for academic research only. Personal use is also permitted, but republication/redistribution requires IEEE permission. See http://www.ieee.org/publications_standards/publications/rights/index.html for more information.
This article has been accepted for publication in a future issue of this journal, but has not been fully edited. Content may change prior to final publication. Citation information: DOI 10.1109/ACCESS.2018.2831209, IEEE Access
The scheme comprises of the time and frequency domain analysis and this combination improves the general system accuracy. In the analysis process, the researchers compared the HRV parameter values of the patients with those of the normal individuals for isolating the abnormal cases. The normal HRV parameter values have been described in Table 1, which were determined during the normal activities [35, 45-47].
FIGURE 4.
calculating the HRV parameters. They used the Burg method for determining the frequency-domain HRV parameters, since it helps in the precise estimation of the spectrum and assists in an easier estimation of the frequency power components, compared to the non-parametric techniques that were Fourier transform-based [49]. After estimating the ECG and the HRV parameters for the ECG segments, the researchers analysed these parameters statistically.
The HRV analysis
The HRV parameter values were determined after analysing the fluctuations during the RR intervals and the value of the RR intervals, which originated in the sinoatrial node. The researchers observed that the RR interval sequences (acquired from the ambulatory ECG data) consisted of the abnormal RR intervals. However, the addition of the RR interval abnormalities in the HRV analysis could substantially affect the time-domain, and particularly the frequency-domain HRV analysis. Hence, the researchers had to carry out an additional pre-processing of the acquired RR interval sequences prior to the HRV analysis [48]. Here, the researchers edited the sections involving the abnormal heartbeats using the mean power of the selected band, wherein every abnormal RR interval was replaced by the interpolated RR interval. The frequency calculation technique improved the overall analytical process. Based on the recommendations provided by earlier studies for shortterm ECG data, the researchers investigated many HRV parameters in the time-domain (i.e., SDNN, SDNN Index, RR counts, RMSSD) and frequency-domain (LF, HF, LF/HF) [35]. Furthermore, for removing the low-frequency baseline shift in the NN interval sequences, the researchers applied the linear de-trending of every NN interval sequence before
During the software tool development, they were able to calculate the mean, median, standard deviation, percentile, range, and the number and percentage of the normal/ abnormal heartbeats. Here, the researchers used the combination of the time and frequency domain analysis. They stated that this combined analysis improved the results and eliminated the probable errors that could occur during the overall analysis. D. TRANSMISSION RATE REQUIRMENTS
The wearable ECG device has been designed to operate at the rate of 133 samples per second for every lead, and only transmits the RR sequence counts, which consumed a lesser data bandwidth for data transmission. The maximal human heart rate is 200 beats/min and was estimated at a maximal human workload [50]. At this rate, ≈0.2 KB of data was transmitted every second, and this includes the transmission of other associated data packages like the sample separators and packet headers. Even without the usage of the compression techniques, this transmission rate was seen to be within the general internet bandwidth limitation for a home or commercial internet service provider (including the coverage of expected configurations at the patient or doctor’s end). 5
VOLUME XX, 2018
2169-3536 (c) 2018 IEEE. Translations and content mining are permitted for academic research only. Personal use is also permitted, but republication/redistribution requires IEEE permission. See http://www.ieee.org/publications_standards/publications/rights/index.html for more information.
This article has been accepted for publication in a future issue of this journal, but has not been fully edited. Content may change prior to final publication. Citation information: DOI 10.1109/ACCESS.2018.2831209, IEEE Access
FIGURE 5.
The system GUI implementation
E. HOMOMORPHIC ENCRYPTION (HE)
The traditional cryptography technique has the main disadvantage where it prevents the data analysis in a cloud environment (unless the decryption key(s) have been submitted to the cloud provider). Hence, even the simple arithmetic operations do not yield the most accurate results when used for data, which is encrypted using a general algorithm like Advanced Encryption Standard (AES) [51]. This drawback is overcome by the application of the Homomorphic Encryption (HE) process. The HE process is a very innovative method which allows the analysis of the encrypted data, and yields encrypted and accurate results [52]. With the help of this technique, the server analyses the data and provides accurate results to the doctor, without retaining the knowledge of the data or the results. The doctor can view the result only if he provides an accurate decryption key. However, this ability comes at a price. Very few mathematical operations can be performed on the HEencrypted data and their calculations could be time or memory-consuming. In this study, the researchers have proposed a novel system which analyses the ECG data, aggregates the data on the PC, uploads it to the cloud service provider (like the Amazon Web Services), analyses the data in the cloud environment (and forwards the results to the concerned doctor), and also provides a protection along the complete route with the help of the HE technique. Thereafter, the cardiologist requests to observe the patient’s HRV result for a certain interval and the results are extracted from the cloud server, decrypted and displayed. Finally, the cardiologist reviews the results, diagnoses the patient and decides on the treatment strategy.
IV. RESULTS AND DISCUSSION
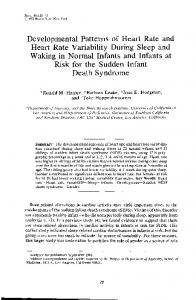
Here, the researchers have proposed a remote health monitoring system based on the analysis of the HRV parameters. Thereafter, they validated their system using 2 different databases. The first database included the St.-Petersburg’s Institute of Cardiological Technics database, derived from the MIT Physionet database. The Cardiological Technics database comprises of 75 annotated entries which were extracted from the 32 Holter records, belonging to the cardiac and cardiovascular patients [53]. Besides, the MIT-BIH normal sinus rhythm is also used to provide the normal cases which contains 18 normal records. The second data source is the collected data from 30 healthy individual volunteers (aged 17 to 61 years). In Figure 5, the researchers have described the cloud-based GUI for their system. Once the data is uploaded by the individual, the cardiologist views and analyses the results and thereafter decides if the data is fit to be viewed by the patient or not. Furthermore, the cardiologist also manages the results so that they are visible to the patient since he/she controls the HE decryption process. Figures 6, 7, and 8 describe the HRV results for the proposed process. As stated in Section 3.3, this proposed system is based on the time and the frequency domain HRV features. Figures 6(a), 7 (a), and 8 (a), present the HRV time domain results, while the Figures 6 (b), 7 (b), and 8 (b) describe the HRV frequency domain analysis results using the MIT normal sinus rhythm database, MIT St.-Petersburg database and the acquired data, respectively.
6 VOLUME XX, 2018
2169-3536 (c) 2018 IEEE. Translations and content mining are permitted for academic research only. Personal use is also permitted, but republication/redistribution requires IEEE permission. See http://www.ieee.org/publications_standards/publications/rights/index.html for more information.
This article has been accepted for publication in a future issue of this journal, but has not been fully edited. Content may change prior to final publication. Citation information: DOI 10.1109/ACCESS.2018.2831209, IEEE Access
The researchers acquired their data after considering the activities (sitting, sleeping, and other normal activities) that were being carried out by the patients during the data collection process. The system was validated after comparing the acquired results with the normal ranges of the various HRV parameters, shown in Table I. The results showed that the proposed system for monitoring the heart rates was very effective and reliable, where it could differentiate between the normal and abnormal cases. This system is very helpful as it provides indications to the users about their heart condition, and thereafter they can take a fast action to prevent further complications.
rhythm database, MIT St.-Petersburg database and the acquired data, respectively.
FIGURE 7.
FIGURE 6. database
The HRV analysing results for MIT normal sinus rhythm
The Cardiological Technics database comprises of 75 annotated entries which were extracted from the 32 Holter records, belonging to the cardiac and cardiovascular patients [53]. On the other hand, the second database, i.e., the MITBIH normal sinus rhythm database comprised of data collected from 30 healthy and normal volunteers (aged between 17 and 61 years). In Figure 5, the researchers have described the cloud-based GUI for their system. Once the data is uploaded by the individual, the cardiologist views and analyses the results and thereafter decides if the data is fit to be viewed by the patient or not. Furthermore, the cardiologist also manages the results so that they are visible to the patient since he/she controls the HE decryption process. Figures 6, 7, and 8 describe the HRV results for the proposed process. As stated in Section 3.3, this proposed system is based on the time and the frequency domain HRV features. Figures 6(a), 7 (a), and 8 (a), present the HRV time domain results, while the Figures 6 (b), 7 (b), and 8 (b) describe the HRV frequency domain analysis results using the MIT normal sinus
The HRV analysing results for MIT St.-Petersburg database
The researchers acquired their data after considering the activities (sitting, sleeping, and other normal activities) that were being carried out by the patients during the data collection process. The system was validated after comparing the acquired results with the normal ranges of the various HRV parameters, shown in Table I. The results showed that the proposed system for monitoring the heart rates was very effective and reliable, where it could differentiate between the normal and abnormal cases. This system is very helpful as it provides indications to the users about their heart condition, and thereafter they can take a fast action to prevent further complications. The obtained accuracy, sensitivity and specificity for HRV analysis were 99.02%, 98.78% and 99.17% respectively. From these results, we expect that the proposed system has the ability to provide a stable and reliable daily monitoring activities. Use of the HE technique improves the system robustness and makes it applicable in different situations that require secure web-based applications. Furthermore, the cloud-based environment and web GUI makes the system available to different devices like tablets, mobile phones, laptops etc. This property facilitates the use of a monitoring system, makes it available for various applications, and does not restrict it to any particular user. This decreases the expenses that would otherwise be borne by the patient.
7 VOLUME XX, 2018
2169-3536 (c) 2018 IEEE. Translations and content mining are permitted for academic research only. Personal use is also permitted, but republication/redistribution requires IEEE permission. See http://www.ieee.org/publications_standards/publications/rights/index.html for more information.
This article has been accepted for publication in a future issue of this journal, but has not been fully edited. Content may change prior to final publication. Citation information: DOI 10.1109/ACCESS.2018.2831209, IEEE Access
Physionet (normal sinus and St.-Petersburg) and another database comprising of data collected from 30 volunteers. After data analysis, the system was seen to be reliable and acceptable. Furthermore, the researchers used the HE technique for data encryption to test the remote monitoring security. This novel technique improved the system security and made it immune and robust against the hacking threats. Based on the results, it was seen that this system was effective, reliable and adaptable and could be used for extracting vital cardiac abnormalities from multiple patients, at the same time. It is notable that the demand for IoT health sensors is increased in a wide range for different users which is a serious challenge. The future work is to use a Fog computing architecture that can manage the huge IoT sensors connections and provide a bigger end-user proximity and bigger geographical distribution as well.
REFERENCES [1]
FIGURE 8.
The HRV analysing results for acquired data
Time Domain
Frequency domain
TABLE I HRV PARAMETER RANGES HRV parameters Units SDNN ms SDNN index ms RMSSD ms HR Beats/min LF ms2/Hz HF ms2/Hz
[2] Value Range 62-101 11-48 19-75 51-105 293-1009 183-3630
[3]
[4]
[5]
V. CONCLUSIONS
In the past few decades, there has been an increase in the rate of heart diseases, which is very concerning. The high cost of detection and diagnosis along with a lack of facilities are some of the primary reasons why the people tend to neglect their heart condition. This situation is particularly bad for people living in remote regions that lack medical facilities. A delay in the diagnosis and treatment could lead to death, and hence, a timely diagnosis of the heart conditions is very important. Advancements in the wireless communication systems and the wearable sensor technologies have led to the development of real-time healthcare monitoring systems. In this study, the researchers have developed a novel health monitoring system, based on cloud services, for analysing the HRV data. They developed the web applications that extracted the data from the wearable sensors attached to the user. Along with the medical data, these apps also collected some personal information like gender, age, address, and their location on the web interface. Thereafter, they designed a system using the threshold values, which alerts the doctor after detecting the heart abnormalities like hypertension, arrhythmia, ischemia etc. For assessing the application of this system, the researchers compared the acquired data with the MIT
[6]
[7]
[8]
[9]
[10]
[11]
W. Ping, W. Jin-gang, S. Xiao-bo, and H. Wei, "The research of telemedicine system based on embedded computer," in Engineering in Medicine and Biology Society, 2005. IEEEEMBS 2005. 27th Annual International Conference of the, 2006, pp. 114-117. e. ECG. (2018-February-24). Available: http://www.megaemg.com/products/emotion-ecg/ H. Ng, M. Sim, C. M. Tan, and C. Wong, "Wireless technologies for telemedicine," BT Technology Journal, vol. 24, pp. 130-137, 2006. W. M. Sweileh, S. W. Al-Jabi, A. S. AbuTaha, H. Z. Sa’ed, F. M. Anayah, and A. F. Sawalha, "Bibliometric analysis of worldwide scientific literature in mobile-health: 2006–2016," BMC medical informatics and decision making, vol. 17, p. 72, 2017. B. K. Host, A. W. Turner, and J. Muir, "Real‐ time teleophthalmology video consultation: an analysis of patient satisfaction in rural Western Australia," Clinical and Experimental Optometry, vol. 101, pp. 129-134, 2018. C.-D. Lee, K. I.-J. Ho, and W.-B. Lee, "A novel key management solution for reinforcing compliance with HIPAA privacy/security regulations," IEEE Transactions on Information Technology in Biomedicine, vol. 15, pp. 550-556, 2011. M. N. K. Boulos, S. Wheeler, C. Tavares, and R. Jones, "How smartphones are changing the face of mobile and participatory healthcare: an overview, with example from eCAALYX," Biomedical engineering online, vol. 10, p. 24, 2011. M. I. Pramanik, R. Y. Lau, H. Demirkan, and M. A. K. Azad, "Smart health: Big data enabled health paradigm within smart cities," Expert Systems with Applications, vol. 87, pp. 370-383, 2017. M. N. K. Boulos, A. Anastasiou, E. Bekiaris, and M. Panou, "Geo-enabled technologies for independent living: examples from four European projects," Technology and Disability, vol. 23, pp. 7-17, 2011. M. S. Mahmud, H. Wang, A. Esfar-E-Alam, and H. Fang, "A Wireless Health Monitoring System Using Mobile Phone Accessories," IEEE Internet of Things Journal, vol. 4, pp. 20092018, 2017. S. Thelen, M. Czaplik, P. Meisen, D. Schilberg, and S. Jeschke, "Using off-the-shelf medical devices for biomedical signal monitoring in a telemedicine system for emergency medical services," in Automation, Communication and Cybernetics in Science and Engineering 2015/2016, ed: Springer, 2016, pp. 797-810.
8 VOLUME XX, 2018
2169-3536 (c) 2018 IEEE. Translations and content mining are permitted for academic research only. Personal use is also permitted, but republication/redistribution requires IEEE permission. See http://www.ieee.org/publications_standards/publications/rights/index.html for more information.
This article has been accepted for publication in a future issue of this journal, but has not been fully edited. Content may change prior to final publication. Citation information: DOI 10.1109/ACCESS.2018.2831209, IEEE Access
[12]
[13]
[14]
[15]
[16]
[17]
[18]
[19]
[20]
[21]
[22]
[23]
[24]
[25]
[26]
[27]
[28]
[29] [30] [31]
L. Lévêque, W. Zhang, C. Cavaro-Ménard, P. Le Callet, and H. Liu, "Study of video quality assessment for telesurgery," IEEE Access, vol. 5, pp. 9990-9999, 2017. E. J. Benjamin, M. J. Blaha, S. E. Chiuve, M. Cushman, S. R. Das, R. Deo, et al., "Heart disease and stroke statistics-2017 update: a report from the American Heart Association," Circulation, vol. 135, pp. e146-e603, 2017. W. H. Organization, "Projections of mortality and causes of death, 2015 and 2030," Geneva, Switzerland: The World Health Organization, 2015. W. H. O. (WHO). (2017). World Heart Day 2017. Available: http://www.who.int/cardiovascular_diseases/world-heart-day2017/en/ A. F. B. Bernardo, L. C. M. Vanderlei, and D. M. Garner, "HRV analysis: a clinical and diagnostic tool in chronic obstructive pulmonary disease," International scholarly research notices, vol. 2014, 2014. A. Porta, G. Girardengo, V. Bari, A. L. George, P. A. Brink, A. Goosen, et al., "Autonomic control of heart rate and QT interval variability influences arrhythmic risk in long QT syndrome type 1," Journal of the American College of Cardiology, vol. 65, pp. 367-374, 2015. D. Oieru, I. Moalem, E. Rozen, A. Naimushin, R. Klempfner, I. Goldenberg, et al., "A novel heart rate variability algorithm for the detection of myocardial ischemia: pilot data from a prospective clinical trial," The Israel Medical Association journal: IMAJ, vol. 17, pp. 161-165, 2015. B. M. Asl, S. K. Setarehdan, and M. Mohebbi, "Support vector machine-based arrhythmia classification using reduced features of heart rate variability signal," Artificial intelligence in medicine, vol. 44, pp. 51-64, 2008. S. C. Mukhopadhyay, "Wearable sensors for human activity monitoring: A review," IEEE sensors journal, vol. 15, pp. 13211330, 2015. S. Imani, A. J. Bandodkar, A. V. Mohan, R. Kumar, S. Yu, J. Wang, et al., "A wearable chemical–electrophysiological hybrid biosensing system for real-time health and fitness monitoring," Nature communications, vol. 7, p. 11650, 2016. A. Lanata, G. Valenza, M. Nardelli, C. Gentili, and E. P. Scilingo, "Complexity index from a personalized wearable monitoring system for assessing remission in mental health," IEEE Journal of Biomedical and health Informatics, vol. 19, pp. 132-139, 2015. F. Miao, Y. Cheng, Y. He, Q. He, and Y. Li, "A wearable context-aware ECG monitoring system integrated with built-in kinematic sensors of the smartphone," Sensors, vol. 15, pp. 11465-11484, 2015. P. Pandian and M. Srinivasa, "A ZigBee-wireless wearable remote physiological monitoring system," in Signal Processing and Communication (ICSC), 2016 International Conference on, 2016, pp. 407-412. M. Liu, F. Jiang, H. Jiang, S. Ye, and H. Chen, "Low-power, noninvasive measurement system for wearable ballistocardiography in sitting and standing positions," Computers in Industry, vol. 91, pp. 24-32, 2017. G. Fortino, D. Parisi, V. Pirrone, and G. Di Fatta, "BodyCloud: A SaaS approach for community body sensor networks," Future Generation Computer Systems, vol. 35, pp. 62-79, 2014. H. Park, S.-Y. Dong, M. Lee, and I. Youn, "The Role of HeartRate Variability Parameters in Activity Recognition and EnergyExpenditure Estimation Using Wearable Sensors," Sensors, vol. 17, p. 1698, 2017. H. Mora, D. Gil, R. M. Terol, J. Azorín, and J. Szymanski, "An IoT-Based Computational Framework for Healthcare Monitoring in Mobile Environments," Sensors, vol. 17, p. 2302, 2017. M. Webster, "Merriam-Webster online dictionary," 2006. R. M. Rangayyan, Biomedical signal analysis vol. 33: John Wiley & Sons, 2015. X. Long, P. Fonseca, R. Haakma, R. M. Aarts, and J. Foussier, "Time-frequency analysis of heart rate variability for sleep and wake classification," in Bioinformatics & Bioengineering
[32]
[33] [34]
[35]
[36]
[37]
[38]
[39]
[40]
[41]
[42]
[43]
[44]
[45]
[46]
[47]
[48]
[49]
(BIBE), 2012 IEEE 12th International Conference on, 2012, pp. 85-90. N. Arunkumar, K. Ram Kumar, and V. Venkataraman, "Automatic detection of epileptic seizures using permutation entropy, tsallis entropy and kolmogorov complexity," Journal of Medical Imaging and Health Informatics, vol. 6, pp. 526-531, 2016. R. Klabunde, Cardiovascular physiology concepts: Lippincott Williams & Wilkins, 2011. Project Hub. Available: https://create.arduino.cc/projecthub/protocentral/single-leadecg-heartrate-variability-using-max30003-d20057 A. J. Camm, M. Malik, J. Bigger, G. Breithardt, S. Cerutti, R. J. Cohen, et al., "Heart rate variability. Standards of measurement, physiological interpretation, and clinical use," European heart journal, vol. 17, pp. 354-381, 1996. J.-P. Niskanen, M. P. Tarvainen, P. O. Ranta-Aho, and P. A. Karjalainen, "Software for advanced HRV analysis," Computer methods and programs in biomedicine, vol. 76, pp. 73-81, 2004. D. Singh, K. Vinod, and S. Saxena, "Sampling frequency of the RR interval time series for spectral analysis of heart rate variability," Journal of medical engineering & technology, vol. 28, pp. 263-272, 2004. A. C. Fisher, A. Eleuteri, D. Groves, and C. J. Dewhurst, "The Ornstein–Uhlenbeck third-order Gaussian process (OUGP) applied directly to the un-resampled heart rate variability (HRV) tachogram for detrending and low-pass filtering," Medical & biological engineering & computing, vol. 50, pp. 737-742, 2012. G. D. Clifford and L. Tarassenko, "Quantifying errors in spectral estimates of HRV due to beat replacement and resampling," IEEE transactions on biomedical engineering, vol. 52, pp. 630638, 2005. R. L. Verrier, T. Klingenheben, M. Malik, N. El-Sherif, D. V. Exner, S. H. Hohnloser, et al., "Microvolt T-wave alternans: physiological basis, methods of measurement, and clinical utility—consensus guideline by International Society for Holter and Noninvasive Electrocardiology," Journal of the American College of Cardiology, vol. 58, pp. 1309-1324, 2011. R. Castaldo, P. Melillo, U. Bracale, M. Caserta, M. Triassi, and L. Pecchia, "Acute mental stress assessment via short term HRV analysis in healthy adults: A systematic review with metaanalysis," Biomedical Signal Processing and Control, vol. 18, pp. 370-377, 2015. A. F. Hussein, S. J. Hashim, A. F. A. Aziz, F. Z. Rokhani, and W. A. W. Adnan, "A real time ECG data compression scheme for enhanced bluetooth low energy ECG system power consumption," Journal of Ambient Intelligence and Humanized Computing, pp. 1-14, 2017. S. Pal and M. Mitra, "Empirical mode decomposition based ECG enhancement and QRS detection," Computers in biology and medicine, vol. 42, pp. 83-92, 2012. J. Pan and W. J. Tompkins, "A real-time QRS detection algorithm," IEEE transactions on biomedical engineering, pp. 230-236, 1985. F. Shaffer and J. Ginsberg, "An overview of heart rate variability metrics and norms," Frontiers in public health, vol. 5, p. 258, 2017. K. Umetani, D. H. Singer, R. McCraty, and M. Atkinson, "Twenty-four hour time domain heart rate variability and heart rate: relations to age and gender over nine decades," Journal of the American College of Cardiology, vol. 31, pp. 593-601, 1998. S. Massaro and L. Pecchia, "Heart rate variability (HRV) analysis: A methodology for organizational neuroscience," Organizational Research Methods, p. 1094428116681072, 2016. N. Lippman, K. M. Stein, and B. B. Lerman, "Comparison of methods for removal of ectopy in measurement of heart rate variability," American Journal of Physiology-Heart and Circulatory Physiology, vol. 267, pp. H411-H418, 1994. U. R. Acharya, K. P. Joseph, N. Kannathal, C. M. Lim, and J. S. Suri, "Heart rate variability: a review," Medical and biological engineering and computing, vol. 44, pp. 1031-1051, 2006. 9
VOLUME XX, 2018
2169-3536 (c) 2018 IEEE. Translations and content mining are permitted for academic research only. Personal use is also permitted, but republication/redistribution requires IEEE permission. See http://www.ieee.org/publications_standards/publications/rights/index.html for more information.
This article has been accepted for publication in a future issue of this journal, but has not been fully edited. Content may change prior to final publication. Citation information: DOI 10.1109/ACCESS.2018.2831209, IEEE Access
[50]
[51] [52] [53]
J. Karvonen and T. Vuorimaa, "Heart rate and exercise intensity during sports activities," Sports Medicine, vol. 5, pp. 303-311, 1988. W. E. Burr, "Selecting the advanced encryption standard," IEEE Security & Privacy, vol. 99, pp. 43-52, 2003. C. Gentry, A fully homomorphic encryption scheme: Stanford University, 2009. A. L. Goldberger, L. A. Amaral, L. Glass, J. M. Hausdorff, P. C. Ivanov, R. G. Mark, et al., "Physiobank, physiotoolkit, and physionet," Circulation, vol. 101, pp. e215-e220, 2000.
10 VOLUME XX, 2018
2169-3536 (c) 2018 IEEE. Translations and content mining are permitted for academic research only. Personal use is also permitted, but republication/redistribution requires IEEE permission. See http://www.ieee.org/publications_standards/publications/rights/index.html for more information.