31st Annual International Conference of the IEEE EMBS Minneapolis, Minnesota, USA, September 2-6, 2009
An Automatic 2D CAD Algorithm for the Segmentation of the IMT in Ultrasound Carotid Artery Images Dana E. Ilea, Paul F. Whelan Senior, Member, IEEE, Catherine Brown, and Alice Stanton Abstract—Common carotid intima-media thickness (IMT) is a reliable measure of early atherosclerosis - its accurate measurement can be used in the process of evaluating the presence and tracking the progression of disease. The aim of this study is to introduce a novel unsupervised Computer Aided Detection (CAD) algorithm that is able to identify and measure the IMT in 2D ultrasound carotid images. The developed technique relies on a suite of image processing algorithms that embeds a statistical model to identify the two interfaces that form the IMT without any user intervention. The proposed image segmentation scheme is based on a spatially continuous vascular model and consists of several steps including data preprocessing, edge filtering, model selection, edge reconstruction and data refinement. To conduct a quantitative evaluation each image was manually segmented by clinical experts and performance metrics between the segmentation results obtained by the proposed method and the ground truth data were calculated. The experimental results show that the proposed CAD system is robust in accurately estimating the IMT in ultrasound carotid data.
I. INTRODUCTION
A
events, myocardial infarction and stroke, are responsible for approximately 35% of total mortality in the western world, and are leading causes of morbidity burden world-wide. The first indication of atherosclerotic vascular disease is a thickening of the intimal and medial layers of the arterial wall. This results from inflammatory-fibroproliferative responses to various forms of insult. It involves lipid accumulation, and the migration and proliferation of many cells in the sub-intimal and medial layers, so that plaques are formed. It is the rupture of such plaques that causes myocardial infarcts (heart attacks), cerebrovascular events (strokes), peripheral vascular disease (gangrene) and kidney infarcts respectively. Early atherosclerosis (increased intima media thickness - IMT), is readily visualized in large superficial arterial vessels such as the common carotid using B-mode ultrasound and is a well established independent predictor of cardiovascular events. Hence, accurate acquisition and analysis of common carotid ultrasound image has considerable value in the early diagnosis of atherosclerosis, prognosis prediction, and in the monitoring of responses to lifestyle and pharmacological treatments for vascular disease. THEROTHROMBOTIC
Manuscript received April 23, 2009. This work was funded by the HEA PRTLI IV National Biophotonics & Imaging Platform Ireland (NBIPI). Dana E. Ilea and Paul F. Whelan are with the Centre for Image Processing & Analysis (CIPA), Dublin City University, Ireland (e-mail:
[email protected]). Catherine Brown and Alice Stanton are with the Department of Molecular and Cellular Therapeutics, Beaumont Hospital and the Royal College of Surgeons in Ireland.
978-1-4244-3296-7/09/$25.00 ©2009 IEEE
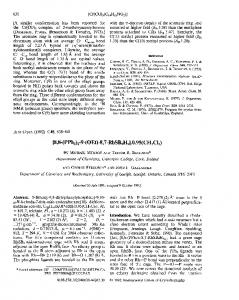
The goal of this paper is to introduce an efficient Computer Aided Detection (CAD) algorithm for the segmentation of the IMT in 2D ultrasound carotid images. The proposed technique aims to identify the IMT in order to detect early abnormalities in the carotid arteries using advanced image processing techniques. Because of its automatic character, the proposed segmentation algorithm is capable of robustly identifying the two interfaces of the IMT and overcomes the complications caused by poor quality ultrasound data (such as speckle noise, signal attenuation or occlusions). There are several approaches proposed for the IMT segmentation in the computer vision and medical imaging community. They include techniques based on edgedetection [1-3], dynamic programming [4], active contours (snakes) [5] and probabilistic approaches [6]. The majority of these techniques were built on the assumption that the two interfaces bordering the IMT are easily distinguishable and in general, they require a certain degree of user interaction. As illustrated in Fig. 1, in longitudinal sections of the common carotid artery, the IMT can be seen to be bordered by two quasi-parallel lines that represent the lumen-intima and the media-adventitia interfaces.
Fig. 1. Detail of an ultrasound image displaying the IMT’s two anatomical boundaries (as marked by our medical expert).
II. IMAGE ACQUISITION The experimental data consists of N = 49 longitudinal views of the common carotid artery (CCA) that were captured by our clinical partners from Beaumont Hospital, Dublin, Ireland from a cohort of women with and without pregnancy related hypertension. The images were acquired using a Philips IU22 ultrasound scanner fitted with VL13-5, L17-5 and L9-3 transducers. For evaluation purposes, images acquired with a HDI 5000CV scanner were also included in this study. III. PROPOSED SEGMENTATION ALGORITHM The developed CAD system relies on a suite of image processing algorithms that embeds a statistical model to identify the two interfaces that form the IMT complex without any user intervention. The proposed imaging segmentation scheme is based on a spatially continuous vascular model and consists of several steps that will be detailed in the following sub-sections of this paper. An outline of the proposed technique is illustrated in Fig. 2.
515
Authorized licensed use limited to: DUBLIN CITY UNIVERSITY. Downloaded on July 27,2010 at 11:09:24 UTC from IEEE Xplore. Restrictions apply.
Extract Edges (High scale) ROI
Adaptive Filtering
Contrast Enhancement
Primary Model Selection
Final IMT Interfaces
Edge Propagation
Extract Edges (Low scale)
Fig. 2 Schematic representation of the proposed IMT segmentation algorithm.
A. Global Contrast Enhancement The low contrast between the anatomical structures is one of the main drawbacks associated with the ultrasound imaging modality. Due to low echo responses caused by the ultrasound acquisition process, certain sections of the IMT have a reduced contrast and are not easily distinguishable (see Fig. 3a). In order to improve the appearance of the IMT and facilitate its detection, a global contrast enhancement based on data stretching between two pre-defined thresholds cmin and cmax, was applied: I ce ( x, y ) =
255[ I ( x, y ) − cmin ] cmax − cmin
B. Automatic Detection of the Region of Interest (ROI) The ROI where the search for the IMT will be carried out is the area situated above and below the interface that separates the blood and the tissue of the vessel’s far wall. To avoid any human intervention, we propose to automatically detect the blood tissue interface (referred to as the Tracked Interface-TI). In order to detect the TI and robustly segment the two image classes (blood and tissue), an adaptive thresholding algorithm [7] followed by an image refinement procedure was applied.
ni N
255
, i ∈ [0,255], hi ≥ 0, ∑ hi = 1
(2)
i =0
In equation (2), ni is the number of pixels with grey-level i, N is the total number of pixels in the image, N = n0+n1+...+n255 and hi represents the probability that the pixel with coordinates (x,y) in the contrast enhanced image takes the value i. The threshold k is automatically detected to maximize the between class variance as follows, max σ B2 (k ) = max{
k ∈[ 0, 255]
⎡ k −1
k −1 i =0
i
i =0
⎡ 255
255
+
k −1
⎤
255
∑ h ⎢⎣⎢∑ (ih ) / ∑ h − ∑ (ih )⎥⎦⎥ i
i
i =0
255
i
i =0
⎤
255
∑ h ⎢⎣⎢∑ (ih ) / ∑ h − ∑ (ih )⎥⎦⎥ i
i =k
i
i=k
i
i=k
h Γ ( x, y ) =
2
+
(3)
2
i
}
i =0
if I ce ( x, y ) ≤ k than I ce ( x, y ) = 0 if I ce ( x, y ) > k than I ce ( x, y ) = 255
(4)
2
∪m
i
= {m1 , m 2 }
(5)
i =1
(1)
where I(x,y) is the intensity value of the pixel situated at position (x,y) in the image matrix and Ice(x,y) is the contrast enhanced intensity value. Based on experimentation the values of cmin and cmax are set to 6 and 150 respectively and are kept constant for all images analyzed in this study. We would also like to note that the selection of these two thresholds proved to be robust irrespective of the ultrasound equipment that has been employed to capture the image data.
hi =
The refinement procedure is applied to the image resulting from the thresholding process (see Fig. 3b) with the purpose of eliminating the small and spurious regions and obtain a more compact image segmentation. The post processing process is carried out as follows: for each pixel in the thresholded image a histogram hΓ(x,y) is constructed in a Γ neighborhood (the value of the mask was chosen so that to be large enough to avoid erroneous assignments):
m1 =
∫ δ (I Γ
ce ( x,
y ),255)dΓ , m 2 =
∫ δ (I Γ
ce ( x,
y ),0)dΓ
⎧1 i = j ⎩0 i ≠ j
δ (i, j ) = ⎨
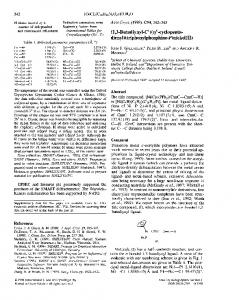
In equation (5), Г is the 7×7 neighborhood around the pixel with coordinates (x,y), m1 defines the number of white pixels in the mask, while m2 represents the number of black pixels. If m1>> m2 then the pixel under analysis belongs to the vessel tissue and it will be assigned a light grey level value, otherwise it corresponds to blood and it be set to 0. In order to facilitate the detection of the TI segment, the borders between the two classes are marked with a white line (see Fig. 3c). The TI interface is generated by the border pixels that simultaneously satisfy the following conditions: 1. Ice (x,y) =255; 2. Ice(x, y+α)=0; 3. Ice(x, y-α)>0. These conditions evaluate the local distribution of the postprocessed data around each border pixel (Ice(x,y)=255), and they state that the border pixel belongs to the TI interface if it has black neighbours for α pixels above it and bright neighbours for neighbours for α pixels bellow it. (The parameter α is adaptively detected and in this study the search is carried out in the interval [0, 10]). The resulting border segments that satisfy simultaneously the three conditions stated above will be filtered out and only a reduced number of segments will be retained for further analysis. Based on the anatomical structures that compose a carotid ultrasound image, the TI is always the longest continuous segment in the image area that obeys the three conditions discussed above. In Fig. 3d) it is shown the tracked interface for the ultrasound image displayed in Fig. 3a). Once the TI is identified, the ROI is set using the minimum (min_y) and maximum (max_y) coordinates of the tracked interface on the y-axis and the width of the original image. To this end, the ROI height is calculated as follows,
516 Authorized licensed use limited to: DUBLIN CITY UNIVERSITY. Downloaded on July 27,2010 at 11:09:24 UTC from IEEE Xplore. Restrictions apply.
ROI _ height = (max_ y − min_ y ) + 2 * s max
(6)
In equation (6), smax is a parameter that sets the model variation above max_y and below min_y to allow the inclusion of additional information in the ROI that will be necessary in the process of IMT reconstruction. Experiments demonstrated that a smax value of 15 is sufficiently large to generate a ROI that covers a large part of the lumen of the carotid artery beyond the adventitia irrespective of the resolution of the ultrasound images. The contrast enhanced image data sampled by the ROI will be further processed for the IMT identification.
(a)
(b)
(c)
(d)
(e) Fig. 3. Automatic ROI detection (a) Original carotid ultrasound image. (b) Thresholded image. (c) Post-processed image. The two main image classes are blood (in dark colour) and tissue (in grey colour). The borders between them are marked with white. (d) The automatically detected TI of the carotid artery. (e) The automatically determined region of interest for the image shown in a).
C. ROI Pre-Filtering The purpose of the pre-filtering step is to attenuate the speckle noise in a pre-defined neighborhood calculated around each pixel in the image. The Vector Median Filtering (VMF) [8] is a noise removal scheme that is able to locally adapt to the image content while preserving the contextual image information (edges). To filter the ROI, we iterate through the image with a square mask of size w×w centered at every pixel in the ROI. Using VMF, every pixel under analysis will be replaced with the pixel from its neighborhood w×w that returns the minimum Euclidian distance to all other pixels in the neighborhood as follows, I ROI ( pmin , qmin ) =
min
( p , q )∈w× w
∑
I ROI (u , v) − I ROI ( p, q)
detection, good localization and also satisfies the one response criterion by minimizing multiple responses for a single edge. The Canny edge detector extracts the gradient of the image data that is first convolved with a 2D Gaussian filter G, ∇[ I ROI ( x, y ) G ( x, y, σ )] , to reduce the occurrence of spurious edges caused by image noise. The scale σ is an essential parameter that sets the size of the Gaussian filter and its value is set in conjunction with the desired level of edge detail: fine versus coarse edges. Taking into consideration that fine edges are numerous and have an irregular (curly) appearance, this generates a difficult scenario when the edge segments are analyzed in the process of IMT detection. To address this issue, the algorithm proposed in this paper adopts a coarse to fine strategy for IMT detection. The initial (coarse) edge detection is performed when the scale of the Gaussian operator is set to σ=1.5. To improve the edge connectivity and remove the weak edges, non-maxima suppression and thresholding with hysteresis are applied [9]. This value of the scale parameter ensures that the irrelevant edges derived from image noise and weak textures are removed and only strong edge features are evaluated to extract the primary IMT model. This procedure will be detailed in the next section of this paper. E. Primary Model Selection This step of the proposed algorithm filters the initial coarse edge information that is extracted as explained in the previous section with respect to a spatially continuous vascular model. To extract the plausible edge segments within the ROI, the slope of the tracked interface (TI) line is calculated. This line represents an initial geometrical estimation for the two quasi-parallel lines that form the IMT. Starting from the initial edge structure shown in Fig. 4a) the edges whose slopes are not in agreement to the slope of the TI will be discarded. The slope-intercept parameters (aTI,bTI) of the TI and of the initial edge segments are estimated using least squares fitting, as shown in equation (8).
aTI =
I ROI ( x, y ) ← I ROI ( p min , q min ) In equation (7), (pmin, qmin) are the coordinates of the pixel that returns the minimum distance to all pixels located within the mask w×w. To attain feature preservation, the VMF should be applied in a small neighborhood to prevent the edge attenuation that occurs when the VMF filtering scheme is applied for large neighborhoods. In our implementation the neighborhood w×w is set to 3×3. D. Initial Edge-Structure Extraction The next step of the algorithm extracts the initial edge structure of the plausible IMT segments around the area of interest using the Canny edge detector [9]. The reason for selecting Canny for edge detection is that it achieves good
i =1
n
n
(7)
(u ,v )∈w× w
∑
xi yi −
i =1
∑ ∑ xi
i =1
∑x
2 i
n
n
n
n
n
i =1 2
⎞ ⎛ xi ⎟ −⎜ ⎟ ⎜ ⎝ i =1 ⎠ n
∑
yi
,b = TI
n
n
n
∑y ∑x −∑x ∑x y 2 i
i
i =1
i =1 n
n
i =1
∑x i =1
i
2 i
i i
i =1 2
(8)
⎛ ⎞ xi ⎟ −⎜ ⎜ ⎟ ⎝ i =1 ⎠ n
∑
In equation (8), x is the vector that holds the coordinates on the x-axis for each pixel of the TI (see Fig. 3d)), while y is the vector that hold the coordinates on the y-axis of every pixel of the TI. The parameter n is the total number of pixels that define the TI. The linear least square fitting algorithm provides a robust statistical solution to determine the slopeintercept parameters and we use this information to construct the vascular model that consists of pairs of quasi-parallel lines. To achieve this, the edge information is analysed so that only the edge segments whose slopes are in agreement to the TI’s slope are retained. If (aj, bj) are the slopeintercept parameters for an edge segment j contained in the coarse edge data, then the edges that satisfy the following condition, a j − aTI < 0.2 are retained. The retained edge
517 Authorized licensed use limited to: DUBLIN CITY UNIVERSITY. Downloaded on July 27,2010 at 11:09:24 UTC from IEEE Xplore. Restrictions apply.
segments (shown in red) are superimposed on the contrast enhanced ROI and are depicted in Fig. 4b). We continue the construction of the primary model by calculating for each retained edge segment the local mean values above and below it to ensure that is part of the lumenintima or media-adventitia interface.
∑
LMVA p =
∑I
ce ( x,
y + q)
(∀)( x , y )∈N ps q∈( 0,3]
∑
LMVB p =
(9)
3 * size( N ps )
∑I
ce ( x,
(∀)( x , y )∈N ps q∈( 0,3]
3 * size( N ps )
y − q) (10)
In equations (9) and (10) p is the index of the edge segment under analysis p ∈ [1, N es ] , Nes is the total number of edge segments, Nps is the image domain defined by the pixels of the edge segment with index p, LMVAp is the local mean value above the segment p, LMVBp is the local mean value below the segment p and (x,y) are the coordinates of the edge segment p. Based on the echogenicity of the main anatomical structures, there are two conditions that are always valid in images displaying longitudinal views of the carotid arteries:
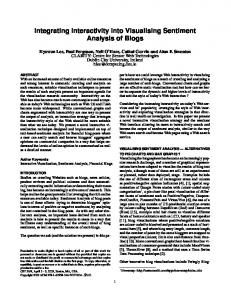
the primary IMT model that represents an accurate marker that allows the identification of the IMT segments in the edge data extracted at a low scale. The low scale edge structure is shown in Fig. 4d). To obtain good edge estimates, the edge segments are analyzed using the least square fitting principle detailed in Section III.E and the result is shown in Fig. 4e). The next step of the algorithm propagates the information associated with the primary model to select the lower scale edge segments that are spatially contiguous and consistent with the geometrical characteristics associated with the primary IMT model. To achieve this, a list of edge terminators for each segment of the primary model is extracted. Then, for each edge terminator we search for edge pixels in the low scale edge data and the reconstruction process is initiated in an iterative fashion until the last segment that obeys the primary model geometric conditions is reached. This process is applied for all edge terminators and the reconstructed structure is added to the primary model. The final IMT segmentation for the image in Fig. 3a) is shown in Fig. 4f).
(a)
1. The regions above the intima layer is the lumen and always is characterised by low intensity pixel values. 2. The adventitia (located after the media layer) is generally characterised by high intensity pixel values.
Building on these two principles that are sampled by equations (9) and (10), the primary model selects the upper IMT candidate segments as those for which the LMVAp value is a local minima and the lower candidate IMT segments as those for which the LMVBp value is the local maxima. Because the IMT is always composed of pairs of quasi-parallel lines, a model consisting of two parallel lines is embedded to ensure the continuity of the primary model. In this process the spurious edge segments and those that do not obey the model are eliminated. The final primary model obtained for the IMT of the image shown in Fig. 3a) is depicted in Fig. 4c). F. Edge Data Reconstruction The edges that define the primary model will be further propagated using the additional edge information resulting after the application of the Canny edge detector (to the image previously subjected to contrast enhancement and adaptive filtering) where the scale of the Gaussian operator is set to a lower value (σ = 0.5). After the Canny edge detector is applied, a large number of edges will result, but only those that are adjacent or positioned close to the primary IMT model will be retained for further analysis. The motivation behind the selection of the proposed coarse to fine approach is that the edge information generated at a low scale is not robust, as the number of edges is very high, and it would be extremely difficult to extract the relevant edges that can be used in the IMT detection. Conversely, the coarse edge segments are more robust and they are used to generate
(b)
(c)
(d)
(e)
(f) Fig. 4. Intermediate steps of the proposed segmentation algorithm. (a) Initial edge structure. (b) The filtered edges that are quasi-parallel to the TI are superimposed on the contrast-enhanced image. (c) The primary IMT model. (d) The lower scale edges. (e) Lower scale edges filtered using least square fitting. (f) The final pair of lines of the IMT complex resulting after the edge data reconstruction (the maximum IMT value calculated by our algorithm is 0.70 mm).
IV. EVALUATION OF THE PROPOSED ALGORITHM All 49 images contained in our database have been manually annotated by clinical experts from Beaumont Hospital. The accuracy of the algorithm is determined by computing the minimum Euclidian distance between the pixels situated on the border of the lumen-intima interface and media-adventitia interface in the ground truth image and the pixels from the lumen-intima interface and media adventitia interface identified by the proposed algorithm. To evaluate the border displacement between the ground truth annotated data and the segmented IMT, the mean, standard
518 Authorized licensed use limited to: DUBLIN CITY UNIVERSITY. Downloaded on July 27,2010 at 11:09:24 UTC from IEEE Xplore. Restrictions apply.
deviation and Root Mean Square errors were calculated. The evaluation was performed separately for both interfaces that form the IMT. The overall numerical results (calculated both in pixels and in mm) are shown in Table I (lumen-intima interface) and in Table II (media-adventitia interface). In Table III the overall average errors calculated for maximum and minimum displacements between the ground truth annotated IMT and the estimated IMT are shown. The numerical results indicate that no significant differences between the ground truth IMT and the segmented IMT occur, and we can conclude that the proposed approach is able to accurately detect the IMT. TABLE I THE OVERALL POINT TO CURVE ERRORS BETWEEN THE PROPOSED SEGMENTATION ALGORITHM AND THE GROUND TRUTH DATA WHEN CALCULATED FOR THE LUMEN-INTIMA INTERFACE
Errors (mm) Errors (pixels)
μLumen-Intima
σ Lumen_Intima
RMSLumen_Intima
0.079 0.989
0.058 0.725
0.100 1.248
TABLE II THE OVERALL POINT TO CURVE ERRORS BETWEEN THE PROPOSED SEGMENTATION ALGORITHM AND THE GROUND TRUTH DATA WHEN CALCULATED FOR THE MEDIA-ADVENTITIA INTERFACE
μMedia-
σMedia-Adventitia
Adventitia
Errors (mm) Errors (pixels)
The developed algorithm requires approximately 2 seconds to process one ultrasound image. The experiments have been conducted using a 2.4 GHz AMD X2 4600 PC and running Windows XP. V. CONCLUSION The major aim of this paper was to introduce a novel algorithm for the segmentation of the IMT in longitudinal carotid ultrasound images. The main novelty of this approach resides in the development of an unsupervised algorithm that embeds a statistical IMT model in a coarse to fine fashion. The proposed algorithm proved to produce accurate segmentation results when applied to various carotid ultrasound images that are characterized by lowresolution and high level of image noise. This research is ongoing and we plan to extend the capabilities of the proposed CAD system to automatically measure the IMT in multidimensional (2D+time) ultrasound carotid data in order to allow the calculation of dynamical properties of the carotid artery. Future additional testing of the algorithm will also include images from patients with more advanced disease, i.e. with focal thickenings and actual plaques.
RMSMedia-
REFERENCES
Adventitia
0.082 1.045
0.060 0.750
0.103 1.304
[1]
[2]
TABLE III THE OVERALL AVERAGE ERRORS CALCULATED FOR MAXIMUM AND MINUMUM DISPLACEMENTS BETWEEN THE GROUND TRUTH ANNOTATED IMT AND THE IMT ESTIMATED BY THE PROPOSED METHOD.
Average Errors (mm) Average Errors (pixels)
(c) IMTmax=0.60 mm. (d) IMTmax=0.67 mm. (e) IMTmax=0.75 mm. For visualization purposes, in this figures the IMT was marked with a thick white line.
Max_IMT
Min_IMT
0.085 1.061
0.065 0.795
[3]
[4]
[5] (a) [6] (b)
[7]
(c)
[8]
(d)
[9] (e)
C. Liguori, A. Paolillo, and A. Pietrosanto, “An automatic measurement system for the evaluation of carotid intima-media thickness”, IEEE Trans. on Instrumentation and Measurement, vol. 50, no. 6, pp. 1684-1691, Dec. 2001. R. H. Selzer, W. J. Mack, P. L. Lee, H. Kwong-Fu, H. N. Hodis, “Improved common carotid elasticity and intima-media thickness measurements from computer analysis of sequential ultrasound frames”, Atherosclerosis, vol. 154, no. 1, pp. 185-193, 2001. F. Faita, V. Gemignani, E. Bianchini, C. Giannarelli, and M. Demi, “Real-time measurement system for the evaluation of the Intima Media Thickness with a new edge detector”, in Proc. 28th IEEE. Engineering in Medicine and Biology Society, pp.715-718, 2006. Q. Liang, I. Wendelhag, J. Wikstrand, and T. Gustavsson, “A multiscale dynamic programming procedure for boundary detection in ultrasonic artery images”, IEEE Trans. on Medical Imaging, vol. 19, no. 2, pp. 127-142, Feb. 2000. C. P. Loizou , C. S. Pattichis , M. Pantziaris , T. Tyllis, and A. Nicolaides, “Snakes based segmentation of the common carotid artery intima media”, Medical and Biological Engineering and Computing, vol. 45, no. 1, Jan. 2007. F. Destrempes, J. Meunier, M.-F Giroux, G. Soulez, and G. Cloutier, “Segmentation in Ultrasonic B-Mode Images of Healthy Carotid Arteries Using Mixtures of Nakagami Distributions and Stochastic Optimization”, IEEE Trans. on Medical Imaging, vol. 28, no. 2, pp. 215-229, Feb. 2009. N. Otsu, “A threshold selection method from gray-level histograms”, IEEE Trans. on System, Man, and Cybernetics, vol. 9, no. 1, Jan. 1979. J. Astola, P. Haavisto, and Y. Nuevo, “Vector median filters”, Proc. of IEEE, vol. 79, pp. 678-689, 1990. J. Canny, “A computational approach to edge detection”, IEEE Trans. on Pattern Analysis and Machine Intelligence, vol. 8, no. 6, pp. 679698, 1986.
Fig. 5. Additional IMT segmentation results using the proposed segmentation method. (a), (b), (c), (d) and (e) The segmented IMT superimposed on the original ROI data. The maximum IMT values calculated by our algorithm are: (a) IMTmax=0.76 mm. (b) IMTmax=0.76 mm.
519 Authorized licensed use limited to: DUBLIN CITY UNIVERSITY. Downloaded on July 27,2010 at 11:09:24 UTC from IEEE Xplore. Restrictions apply.