U2013 Proceedings of Intemational Conference on Modelling, Identification & Control (ICMIC) Cairo, Egypt, 31stAug.- 2ndSept. 2013
An Efficient Method for Estimation of Power Line Interference in ECG Nauman Razzaq, Maryam Butt, Muhammad Salman, Khalid Munawar, Tahir Zaidi
Abstract- In this paper we present a computationally efficient
method
interference
for
(PLI)
frequency
present
in
estimation an
ECG
of
power
signal.
line
Accurate
estimation of PLI frequency leads to its effective removal from ECG signal. Using an intelligent frequency search approach, we achieve a high resolution estimate of PLI frequency with minimal discrete Fourier transform evaluations. Computational complexity of proposed algorithm is much reduced as compared to Fast Fourier Transform (FFT). The proposed approach is equally effective in non-stationary environment, where PLI frequency drifts with time.
Index Terms- Electrocardiography; Power Line
Interference; frequency estimation; Intelligent Discrete
Fourier Transform.
I. INTRODUCTION LECTROCARDTOGRAPHY
E tool for diagnosing cardiac health in clinical process.
(ECG) signal is a necessary
Power line interference (PLI) is a commonly seen disturbance in ECG and may often mask the crucial information, therefore it is required to be eliminated. Ideally the frequency of PLI should be 50Hz or 60Hz depending upon the regional power system. In a 50Hz scenario it may, however, vary between 45Hz and 55Hz. Accurate estimation of PLI frequency is a key to tuning the adaptive notch filter (ANF) for effective PLI suppression. Many techniques for spectrum estimation are available in the literature [1]. Kenefic proposed the maximum likelihood (ML) approach [2]. Fertig used the linear prediction properties of the sinusoidal signal and proposed the modified covariance method [3]. H.C. So proposed the harmonic decomposer technique in which he Manuscript received on May 5, 2013. This work is part of the project undertaken with mutual collaboration of National University of Sciences and Technology (NUST) and National Institute of Heart Diseases (NlHD), Pakistan. Nauman Razzaq, a corresponding author is with department of Electrical Engineering, College of E&ME, National University of Sciences and Technology (NUST), Islamabad, Pakistan. (Phone: +92-51-9278055 ext 4280; Fax: +92-51-9278049; e-mail: nauman.razzaq@ceme. nust.edu.pk). Maryum Butt is with department of Electrical Engineering, College of E&ME, National University of Sciences and Technology, Islamabad, Pakistan. (email: maryambutt2011@ceme. nust.edu.pk). Muhammad Salman is with department of Electrical Engineering, College of E&ME, National University of Sciences and Technology, Islamabad, Pakistan. (email: salmanmasaud@ceme. nust. edu.pk). Khalid Munawar is with department of Electrical and Computer Engineering King Abdulaziz University, Jeddah, Saudi Arabia. (email:
[email protected]). Tahir Zaidi is with with department of Electrical Engineering, College of E&ME, National University of Sciences and Technology, Islamabad, Pakistan. (email: tahirzaidi@ceme. nust.edu.pk).
used data matrix instead of covariance matrix [4]. Rim Elasmi-Ksibi et al. have used Pisarenko harmonic decomposition (PHD) with adaptive normalized second-order IIR notch filter for unbiased frequency estimation [5]. The techniques used in [2], [3], [4] and [5] are all statistical based and are therefore computationally demanding. Fourier Transformation is extensively used for frequency estimation; however computational complexity and latency impedes its effectiveness. D.Agrez used interpolated DFT for frequency estimation to acquire high resolution [6]. H. W. H.W. Fung proposed a Discrete Fourier Transform (DFT) based method which is effective for short data length [7]. Acharya used modified form of short time Fourier transform (STFT) for frequency estimation of PLI [8]. I. Djurovic et al. proposed frequency estimation based on L filter DFT [9]. Most of these techniques are complex and difficult to implement. In this paper, we propose an intelligent Discrete Fourier Transform based algorithm that searches for PLI frequency in 45-55Hz band for a 50Hz environment and then iteratively narrows down the frequency search region to achieve high resolution estimation of PLI frequency. The key advantages are high resolution frequency estimation and significantly low computational cost. Rest of the paper is organized as follows. Section II discusses the limitations of Fast Fourier Transform (FFT) to achieve the high resolution estimation of PLI. Section III describes the proposed algorithm. Simulation results and related discussions are presented in section IV. A comparison among FFT, DFT and the proposed algorithm has been carried out in section V. Finally conclusion is drawn in Section VI. II. FREQUENCY ESTIMA nON OF PLI
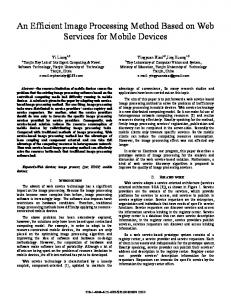
A. Spectrum Analysis ofECG corrupted with PL1 Fourier analysis allows us to observe the information contained at different frequencies. We can estimate PLI frequency by only observing the frequency band of 45-55Hz. A good quality ECG signal should not have power line disturbance more than 0.5% of the peak-to-peak QRS amplitude i.e. ECG signal to PLI noise Ratio should be more than 200 [10]. Typical spectral distribution of PLI corrupted ECG having SNR of 200 is shown in Fig. 1. The PLI noise can be observed in the frequency band of 45-55 Hz.
275
U2013 Proceedings of International Conference on Modelling, Identification & Control (lCMIC) Cairo, Egypt, 31stAug.- 2ndSept. 2013
40 ,---�--�----�__,
achieved by FFT. If we have sampling frequency of 1KHz and choose N=1024, we will have a frequency resolution of 1Hz which is not high enough to monitor minor changes in PLI frequency because PLI generally drifts in fractions of Hz. Increasing the sampling frequency further deteriorates the resolution of PLI frequency estimation when used with the same number of samples.
20
C.
-40
To achieve high frequency resolution, we need to increase the data length which leads to increased computational complexity as well as increased time delay. To achieve frequency resolution of 0.1 Hz with sampling frequency of 1 KHz, we require N=IO,OOO samples that gives a time lag of 10 sec. Therefore on-line observation of minor frequency deviation is impractical with small data length. A comparison of computational complexity of DFT, FFT and proposed PLI frequency estimation approach is given in section 5.
-60 �--�--�----�� 40 o 10 20 30 50 60 70 Frequency (Hz)
Fig. I. Magnitude spectrum of an ECG signal which is corrupted by PLl disturbance. Here the frequency of PLI is 51.275Hz and signal to noise ratio is 200.
In Fig. 2, the desired frequency band of 45-55Hz is shown which demonstrates the clear domination of PLI disturbance (51.275Hz). Thus PLI having SNR up to 200, can be easily identified through peak detection in the desired frequency band.
III. PROPOSED A LGORITHM FOR PLI FREQUENCY ESTIMATION
PLI in selected frequency band 40 ,-----�--__,
iii' 13 ID 13 '" "" c '" '" :2
Our proposed algorithm is based on an intelligent frequency search technique based on DFT. First we explain why DFT was preferred over FFT. The DFT of N samples for K number of discrete frequencies can be obtained using following relations:
20
0
X ((OK)
-20
50 Frequency (Hz)
L Xn-e-
j271-KnlN
(2)
n=O
n
nth discrete sample in time domain, N is the number of discrete time samples and K is the number of discrete frequencies. Because we have proposed algorithm based on the DFT, we may choose N different from K , which was not possible in FFT. As explained in section 2, the PLI signal dominates the frequency band of 45-55 Hz, it is worthwhile if the discrete frequencies can be selected within this small band only, whereas FFT by design determines the frequency contents in the frequency band ranging from 0 to Is / 2 . In this way we
For discrete time signal, DFT is generally used to analyze the frequency components. However DFT is considered as computationally intensive. FFT is an alternative which may reduce the computational burden from 2N2 to 2Mog2(N). FFT, however, imposes some implementation restrictions, as discussed next.
can enhance the frequency resolution even with the reduced number of samples. Therefore, with the comparable overall computational complexity, much better frequency resolution is achieved. The frequency resolution of DFT over a selected frequency band can be defmed as
Spectral Resolution
FFT provides a discrete frequency spectrum, in which the frequency contents of a discrete time signal are expressed in the form of evenly spaced frequency bins. The frequency resolution of FFT is defined as
dfm =Is / N
N-I =
Where X ((OK) is spectrum at Kth frequency OJK, X is the
55
Fig. 2. Domination of PLI disturbance in frequency band of 45-55 Hz
B.
Data Length
df =",f / f.l Where ",f is the selected frequency band,
(3) f.l
is the
number of frequency bins (i.e. number of discrete frequencies selected) and df is achieved frequency resolution. If we
(1)
choose frequency band of 45-55 Hz ( i.e., ",f =10 Hz) and
where Is is sampling frequency, N is the number of samples
f.l
of discrete time signal and dfw[ is the frequency resolution 276
=100, we can achieve frequency resolution of O.lHz.
U2013 Proceedings of International Conference on Modelling, Identification & Control (ICMIC) Cairo, Egypt, 31stAug.- 2ndSept. 2013
1st iteration
'�====�I====�=====+ I ====� I ====�I=== - -=-;�J=====� 1 '= = ==�I�==� I====�' Hz , 52 , ':9 -S O 51 53 54 55 45 46 47 48 _
_
-
---
-