>
An Efficient Signature Verification Method based on an Interval Symbolic Representation and a Fuzzy Similarity Measure Alireza Alaei, Srikanta Pal, Umapada Pal, Senior Member, IEEE, and Michael Blumenstein, Senior Member, IEEE Abstract— In this paper an efficient off-line signature verification method based on an interval symbolic representation and a fuzzy similarity measure is proposed. In the feature extraction step, a set of Local Binary Pattern (LBP) based features is computed from both the signature image and its under-sampled bitmap. Interval-valued symbolic data is then created for each feature in every signature class. As a result, a signature model composed of a set of interval values (corresponding to the number of features) is obtained for each individual’s handwritten signature class. A novel fuzzy similarity measure is further proposed to compute the similarity between a test sample signature and the corresponding interval-valued symbolic model for the verification of the test sample. To evaluate the proposed verification approach, a benchmark offline English signature dataset (GPDS-300) and a large dataset (BHSig260) composed of Bangla and Hindi off-line signatures were used. A comparison of our results with some recent signature verification methods available in the literature was provided in terms of average error rate and we noted that the proposed method always outperforms when the number of training samples is eight or more. Index Terms— Off-line signature verification; Interval-valued symbolic representation; Fuzzy similarity measure; Texture feature extraction.
I. INTRODUCTION
B
is defined as an automated use of physiological or behavioural characteristics of an individual for identification/authentication purposes. Many different biometric identification systems have been proposed as a means of determining or verifying personal identity using different behavioural characteristics. Signatures, as one of the behavioural human characteristics, are extensively used as a proof of identity for legal purposes on many documents such as bank cheques, credit cards, and wills in our daily lives. Considering the large number of signatures handled daily through visual inspection by authorized persons, construction IOMETRICS
A. Alaei is with the School of Information and Communication Technology (ICT) and Griffith Institute for Tourism (GIFT), Griffith University, Gold Coast, Australia (e-mail:
[email protected]). S. Pal was with the School of ICT, Griffith University, Gold Coast, Australia (
[email protected]). U. Pal is with the CVPR Unit, Indian Statistical Institute, Kolkata, India (
[email protected]). M. Blumenstein is with the School of Software, University of Technology Sydney, Australia (
[email protected]).
of an efficient automatic system to handle such a huge volume of signatures has many potential benefits for signature authentication to reduce fraud and other crimes [1, 23-26]. A quick look at the literature of signature identification / verification indicates that handwritten signature identification / verification systems are well established. A wide range of algorithms have already been developed in the past few decades to automatically process handwritten signatures in various signature-based applications, such as person identification / verification, cheque fraud detection, bank transactions, and crime detection [1, 23-26]. Considering the way in which the proposed methods in the literature dealt with the handwritten signatures, the methods can be categorized into two groups: a) identification, and b) verification [4]. The identification methods decide the signature group among a number of groups that the claimed signature belongs to, and the verification methods decide acceptance or rejection of a person's claimed signature. Three different types of forgeries (random, simple and skilled forgeries) have commonly been used in the literature [1]. Random and simple forgery samples are generated by individuals without any knowledge about the signers and their signatures, whereas, samples of skilled forgeries are produced by people who have already seen an original instance of a signature and try to generate a copy of the original signature as close as possible to the original one. Indeed, the problem of signature verification considering skilled forgeries is a challenging task [1, 4]. Since data/signature collection can be performed using online and off-line mediums, the signature verification methods in the literature can consequently be grouped into on-line and off-line approaches [1, 4]. On-line signature verification systems generally have higher performance compared to offline signature verification systems. This is because on-line systems take into account different dynamic information such as velocity, acceleration, pressure, stroke order, force, etc. that are not available in off-line systems. Moreover, as off-line signature verification systems use statistical information determined from the signature images, the problem becomes much more complicated. Nevertheless, off-line signature verification systems are more popular as most signatures are written on papers, documents, checks, etc. In this research work, a new model-based writer-dependent technique employing interval-based symbolic representation and a fuzzy membership function for off-line signature verification is proposed. Interval-valued symbolic data is
> created using texture-based features. The proposed signature verification system is further evaluated using different datasets. The remainder of this paper is organized as follows. Section II explains the related work. The main contributions of the work are discussed in Section III. In Section IV, the proposed method is detailed. Database details, experimental settings and evaluation metrics are presented in Section V. The experimental results are provided in Section VI. In Section VII, a comparative analysis of the proposed method with other existing methods is provided. Finally, conclusions and future work are presented in Section VIII. II. RELATED WORK In the off-line handwritten signature verification area, a significant volume of research has been undertaken for the development of different authentication methods [1-14, 19, 23-45, 51-54]. Reviews of different methods proposed for signature identification/verification at different periods of time can be found in [1, 23-26]. Recently, some competitions have also been organized to evaluate the technological achievements in terms of reliability and accuracy in the field of signature verification [2, 9]. The state-of-the-art methods for signature verification are commonly composed of the following steps: pre-processing, feature extraction, training a classifier or creating a knowledge-based model followed by the final verification criteria [1, 24]. In the pre-processing step, different tasks such as signature extraction, size normalization, binarization, skeletonization, skew/slant correction, and noise removal have generally been undertaken to prepare the signature images for further processing [24]. Various feature extraction techniques based on geometric or Connected Component (CC) analysis, directional and gradient of orientation, mathematical transformations, profiles and shadow-code, texture information, and interest points have been proposed in the literature to interpret different aspects of signature images for the purpose of verification [314, 19, 27-31]. Off-line signature verification methods can broadly be categorized into local [3, 6, 7, 8, 10-14, 19, 27-31, 34-37, 39, 41, 42, 55] and global [3-6, 11, 13, 32, 33, 36-38, 40] approaches considering the features extracted at the local or global level in the feature extraction stage. It is worth mentioning that local features have predominantly provided better verification accuracies than the global features. Different learning strategies, such as machine learning and similarity-based approaches, have been proposed in the literature to solve the problem of signature verification. Machine learning approaches include Neural Networks (NNs) [4, 7, 19, 42], Bayes classifier [3], Hidden Markov Models (HMMs) [30, 34, 36, 38, 41], Support Vector Machines (SVMs) [5, 10-14, 27-28, 31, 37, 38, 40-42], Gaussian Mixture Models (GMMs) [6], Gentle AdaBoost algorithm [39], and Ensembles of classifiers [41]. Similarity-based approaches comprise the following: k-Nearest Neighbour (kNN), Dynamic Time Warping, and point matching [3, 6, 8, 12, 19, 29, 32-36]. These models can further be categorized
into writer-dependent and writer-independent models. In a writer-dependent approach, a specific model is trained for each individual’s signatures (class) using some genuine signatures of the individual and a few random forgeries. In the testing phase, using the trained model, a test signature is classified as a genuine or forged one. For the writerindependent approach, on the other hand, a single model is trained for all the signature classes to be used for the verification task. Hybrid models have also been used for signature verification [1, 23-26]. Signature verification methods based on the concept of fuzzy sets and different fuzzy membership functions have also been developed in the literature [43-46]. In [43], geometric features, as a family of shape factors, and the coding of information related to the dynamics of the signature, have been used to characterize signature images. A fuzzy technique has then been adapted to combine these two types of information for off-line signature verification. In the studies presented in [44, 45], a signature image has initially been preprocessed using binarization, size normalization, and thinning methods. The thinned image has then been partitioned into a number of sub-images to compute features consisting of angle information. A fuzzy system based on the Takagi–Sugeno (TS) model and an exponential membership function has further been used for the signature verification task [44, 45]. The TS model with structural parameters takes into account the local variations in the characteristics of the signature [45]. The membership functions constitute weights in the proposed modification of the TS model to provide better results [45]. A method based on the spectral analysis of a directional gradient density function and a weighted fuzzy classifier has been proposed for off-line signature verification in [46]. The outline of a signature image was initially extracted and the frequency spectrum was then computed using a directional gradient density function as the feature set. A weighted fuzzy classifier based on a triangular membership function was adapted for the verification of forgeries [46]. An overview of the signature verification methods, which exist in the literature, is provided in Table I. From the literature reviewed, it is noted that there has been significant progress in the off-line signature verification domain. However, despite the progress in the area over the past decades, it remains an open research problem [1, 2, 23, 24]. In addition to the limitations mentioned in Table 1, some general challenges [24] in the area of off-line signature verification that still attract many researchers for further investigation in this field are indicated as follows: i) high intra-class variability in handwritten signatures of every individual compared to the physiological biometrics, such as fingerprints or iris of the individual, ii) low inter-class variability between genuine signatures and skilled forgeries of every individual, iii) the existence of only genuine signatures as partial knowledge for training off-line signature verification systems, iv) limitations in the amount of signature data available for training off-line signature verification systems in real scenarios, as during the enrolment process users often provide only a few samples of their signatures, and v) the presence of
>
TABLE I OVERVIEW OF DIFFERENT SIGNATURE VERIFICATION METHODS. Type / approach HMM-based
Methods 30, 34, 36, 38, 41
NN-based
4, 7, 19, 42
SVM-based
5, 10-14, 27-28, 31, 37, 38, 40-42
GMM-based
6
Bayesian-based
3
Similarity-based
3, 8, 12, 29, 32, 33, 35, 36
Limitations Poor performance when few signature samples are available for training, needs reconstruction whenever a new writer is added to the system. Needs enough data for training and convergence, needs to retrain the neural networks in the case of changing the number of signature classes. Needs to find an appropriate kernel and then tuning its parameters, has high algorithmic complexity and extensive memory requirements in large-scale tasks. Needs to estimate an appropriate number for the Gaussian components, lacks the generalisation ability to make accurate predictions for new data. There is no precise way to obtain prior knowledge, posterior distributions are heavily influenced by the prior knowledge. Needs to choose an appropriate distance, it is very sensitive to irrelevant features as all features contribute to the similarity and thus to the classification
signatures written in different scripts. Furthermore, with particular reference to fuzzy-based signature verification methods, we noted that only a few related papers have been reported in the literature despite the progress achieved in the signature verification field. Moreover, the membership functions and also the fuzzification processes used for signature verification are mostly based on the exponential and Gaussian membership functions, which provide a probability very close to zero for a sample that deviates much from the mean in the Gaussian as well as in the log-space models. This would mean a very large negative number is added to the accumulation probability result. That is a big penalty for the cases where handwritten genuine signatures are roughly written by genuine authors. In the present research work, we mainly focus on the problem of inter-/intra-class variability of handwritten signatures.
signatures is further proposed. The applicability of the proposed method is demonstrated using two different benchmark datasets. The proposed system is simple and can be constructed with a few samples. Furthermore, the proposed scheme does not need to retrain the model whenever a new writer is added to the system. IV. PROPOSED METHOD The proposed method includes four main steps: a) preprocessing, b) feature extraction, c) creation of an intervalvalued symbolic model for each individual, and d) computation of similarity values and the final decision. An overview of our proposed signature verification method is shown in Fig. 1. Each step of the proposed method is detailed in the following subsections.
III. MAIN CONTRIBUTIONS In the past, the concept of symbolic data analysis and its representation [16] has been used in various applications of document image analysis, such as document classification and signature verification [17-19]. In this research work, a new model-based writer-dependent technique is proposed to create a fuzzy set for each feature by means of an interval-based symbolic representation. This process provides only one representative model for each individual’s handwritten signature instead of many feature vectors, which represent different signatures of an individual. The proposed intervalvalued symbolic representation can take care of intra-class variability of the signatures in each class. A fuzzy membership function as a fuzzy similarity measure is also proposed to obtain a similarity measure between a test feature vector and the interval-valued symbolic data. The proposed fuzzy similarity measure can handle the problem of inter-class variability between genuine signatures and skilled forgeries providing low membership values for the forged signature features compared to the genuine signature features. For feature extraction, we consider texture features, as they have demonstrated their strength on different applications of biometrics and texture analysis [27, 47, 48]. A texture feature extraction technique based on under-sampled bitmaps of the
Fig. 1.
An overview of the proposed method.
> A. Pre-processing Similar to most pattern recognition problems, preprocessing plays an important role in signature verification systems as well. Signature images, even genuine signatures of an individual, include significant variations in terms of size, rotation/slant, pen thickness, etc. Therefore, the preprocessing step, prior to the application of feature extraction methods, is employed on the images to make the images noise-free and have transition invariant features. To do so, first, a histogram-based threshold technique is applied to convert the digitized grey-scale signature images to two-tone images. A mean filter is also employed on the signature images to remove noise. The input images are then cropped to find minimum bounding boxes of the signature images. The cropped signature images of size M × N are then used for feature extraction. Under-sampled bitmap images have been used in the literature for pattern recognition [50]. In this research work, we have further considered the under-sampled bitmap for feature extraction, since the under-sampled version of an image can be considered as a low resolution version of the image whilst keeping the whole visual appearance of the original one. To compute the under-sampled bitmap, the input image is divided into a number of non-overlapping blocks of similar size, say b × b. The number of black pixels in each block is then counted and represents the block intensity. This generates a matrix of size M/b × N/b with each element being an integer in the range 0 to the size of the nonoverlapping block. Dividing these values by the size of the block and multiplying the results by 255 provides an undersampled grey image where all pixel values are normalized between 0 and 255. A pictorial representation of the techniques involved in the pre-processing step is shown in Fig. 2(a-h). B. Feature extraction In the present research work, texture-based features are considered for feature extraction. Texture features, such as the Local Binary Pattern (LBP), the Local Derivative Pattern (LDP), and Grey Level Co-occurrence Matrix (GLCM), have widely been employed in different biometric systems including signature verification and some promising results have also been provided [10, 15, 27]. Notable results obtained in signature verification using the texture features, especially the LBP-based features, are due to the exceptional properties of the LBP-based features, which can provide important information about the personal characteristics of a signer including such elements as the amount of pressure and speed changes, pen-holding, ink distribution, etc. [27]. The LBP features are also computationally efficient and these features have shown their robustness to monotonic illumination change [54]. The LBP features are, however, sensitive to random noise and non-monotonic illumination variation [4749].
(a)
(b)
(c)
(d)
(e)
(f)
(g)
(h)
Fig. 2. Examples of different steps of pre-processing used on an input signature: (a) An original grey image, (b) The image after binarization, (c) The image after cropping, (d) Non-overlapping windows of size b × b (here 4×4), e) A block of size 4×4 from (d), f) Obtaining an under-sampled pixel by summing all the pixel values in (e), g) Computing the pixel intensity of the under-sampled pixel using the formula (12/16×255=191.25), and (h) The under-sampled grey image of size M/b × N/b.
In the basic LBP feature extraction method, an image is processed in such a way that a binary code is generated for each pixel in the image. This code determines whether the intensities of the neighbouring pixels are greater or less than the reference pixel’s intensity. For instance, in a 3×3 neighbourhood with the reference pixel being the centre, a binary code of length 8 is generated according to the relative intensities of its neighbours. A histogram of 256 bins is then computed to count the number of occurrences of each binary code, describing the proportion of common textural patterns in the image [47]. By computing the occurrence histogram, structural and statistical information is effectively combined. The LBP map detects microstructures, such as edges, lines, spots and flat areas, whereas their underlying distribution is estimated by the LBP histogram [47]. The basic LBP-based feature extraction technique has further been extended to a generalised rotation invariant feature extraction method in u2 [48]. The generalised LBP feature extraction (LBPP,R ) and riu2 rotation invariant (LBPP,R ) methods have been derived based on a symmetric 𝑃 members neighbourhood on a circle of radius 𝑅. The parameter 𝑃 controls the quantisation of the angular space and 𝑅 determines the spatial resolution of the operator. Interested readers can find more about the LBPbased feature extraction method in [47, 48]. riu2 Similar to the authors in [27], the LBPP,R with only two variations (𝑅 = 1, 𝑃 = 8 and 𝑅 = 2, 𝑃 = 16) is initially employed on the pre-processed original image to extract signature features. Furthermore, an effective feature extraction technique based on under-sampled bitmaps and LBP-based features is proposed in this paper. To do so, first, an under-sampled
> bitmap image is created and then LBP-based features are extracted from the under-sampled bitmap image. The main reason for the use of the under-sampled image in the proposed feature extraction method is to compute the LBP-based features from the grey level low-resolution version of the input signature image. The significance of LBP-based texture features obtained from the grey images compared to the binary images has been pointed out in [27]. As most of the LBP patterns in an image are generally uniform patterns, and u2 also the uniform LBP (LBPP,R ) operator can keep the u2 distribution of the LBPs in the image, the LBPP,R with 𝑅 = 1 and 𝑃 = 8 is applied on the resultant under-sampled grey image to obtain a set of 59 LBP-based texture features u2 called UB − LBPP,R . The LBP-based features extracted based u2 riu2 riu2 on the UB-LBP8,1 , LBP8,1 and LBP16,2 from the undersampled and original signature images are concatenated to create a set of 87 (59+10+18) features. It is worth mentioning that both grey-level information as well as binary information are captured in the proposed feature set, ensuring a better interpretation of the signature images.
C. Creation of an interval-valued symbolic model Patterns/objects are commonly characterized using a set of single real-value data parameters called the feature vector/set. The feature vectors extracted for different objects constitute a data-array, where each cell (𝑖, 𝑗) comprises the value of the feature 𝑗 for the object 𝑖. Apart from its simple representation, this kind of modelling cannot take into account the variability and/or uncertainty of the feature values. In the signature verification domain, different fuzzification methods have been employed to take care of the uncertainty in handwritten signatures [43-46]. From a different perspective, interval- and histogram-valued symbolic variables have also been introduced in the domain of symbolic data analysis to represent the variability, uncertainty and distribution of feature values in a specific class object [16]. An intervalvariable can be defined using minimum and maximum values of a set of values as the lower or upper bound of the values, respectively. For instance, a set of continuous values 𝑋 can be defined using finite support [𝑥, 𝑥], where 𝑥 and 𝑥 are the minimum and maximum values of 𝑋, respectively. In this research work, the interval-valued symbolic data is considered to model each feature of every individual’s signature extracted during the training phase. To create the interval-valued symbolic data, the minimum and maximum values of the features can be used. However, if the training samples are very similar in shape, the minimum and maximum values of the feature values will be very close to each other and cannot represent an appropriate interval-value of a set of feature values. Therefore the median and standard deviation of each feature, as two main statistics of features along with a tuning parameter, are used to define intervalvalued symbolic data for each feature. As a result, an individual’s signature is represented by a range of intervalvalued data. For easy reading and formulation of the problem, specific mathematical descriptions are further provided in the
following. Let Sj = {sj1 , sj2 , … , sjl } be a set of l samples from a i i i signature class Cj and let Fji = {fj1 , fj2 , … , fjn } be a feature i vector of size n extracted from the set sj . For the 𝑘 𝑡ℎ ° feature fjk in every class Cj , we compute the statistical median mjk and standard deviation σjk . The statistical standard deviation σjk is computed based on the median mjk . Considering mjk and σjk , the lower and upper bound values of ° the fjk are computed as follows: 𝑚𝑗𝑘 = 𝑀𝑒𝑑𝑖𝑎𝑛( 𝑓𝑗𝑘° )
(1)
𝜎𝑗𝑘 = 𝑆𝑡𝑎𝑛𝑑𝑎𝑟𝑑𝐷𝑒𝑣𝑖𝑎𝑡𝑖𝑜𝑛( 𝑓𝑗𝑘° ) 𝑓𝑗𝑘− = 𝑚𝑗𝑘 − 𝜆 × 𝜎𝑗𝑘 𝑓𝑗𝑘+ = 𝑚𝑗𝑘 + 𝜆 × 𝜎𝑗𝑘 where λ is a parameter which should be tuned during the training phase. A symbolic representation of the 𝑘 𝑡ℎ feature of class 𝑗 (Cj ) is further defined using an interval-value and 2 continuous values (median and standard deviation). 𝑠𝑓𝑗𝑘 = ([𝑓𝑗𝑘− , 𝑓𝑗𝑘+ ], 𝑚𝑗𝑘 , 𝜎𝑗𝑘 )
(2)
The symbolic representation of Cj called 𝑆𝑦𝑚𝑏𝐶𝑗 is finally defined considering 𝑛 symbolic features (sf) corresponding to 𝑛 features as follows: 𝑆𝑦𝑚𝑏𝐶𝑗 = {𝑠𝑓𝑗1 , 𝑠𝑓𝑗2 , … , 𝑠𝑓𝑗𝑛 }
(3)
Considering 𝑞 classes in a particular signature verification problem, the complete interval symbolic representation of the problem contains 𝑞 signature models composed of 𝑛 interval values. A complete overview of the symbolic models is shown in Table II. TABLE II INTERVAL-SYMBOLIC REPRESENTATION OF A q-CLASS PROBLEM WITH N FEATURES BASED ON THE PROPOSED APPROACH. Feature … 𝑠𝑓𝑗1 𝑠𝑓𝑗𝑛 Class
SymbC1 SymbC2 ⁞
SymbCj ⁞
SymbCq
− + ([𝑓11 , 𝑓11 ], 𝑚11 , 𝜎11 ) − + ([𝑓21 , 𝑓21 ], 𝑚21 , 𝜎21 ) ⁞ ([𝑓𝑗1− , 𝑓𝑗1+ ], 𝑚𝑗1 , 𝜎𝑗1 ) ⁞ − + ([𝑓𝑞1 , 𝑓𝑞1 ], 𝑚𝑞1 , 𝜎𝑞1 )
… … ⁞ … ⁞ …
− + ([𝑓1𝑛 , 𝑓1𝑛 ], 𝑚1𝑛 , 𝜎1𝑛 ) − + ([𝑓2𝑛 , 𝑓2𝑛 ], 𝑚2𝑛 , 𝜎2𝑛 ) ⁞ − + ([𝑓𝑗𝑛 , 𝑓𝑗𝑛 ], 𝑚𝑗𝑛 , 𝜎𝑗𝑛 ) ⁞ − , 𝑓 + ], 𝑚 , 𝜎 ) ([𝑓𝑞𝑛 𝑞𝑛 𝑞𝑛 𝑞𝑛
D. Computing similarity values and the verification process Euclidean, City-block and Mahalanobis distances are some simple, but well-established, distance measures frequently used in the literature for computing similarity/dissimilarity between two feature vectors. These distances cannot be used in our proposed model, since our proposed representation model for each signature class is composed of interval-values and each feature extracted from a test signature is a single numerical real value.
>
Frequency
Feature value
(a) Frequency
Feature value (b) Frequency
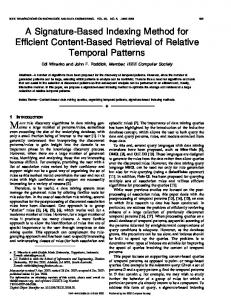
Feature value (c) Fig. 3. Examples of different patterns: (a) A bell shape distribution, (b) A half-bell shape distribution, and (c) An approximate bell shape distribution obtained from the values extracted for three different features using genuine signatures considered for training.
Fig. 4. The proposed interval-valued symbolic representation and a similarity measure obtained for F11 based on a fuzzy trapezium-shaped membership function.
Based on a statistical analysis performed on the feature values extracted from the training data for every individual feature, we found three common types of patterns, such as bell shape, half-bell shape and approximate bell shape, as three distributions of feature values repeated in all the features. These three patterns could easily be modelled using different Gaussian distribution models with different means and standard deviations, as shown in Fig. 3. However, the main problem with the mean value is its significant change in the presence of a value, which is highly deviated from other values. This problem results in an erroneous Gaussian model. Furthermore, a Gaussian model generally provides a probability of very close to zero for the sample, which deviates much from the mean in the Gaussian model [43-44]. This provides inaccurate results in the case where a genuine signature has much variation with respect to the other original genuine signatures. To this end, a fuzzy similarity function is further proposed in this research work to take care of those two issues with a standard Gaussian model. The proposed fuzzy similarity measure is a fuzzy trapezium-shaped membership function, which is relatively similar to the Gaussian distribution as are our feature value distributions. It can further take care of both the mean value and also the low probability of the features, which are far from the mean, by considering the median value and properties of the fuzzy trapezium-shaped membership function. It can also take into account the inter-class variability problem between skilled forgeries and genuine signatures providing small similarity (membership) values for the forged signature features in comparison to the genuine signature features. A pictorial representation of the intervalvalued symbolic 𝑠𝑓11 , and the similarity measure in relation to 𝐹11 obtained based on a fuzzy trapezium-shaped membership function, is shown in Fig. 4. The 𝑠𝑓21 shown in Fig. 4 is computed in the same way as the first feature values extracted from 𝑙 signature samples of the class 𝐶2. There are many aggregation operators, such as t-norms, tconorm and averaging operators, proposed in the literature to compute the final fuzzy value for a set of fuzzy values [56]. In this research work, a simple Algebraic Sum from a t-conorm aggregation group is used for the aggregation process. The main reason for choosing the Algebraic Sum aggregation is to
> equally consider the effect of all fuzzy similarity values computed for all the features in the final fuzzy similarity measure. As a result, the similarity 𝑆𝑖𝑚 (𝐹𝑇 , 𝑆𝑦𝑚𝑏𝐶𝑗 ) between a test sample (𝑇) and a symbolic reference of a particular class 𝑗 (𝑆𝑦𝑚𝑏𝐶𝑗 ) is computed as follows: 1
𝑆𝑖𝑚(𝐹𝑇 , 𝑆𝑦𝑚𝑏𝐶𝑗 ) = ∑𝑛𝑘=1 𝜌𝑗𝑘 𝑛
(4)
where 𝜌𝑗𝑘 is a fuzzy trapezium-shaped membership function providing similarity values between every feature value of a test sample feature vector, whereby a signature model (𝑆𝑦𝑚𝑏𝐶𝑗 ) and 𝑆𝑖𝑚(𝐹𝑇 , 𝑆𝑦𝑚𝑏𝐶𝑗 ) is the accumulated similarity value obtained for all the feature values. The proposed fuzzy trapezium-shaped membership function is defined as follows. The ±sigma around the median value provides a support (kernel) of the membership function.
𝜌𝑗𝑘 =
0
𝑖𝑓 𝑓𝑗𝑘− > 𝐹𝑇𝑘 𝑜𝑟 𝐹𝑇𝑘 > 𝑓𝑗𝑘+
1
𝑖𝑓 𝑚𝑗𝑘 – 𝜎𝑗𝑘 ≤ 𝐹𝑇𝑘 ≤ 𝑚𝑗𝑘 + 𝜎𝑗𝑘
– (𝐹𝑇𝑘 − 𝑓𝑗𝑘– )/[(𝑚𝑗𝑘 – 𝜎𝑗𝑘 ) − 𝑓jk ]
– 𝑖𝑓 𝑓jk ≤ 𝐹𝑇𝑘 < 𝑚𝑗𝑘 – 𝜎𝑗𝑘
(5)
+ + + { (𝑓j𝑘 − 𝐹𝑇𝑘 )/[𝑓jk − (𝑚𝑗𝑘 + 𝜎𝑗𝑘 )] 𝑖𝑓 𝑚𝑗𝑘 + 𝜎𝑗𝑘 < 𝐹𝑇𝑘 ≤ 𝑓jk
In our proposed signature verification method, an adaptive writer-dependent acceptance threshold is defined to decide whether a test signature is genuine or a forgery. Based on the similarity value (𝑆𝑖𝑚 (𝐹𝑇𝑟 , 𝑆𝑦𝑚𝑏𝐶𝑗 )) computed from the training samples, the acceptance threshold (𝜃𝑗 ) is defined as the confidence value for the class 𝐶𝑗 as follows: 𝜃𝑗 = 𝑀𝑒𝑎𝑛(𝑆𝑖𝑚(𝐹𝑇𝑟 , 𝑆𝑦𝑚𝑏𝐶𝑗 ) + 𝛼 × 𝑆𝑡𝑎𝑛𝑑𝑎𝑟𝑑𝐷𝑒𝑣𝑖𝑎𝑡𝑖𝑜𝑛(𝑆𝑖𝑚(𝐹𝑇𝑟 , 𝑆𝑦𝑚𝑏𝐶𝑗 ))
signatures were collected from 260 different individuals with different educational backgrounds and ages. Individuals used different pens and surfaces for noting down their signatures. Each set consists of 24 genuine signatures and 30 skilled forgeries. Signatures were collected during 2 different sessions. In the first session, the genuine signatures were collected, whereas in the second session, the skilled forgery signatures were collected, showing a genuine signature to an individual to train and mimic the forgeries. A total number of (260 × 24) 6240 genuine and (260 × 30) 7800 skilled forgery signatures were collected from all 260 individuals. The data collected was acquired using a flatbed scanner with the resolution of 300DPI in grey scale and stored in TIFF format. A histogram-based thresholding technique was applied for binarization to convert digitized grey-level images to two-tone images. The skilled forgery signatures collected are quite similar to the genuine signatures that make the dataset quite a challenging one [53]. To have an idea about the type of signatures and the complexity of the forged signatures, some binary genuine signature samples of the GPDS-300 and BHSig260 datasets, with their corresponding forgeries, are displayed in Table III. TABLE III SAMPLES OF GENUINE AND FORGED SIGNATURE OF THREE DIFFERENT INDIVIDUALS FROM DIFFERENT DATASETS USED IN THIS RESEARCH WORK. Some samples of the GPDS-300 dataset Genuine Signatures
Forged Signatures
(6)
where 𝑇𝑟 varies from 1 to 𝑙 training samples from the class 𝐶𝑗 and 𝛼 is a parameter, which is tuned during the training step in order to obtain the optimal results. V. DATABASE, METRICS AND EXPERIMENTAL SETTINGS
A. Database Details and Evaluation Metrics To evaluate the proposed verification model we initially used a benchmark off-line signature dataset called the GPDS300 [52, 51] dataset. We also used a large dataset [53] of Bangla and Hindi off-line signatures (BHSig260) for experimentation. The GPDS-140 was used for tuning the parameters of the proposed signature verification system and GPDS-160 and BHSig260 were considered for testing purposes. The GPDS-300 signature dataset is composed of 16200 offline signature images [52]. Three hundred individuals participated to create the dataset. Each signer provided 24 genuine samples in a single day at different writing sessions. For each genuine signature, 30 skilled forged signatures were obtained from 10 different forgers. Forgers could practice as long as they wish to provide the forged signatures. The signatures were binary images and were saved in "bmp" format with a resolution of 300DPI [52]. The BHSig260 dataset [53] consists of 260 sets of handwritten off-line signatures of which 100 sets were written in Bangla and the rest (160 sets) were written in Hindi. The handwritten off-line
Hindi Signatures from the BHSig260 dataset Genuine Signatures
Forged Signatures
Bangla Signatures from the BHSig260 dataset Genuine Signatures
Forged Signatures
In the literature detailing signature verification methods, two classical types of error have frequently been computed as metrics for evaluation. These are: Type I error or False Rejection Rate (FRR) or False Non-Match Rate (FNMR),
> which means a genuine signature is rejected by the system, and a Type II error or False Acceptance Rate (FAR) or False Match Rate (FMR), which means a forgery is accepted as a genuine signature by the system. As the majority of papers in the literature used the terms FAR and FRR for evaluation purposes, these terms are used in this paper as well. The mathematical definition of the FAR and FRR are further provided using the confusion matrix presented in Table IV. TABLE IV CONFUSION MATRIX USED TO DEFINE THE EVALUATION METRICS.
True label
Predicted label G
F
G
GG
FG
F
GF
FF
𝐹𝑅𝑅 = 𝐹𝐴𝑅 = 𝐴𝐸𝑅 =
𝐹𝐺 𝐺𝐺+𝐹𝐺 𝐺𝐹 𝐹𝐹+𝐺𝐹 𝐹𝐴𝑅+𝐹𝑅𝑅 2
(7) (8) (9)
In Table IV, 𝐹 and 𝐺 represent forged and genuine signatures, respectively. 𝐺𝐺 is the number of genuine signatures which have been predicted as genuine. 𝐹𝐺 is the number of genuine signatures which have been predicted as forgeries. 𝐺𝐹 is the number of forged signatures, which have been predicted as genuine and 𝐹𝐹 is the number of forged signatures that have been predicted as forgeries. The Equal Error Rate (𝐸𝐸𝑅) and the Average Error Rate (𝐴𝐸𝑅) have also been used for the evaluation of the signature verification systems. The 𝐸𝐸𝑅 indicates where the 𝐹𝑅𝑅 and 𝐹𝐴𝑅 are equal and 𝐴𝐸𝑅 is the average of 𝐹𝐴𝑅 and 𝐹𝑅𝑅. It may be noted that the 𝐹𝐴𝑅, 𝐹𝑅𝑅, 𝐴𝐸𝑅 and 𝐸𝐸𝑅 metrics were computed knowing that the classes are imbalanced.
B. Experimental Settings In the proposed symbolic representation model in this research work, there are three main parameters, which should be set during the tuning/development stage. To do so, the last 140 classes of the GPDS-300 dataset were considered for tuning the parameters of the proposed model. Only a number of (e.g. 12, 10,…) genuine signatures from the training dataset were used for training the proposed model in the tuning/development step. The rest of the genuine signatures and all the forgeries from the training dataset, were used to tune the parameters of the proposed model and to obtain the optimal acceptance/rejection threshold. In this way, writers have their own symbolic model. However, the parameters are the same for all writers. In Table V a brief description of the dataset and the number of genuine signatures (𝑁𝑔 ) and forgeries (𝑁𝑓 ) used for each experiment is provided. For tuning the parameters, initially, 12 genuine signatures of each individual from the training dataset were considered in order to train and build the proposed symbolic representation model. The remaining 12 genuine signatures and all the skilled forgeries (30) of each individual from the
training dataset were further used for tuning the parameters. The samples for training and tuning were chosen randomly. The parameters in our proposed models that should be tuned are: λ, which is used to compute the lower and upper bounds of feature values, the size of the block (𝑏 × 𝑏) for the undersampling process in our proposed feature extraction method, and the parameter α in the acceptance/rejection threshold (𝜃𝑗 ). We considered different values (2, 3, and 4) for b to analyse the effect of under-sampling in the final signature verification results. To analyse the significance of the parameter λ in the final verification results, λ was set to 2, 4 and 6. When changing each of the parameters λ and b, the other one remains constant. In the tuning process, the parameter α was tuned in such a way that the FAR and FRR became equal as a trade-off between false acceptance rate and false rejection rate to obtain an EER. To obtain reliable and consistent results, the training and tuning procedures were repeated 10 times with different training and tuning subsets of signatures from the GPDS-140 dataset. The results obtained using different values of b and λ, when the average EER value was computed from 10 iterations, are presented in Table VI. From Table VI, it is evident that the results presented in each row are consistent with respect to the changes of parameter λ when the parameter b is the same. However, the best result was obtained when λ was set to 4. Therefore, we fixed the λ to 4 in the rest of our experiments. The proposed method is not very sensitive to parameter λ and can provide stable results with different values of λ, whereas the proposed system is sensitive to the values of b. The best result was obtained when the block size was 2×2. Hence, we set the value of b to 2. The value of α was set to 3.74 based on the average value of α values obtained during 10 repetitions of our experiments. To get an idea about the effect of the parameter α on the signature verification results, the results obtained using different values of α are plotted in Fig. 5, in the form of a Receiver Operating Characteristic (ROC) curve. The results are further plotted in Fig. 6 to demonstrate the relationship between FAR and FRR metrics. Considering the results, we can see that the value of α was adapted depending on the number of training samples especially to compensate when there is a lack of training data to build a correct support for fuzzy features, integrating well-estimated intra-class variability. Keeping the same values for the parameters b (=2) and λ (=4), we applied the same process considering a different number of (e.g. 10, 8, 6, 5, 4) genuine signatures of each individual from the GPDS-140 dataset for training the proposed model. Consequently, different values of the parameter α were obtained when 14, 16, 18, 19 and 20 genuine signatures and 30 forged signatures were considered to achieve the EER results. A graphical representation of the average EER results computed from 10 iterations and their respective parameter α with a different number of signatures for training and tuning are shown in Fig. 7. From Fig. 7, we observed that the value of α has a direct relation to the number of training samples (𝑁𝑔 ).
> TABLE V DIFFERENT NUMBER OF SAMPLES USED FOR TUNING AND TESTING IN OUR EVALUATION PROTOCOL Training (Samples per class) Dataset GPDS-140 GPDS-160 BHSig260
Ng 12, 10, 8, 6, 5, 4 -
Nf 0 -
Tuning the parameters (Samples per class)
Training (Samples per class)
Ng Nf 12, 14, 16, 18, 19, 20 30 -
Ng 12, 10, 8, 6, 5, 4 12, 10, 8, 6, 5, 4
TABLE VI RESULTS OBTAINED WITH DIFFERENT BLOCK SIZES AND VARIOUS VALUES OF 𝜆 WHEN THE PROPOSED METHOD WAS TRAINED USING 12 SAMPLES OF THE GPDS-140 DATASET.
2×2 3×3 4×4
2 16.76 17.47 18.88
EER (%) 4 16.67 17.75 18.97
6 16.84 17.78 19.11
Ng 12, 14, 16, 18, 19, 20 12, 14, 16, 18, 19, 20
Nf 30 30 70
FRR FAR
60
VI. EXPERIMENTAL RESULTS AND DISCUSSION
60
50
50
40
40
30
30
20
20
10
10
0
0 0
2
4
α
6
8
10
Fig. 5. FAR and FRR curves for different values of the parameter α.
FRR (%)
To evaluate the proposed signature verification method, several experiments were carried out using different numbers of samples from the GPDS-160, and BHSig260 datasets for testing. The results considering different numbers of training and testing samples are shown in Table VII. Since we have repeated the training and testing/evaluation experiments with different randomly chosen samples, the average of FAR, FRR, and AER were computed as the metrics of evaluation. The standard deviation (σ) of the AER results was also provided to demonstrate how the results are stable throughout our experiments with different training and testing samples. From Table VII, it is clear that the standard deviations of the AERs, which were obtained employing the proposed method on two datasets, also indicate that the results were quite stable throughout different experiments. In relation to the number of signatures considered for training the proposed model, we noted that the AER gradually increases when the number of signatures for training decreases. However, the results suddenly drop when the number of training samples is less than 6 (inclusive). This is because, both the interval-valued symbolic model and the fuzzy similarity measure are based on the statistical median and standard deviation of feature values extracted from the training samples. Sample signatures are not uniformly distributed in GPDS. Therefore, the median and standard deviation computed based on a small number of samples (here less than 5) may not perfectly represent the median and standard deviation of the rest of the data. As a result, our model may not provide high accuracy results when very few samples (< 5) are considered for training. Furthermore, the results obtained from the BHSig260 are poorer compared to the results achieved from the GPDS dataset. The main reason for this low performance is the complexity of the forgeries collected in the BHSig260, as the majority of the signatures in the BHSig260 dataset are in textual form, the forged signatures obtained from the forgers are substantially similar to those of genuine signatures collected from the genuine signature writers.
Nf 0 0 EER
70
Error (%)
b×b
Result 𝜆
Testing (Samples per class)
70 60 50 40 30 20 10 0 0
10
20
30
40
50
60
70 FAR (%)
Fig. 6. The ROC curve drawn based on the results obtained from the proposed model using 12 genuine samples for training. 30
27.70
Alpha 24.24 AER
25
22.00 19.63
20
16.67
17.70 12.84
15 8.22
10 5
3.74
4.08
5.09
Ng=12
Ng=10
Ng=8
9.37
0 Ng=6
Ng=5
Ng=4
Fig. 7. The EERs and the respective values of α obtained from the proposed model using different genuine samples (Ng) from the GPDS-140 for training.
VII. COMPARATIVE ANALYSIS To provide a comparative analysis of the results obtained by our proposed method with the results of the state-of-the-art methods, some recent methods evaluated on the GPDS dataset were considered for experimentation. A fair comparison with other methods was difficult due to the use of different
> numbers of signatures from each writer and also various signature types used in the tuning/designing and evaluation steps for signature verification in different systems. Considering the GPDS dataset for experiments, a comparison of the results obtained from the proposed model and some of the methods in the literature is shown in Table VIII. TABLE VII RESULTS OBTAINED FROM THE PROPOSED SYMBOLIC REPRESENTATION MODEL CONSIDERING DIFFERENT DATASETS FOR VALIDATION Training Testing FAR FRR AER AER Dataset (%) (%) (%) (σ) Ng Nf Ng Nf 1.06 4 20 20.61 21.84 21.22 0.90 5 19 17.31 17.22 17.61 0.94 6 18 16.51 16.53 16.18 GPDS-160 0 30 10.64 17.43 13.85 8 16 1.69 10 14 9.50 14.49 12.38 1.80 7.90 14.76 11.74 1.99 12 12 0.95 4 20 32.02 25.73 28.88 0.76 5 19 26.36 25.85 26.13 0.66 6 18 24.24 25.31 24.78 BHSig260 0 30 0.47 8 16 19.26 28.23 23.74 17.69 28.61 23.08 10 14 0.34 16.18 30.12 23.15 12 12 0.40 TABLE VIII AER (%) OBTAINED BY THE PROPOSED MODEL COMPARED TO OTHER SYSTEMS USING THE GPDS-160 DATASET
Method [5] [7] [8] [39] [38] [41] [51] Proposed method
Feature
Ng=4 for training
AER (%) Ng=8 for training
Directional features Trained with Ng =24 & Nf = 24 Surroundedness Trained with Ng =12 & Nf = 12 Local descriptors Boosting feature Curvelet transform 16.92 15.95 Grid segmentation 20.53 17.24 Geometric features 14.15 16.10 LBP-based features 21.22 13.85
Ng=12 for training 17.25 13.76 15.30 15.24 15.07 16.84 13.35 11.74
TABLE IX RESULTS OBTAINED FROM THE PROPOSED MODEL EMPLOYING DIFFERENT NOISES ON THE GPDS-160 Noise type
Salt & Pepper
Gaussian White noise
Noise parameters d = 0.001 d = 0.01 d = 0.1 d = 0.2 m = 0, v = 0.01 m = 0, v = 0.1 m = 0.3, v = 0.01 m = 0.3, v = 0.1
AER (FAR, FRR) (%) Ng=12 for training 11.74 (0, 23.49) 11.95 (0, 23.91) 12.18 (0, 24.37) 12.21 (0, 24.43) 11.88 (0.08, 23.69) 12.16 (0.0, 24.32) 12.39 (0.0, 24.79) 12.29 (0, 24.58)
The authors in the study [7] used genuine and forged signatures for training the classifier, whilst the methods presented in [38], [41] and [51] used only genuine signatures for training. The results presented in Table VIII show that our proposed method outperforms the state-of-the art methods considered for comparison when 8 or more signatures were used for training. The results demonstrate that a significant improvement was achieved employing our proposed method
on the GPDS-160 dataset. From the existing literature we noted that the method presented in [51] reported minimum AER was 14.15% (13.35%) considering 8 (12) genuine signatures from each individual for training. Whereas our proposed method shows 13.85% (11.74%) AER when 8 (12) genuine signatures were considered for training. Thus, our method provides 1.61% lower AER than the existing work when 12 genuine signatures were used for training. However, from Table VIII we can see that the result obtained based on the method presented in [51] showed better performance when 4 genuine signatures from each individual were used for training. The main reason for the lower performance of our proposed model when trained with a small number of signatures is the use of the statistical measures (mean and standard deviation) in both the symbolic representation process and the fuzzy similarity measure of the proposed model that do not actually reflect the distribution of entire signature samples. Hence, it provided lower performance. We further noted that for the methods presented in [5, 38, 41], at first, an appropriate kernel needs to be determined and then their parameters should be tuned. Also, these methods have high algorithmic complexity and extensive memory requirements in large-scale tasks. Furthermore, the methods proposed in [7, 38, 41] show poor performance when few signature samples are available for training, and they need reconstruction whenever a new writer is added to the system. The method presented in [8] is very sensitive to irrelevant features as all features equally contribute to the similarity measure and thus to the classification. However, the proposed method does not require to be re-trained when a new class is added to the system. The proposed method is also inexpensive in terms of memory usage and computing time. Moreover, the interval based symbolic model and fuzzy similarity measure proposed in this work can take care of irrelevant features, as every feature does not contribute to the proposed fuzzy similarity measure equally. To get an idea of the performance of the proposed system on degraded and noisy data, two different types of noise, such as Salt & Pepper, and Gaussian White noise with various noise level were employed on the GPDS-160 dataset to generate noisy signature images. These two types of noise commonly appear in images during the data collection process. Salt & Pepper noise adds black and white noise to the image, where d is a parameter that indicates noise density, Gaussian White noise adds Gaussian noise of mean m and variance v to the image. The results obtained by the proposed signature verification system using noisy data are shown in Table IX when 12 signatures were used for training. From the results presented in Table IX it is clear that the results have slowly decreased when signature images were severely affected by the noise. However, from Tables VIII and XI it can be seen that the results of our method on such noisy data are still better than the results of the state-of-the-art methods when applied on non-noisy data of GPDS-160. This is because the proposed signature verification system can take care the issues of feature variation by using the interval-value
> representation model and the fuzzy similarity membership function. To compare the signature verification methods in the literature in relation to their time complexities, a theoretical time complexity analysis is further provided in Table X. As shown in Table X, we compared the time complexity of learning algorithms as most of the methods have used a feature extraction technique of linear complexity. The time complexity of the HMM-based algorithms [41, 51] is of O(k 2 𝑁), where 𝑁 is the length of sequences and k is the number of symbols in the state alphabet of the HMM. The time complexity of the NN-based approach [4, 7] to converge to an optimal solution is of O(2𝑁 ), where N is the dimension of the feature vector. In the case of the SVM-based methods [7, 38, 51], the time complexity is of O(N 3 ). For the GMMbased approach [6] the time complexity is O(DKN 3 ), where 𝐷 represents the data points, 𝐾 is the number of Gaussian components and 𝑁 is the dimension of the feature vector. However, the complexity of the proposed symbolic representation model in this work is of 𝑂(𝑁), as all the operations (mean, standard deviation, comparison) used here have a linear complexity. As a result, the proposed signature verification method is computationally less expansive compared to all the existing approaches. TABLE X COMPUTATIONAL COMPLEXITY COMPARISON Method HMM-based algorithms [41] NN-based approach [7] SVM-based methods [38] GMM-based approach [6] Proposed method
Time Complexity O(k2 𝑁) O(2𝑁 ) O(N3 ) O(DKN3 ) 𝑂(𝑁)
VIII. CONCLUSIONS AND FUTURE WORK In this investigation, the performance of the proposed writer-dependent interval-based symbolic representation model for off-line signature verification is demonstrated, whereby a wide range of experiments was conducted on different datasets. A symbolic representation is used to model the feature vectors, constructing a set of interval values suitable for characterization of intra-class variability of features extracted from different signature samples of an individual. A fuzzy similarity measure applicable to an interval-value symbolic model is proposed to address the inter-class variability of features. A new texture feature based on a low-resolution image obtained employing the undersampling technique is further introduced. The proposed method provided significantly improved results compared to the state-of-the-art methods considering two different off-line signature datasets. The main advantage of the proposed model is that it allows the design and integration of a model for a new individual using only genuine signatures with the same parameters as before, without any need of re-tuning all the parameters. However, in the case of training with very few samples, the proposed method is not as efficient as when the training is performed with 6 or more signatures. In future, because of the difficulty of acquiring enough genuine samples, we plan to extend this research work by
constructing a representative model, which is composed of different models for feature encoding, using only a very small number of genuine signature samples of each signer for training. REFERENCES [1] D. Impedovo, G. Pirlo, “Automatic Signature Verification: The State of the Art”, IEEE Transactions on Systems, Man, and Cybernetics—Part C: Applications and Reviews, 38(5), pp. 609-635, 2008. [2] M. I. Malik, S. Ahmed, A. Marcelliy, U. Pal, M. Blumenstein, L. Alewijnse, M. Liwicki, “ICDAR 2015 Competitions on Signature Verification and Writer Identification for On- and Off-line Skilled Forgeries (SigWiComp 2015)”, In Proc. of the ICDAR, pp. 1186-1190, 2015. [3] M. Kalera, S. Srihari, A. Xu, “Offline signature verification and identification using distance statistics”, International Journal of Pattern Recognition and Artificial Intelligence, pp.1339-1360, 2004. [4] I. Pottier, G. Burel, “Identification and Authentication of Handwritten Signatures with a Connectionist Approach”, In Proc. of the IEEE Conference on Neural Networks, pp. 2948-2951, 1994. [5] V. Nguyen, Y. Kawazoe, T. Wakabayashi, U. Pal, M. Blumenstein, “Performance analysis of the gradient feature and the modified direction feature for off-line signature verification”, in: International Conference on Frontiers in Handwriting Recognition, 2010, pp. 303–307. [6] M. I. Malik, M. Liwicki, A. Dengel, “Evaluation of local and global features for offline signature verification”, In Proc. of the Intl. Workshop on Automated Forensic Handwriting Analysis, pp. 26–30, 2011. [7] R. Kumar, J. D. Sharma, B. Chanda, “Writer-independent off-line signature verification using surroundedness feature”, Pattern Recognition Letters 33, pp. 301–308, 2012. [8] J. Ruiz-Del-Solar, C. Devia, P. Loncomilla and F. Concha, “Offline signature verification using local interest points and descriptors”, In Proc. of the 13th Iberoamerican congress on Pattern Recognition: Progress in Pattern Recognition, Image Analysis and Applications, pp. 22–29, 2008. [9] M. I. Malik, M. Liwicki, L. Alewijnse, W. Ohyama, M. Blumenstein, B. Found, “ICDAR 2013 Competitions on Signature Verification and Writer Identification for On- and Offline Skilled Forgeries (SigWiComp 2013)”, In Proc. of the ICDAR, pp. 1477-1483, 2013. [10] B. Xu, D. Lin, L. Wang, H. Chao, W. Li and Q. Liao, “Performance comparison of local directional pattern to local binary pattern in off-line signature verification system”, International Congress on Image and Signal Processing, pp. 308-312, 2014. [11] S. Pal, U. Pal, M. Blumenstein, “A two-stage approach for English and Hindi off-line signature verification”, In Proc. of the International workshop on Emerging Aspects in Handwritten Signature Processing, pp. 140-148, 2013. [12] S. Pal, A. Alaei, U. Pal, M. Blumenstein, “Off-line Signature Verification based on Background and Foreground information”, In Proc. of the International Conference on Digital Image Computing: Techniques and Applications, pp. 672-677, 2011. [13] S. Pal, A. Alaei, U. Pal, M. Blumenstein, “Multi-Script Off-line Signature Identification”, In Proc. of the International Conference on Hybrid Intelligent Systems, pp. 236-240, 2012. [14] S. Pal, V. Nguyen, M. Blumenstein, U. Pal, “Off-line Bangla Signature Verification”, In Proc. of the International Workshop on Document Analysis Systems, pp. 282-286, 2012. [15] S. Marcel, Y. Rodriguez, G. Heusch, “On the recent use of local binary patterns for face authentication”, International Journal on Image and Video Processing, Special Issue on Facial Image Processing, IDIAP-RR 06-34, 2007. [16] L. Billard, E. Diday, “Symbolic Data Analysis: Definitions and Examples”, Technical Report, 2003, available at http://www.stat.uga.edu/faculty/LYNNE/Lynne.html. [17] H. N. Prakash, D. S. Guru, “Offline signature verification: an approach based on score level fusion”, International Journal of Computer Applications, 1, pp.52–58, 2010. [18] F. Alaei, N. Girard, S. Barrat, J. Y. Ramel, “A New One-Class Classification Method Based on Symbolic Representation: Application to Document Classification”, In Proc. of the International Workshop on Document Analysis Systems, pp. 272-276, 2014.
> [19] S. Pal, A. Alaei, U. Pal, M. Blumenstein, “Interval-valued Symbolic Representation based Method for Off-line Signature Verification”, In Proc. of the IJCNN, 2015. [20] C. Hertel, H. Bunke, “A Set of Novel Features for Writer Identification”, pp. 679–687, 2003. [21] S. H. Cha, S. Srihari. “Writer identification: statistical analysis and dichotomizer”, Springer LNCS, 1876, pp. 123–132. 2000. [22] J. Starck, E. J. Candès, D. L. Donoho, “The Curvelet Transform for Image Denoising”, IEEE TIP, 11(6), pp. 670-684, 2002. [23] D. Impedovo, G. Pirlo, M. Russo, “Recent Advances in Offline Signature Identification”, In Proc. of the 14th International Conference on Frontiers in Handwriting Recognition, pp. 639-642, 2014. [24] L. G. Hafemann, R. Sabourin, L. S. Oliveira, “Offline Handwritten Signature Verification - Literature Review”, pp. 1-15, 2015. http://dblp.uni-trier.de/db/journals/corr/corr1507.html#HafemannSO15. [25] F. Leclerc and R. Plamondon, “Automatic signature verification: the state of the art-1989-1993”, Intl. Journal of Pattern Recognition and Artificial Intelligence, 8(3), pp. 643–660, 1994. [26] R. Plamondon and S. N Srihari, “Online and off-line handwriting recognition: a comprehensive survey”, IEEE Transactions on Pattern Analysis and Machine Intelligence, 22(1), pp. 63–84, 2000. [27] J. F. Vargas, M. A. Ferrer, C. M. Travieso, and J. B. Alonso, “Off-line signature verification based on grey level information using texture features”, Pattern Recognition, 44(2), pp. 375–385, 2011. [28] J. Hu and Y. Chen, “Offline signature verification using real adaboost classifier combination of pseudo-dynamic features”, in Proc. of the 12th ICDAR, pp. 1345-1349, 2013. [29] A. P. Shanker and A. N. Rajagopalan, “Off-line signature verification using DTW”, Pattern Recognition Letters, vol. 28, pp. 1407–1414, 2007. [30] E. J. R. Justino, A. El Yacoubi, F. Bortolozzi, and R. Sabourin, “An offline signature verification system using HMM and graphometric features”, in Proc. of the Fourth DAS, pp. 211–222, 2000. [31] M. A. Ferrer, F. Vargas, C. M. Travieso, and J. B. Alonso, “Signature verification using local directional pattern (LDP)”, in Proc. of the IEEE International Carnahan Conference on Security Technology (ICCST), pp. 336–340, 2010. [32] I. Guler, M. Meghdadi, “A different approach to off-line handwritten signature verification using the optimal dynamic time warping algorithm, Digital Signal Processing”, 18(6), (2008), pp. 940–950. [33] F. Alonso-Fernandez, M. C. Fairhurst, J. Fierrez, J. Ortega-Garcia, “Automatic measures for predicting performance in off-line signature”, in Proc. of the IEEE International Conference on Image Processing, ICIP, vol.1, 2007, pp. 369–372. [34] J. Wen, B. Fang, Y. Tang, T. Zhang, “Model-based signature verification with rotation invariant features”, Pattern Recognition, 42(7), (2009), pp. 1458–1466. [35] A. Gilperez, F. Alonso-Fernandez, S. Pecharroman, J. Fierrez, J.OrtegaGarcia, “Off-line signature verification using contour features”, in Proc. of the ICFHR, 2008. [36] J. Fierrez-Aguilar, N. Alonso-Hermira, G. Moreno-Marquez, J. OrtegaGarcia, “An off-line signature verification system based on fusion of local and global information, in: Workshop on Biometric Authentication”, Springer LNCS-3087, 2004, pp. 298–306. [37] M. B. Yılmaz, B. Yanıkoğlu, “Score level fusion of classifiers in offline signature verification”, Information Fusion, 32, (2016), pp. 109119. [38] Y. Guerbai, Y. Chibani, B. Hadjadji, “The effective use of the one-class SVM classifier for handwritten signature verification based on writerindependent parameters”, Pattern Recognition, 48(1), pp. 103-113, 2015. [39] G. Eskander, R. Sabourin, E. Granger, “Hybrid Writer-IndependentWriter-Dependent Offline Signature Verification System”, IET Biometrics, 2(4), pp. 169–181, 2013. [40] J.F. Vargas, C.M. Travieso, J.B. Alonso, M.A. Ferrer. “Off-line signature verification based on gray level information using wavelet transform and texture features”, In Proc. of the ICDAR, 587–92, 2010. [41] Batista, Luana, E. Granger, R. Sabourin, “Dynamic selection of generative–discriminative ensembles for off-line signature verification”, Pattern Recognition, 45(4), 1326–1340, 2012. [42] B. H. Shekar, R. K. Bharathi, J. Kittler, Y. Vizilter, L. Mestestskiy, “Grid structured morphological pattern spectrum for off-line signature verification”, in Proc. of the International Conference on Biometrics (ICB), pp. 430–435, 2015. [43] C. Simon, E. Levrat, J. Bremont, R. Sabourin, “A fuzzy perception for off-line handwritten signature verification”, BSDIA'97, pp. 261-272, 1997.
[44] V. K. Madasu, M. H. M. Yusof, M. Hanmandlu, K. Kubik, “Off-line signature verification and forgery detection system based on fuzzy modeling”, Advances in Artificial Intelligence volume: 2903, edited T. D. Gedeon, and L.C.C Fung, pp.1003-1013, 2003. [45] M. Hanmandlu, M. H. M. Yusof, V. K. Madasu, “Off-line signature verification and forgery detection using fuzzy modeling”, Pattern Recognition”, 38(3), pp. 341-356, 2005. [46] Y. W. Woo, S. Han, K. S. Jang, “Off-Line Signature Verification Based on Directional Gradient Spectrum and a Fuzzy Classifier”, in Proc. of the First Pacific Rim Symposium (PSIVT 2006), pp. 1018-1029, 2006. [47] T. Ojala, M. Pietikainen, D. Harwood, “Performance Evaluation of Texture Measures with Classification Based on Kullback Discrimination of Distributions”, in Proc. of the 12th ICPR, pp. 582-585, 1994. [48] T. Ojala, M. Pietikainen, T. Maenpaa, “Multiresolution Gray-Scale and Rotation Invariant Texture Classification with Local Binary Patterns”, IEEE Transactions on Pattern Analysis and Machine Intelligence, 24(7), pp. 971-987, 2002. [49] N. Herbst, C. Liu, “Automatic signature verification based on accelerometry”, Technical Report., IBM Journal of Research Development, 1977. [50] Garris, M. D. et al., “NIST Form-Based Handprint Recognition System”, NISTIR 5469, 1994. [51] M. Ferrer, J. Alonso, C. Travieso, “Offline geometric parameters for automatic signature verification using fixed-point arithmetic”, IEEE Transactions on Pattern Analysis and Machine Intelligence, 27(6), pp. 993–997, 2005. [52] F. Vargas, M. A. Ferrer, C. M. Travieso, J. B. Alonso, “Off-line handwritten signature GPDS-960 corpus”, in Proc. of the 9th ICDAR, pp. 764–768, 2007. [53] S. Pal, A. Alaei, U. Pal, M. Blumenstein, “Performance of an Off-line Signature Verification Method based on Texture Features on a Large Indic-script Signature Dataset”, in Proc. of the DAS, pp. 272-277, 2016. [54] M. A. Ferrer, J. F. Vargas, A. Morales, A. Ordonez, “Robustness of Offline Signature Verification Based on Gray Level Features”, IEEE Transactions on Information Forensics and Security, 7(3), pp. 966 – 977, 2012. [55] A. Hamadene, Y. Chibani, “One-Class Writer-Independent Offline Signature Verification Using Feature Dissimilarity Thresholding”, IEEE Transactions on Information Forensics and Security 11(6), pp. 1226 – 1238, 2016. [56] R. R. Yager, “Aggregation operators and fuzzy systems modeling”, Fuzzy Sets and Systems, 67(2), pp.129-145, Oct. 24, 1994.
Alireza Alaei obtained his Ph.D. in Computer Science from University of Mysore, India, in 2012. He has since worked as a Post-Doc research fellow at Laboratoire d'Informatique (LI), Université François Rabelais de Tours, France, from June 2012 to July 2015. His Postdoc research was fast detection and recognition of logos/trademarks in administrative document images as well as document image quality assessment. He has been a research fellow at the Griffith School of Information and Communication Technology, and latterly at the Griffith Institute for Tourism on several Big Data projects. His research focuses on data analysis, document image analysis & recognition, pattern recognition, and biometrics. He has published more than 40 research papers in high quality international journals and conference proceedings. He has further developed a strong collaboration with many national and international universities in Australia, India and France. He has served as a conference organizing chair, organizing committee member, and program committee member, reviewer in various international conferences workshops and journals.
> Srikanta Pal is currently working as a post doctoral research fellow in Computer Science, Image and Interaction Laboratory (L3i), Faculty of Science and Technology, University of La Rochelle, France. He obtained his PhD in Computer Science from the School of Information and Communication Technology (ICT), Griffith University, Australia. He received his MCA (Master in Computer Application) and M.Tech-IT (Master of Technology in Information Technology) degrees before obtaining his PhD. He has more than six years of research experience. He has served as a program committee member of some international conferences and workshops. He has over 35 research publications in several refereed conferences, workshops, journals and book chapter. His current research interests include Document Image Processing, Pattern Recognition, Signature Verification, and Handwriting Recognition. Umapada Pal received his Ph.D. in 1997 from Indian Statistical Institute. He did his Post-Doctoral research at INRIA France. From January 1997, he is a Faculty member of Computer Vision and Pattern Recognition Unit (CVPRU) of the Indian Statistical Institute, Kolkata and at present he is Professor and Head of CVPRU. His fields of research interest include Digital Document Processing, Optical Character Recognition, Camera/video text processing, and Biometrics. He has published 320 research papers in various international journals, conference proceedings and edited volumes. In 2003 he received “ICDAR Outstanding Young Researcher Award” from International Association for Pattern Recognition. Dr. Pal has been serving as General/Program/Organizing Chair and program committee member of several international conferences and workshops. He is currently serving as an Associate Editor of the ACM Transactions on Asian and LowResource Language Information Processing, Pattern Recognition, Pattern recognition Letters, International Journal of Document Analysis and Recognition, IET Biometrics, and Electronic Letters on Computer Vision and Image Analysis. He is a Fellow of IAPR. Michael Blumenstein received his PhD in Computational Intelligence from Griffith University in Queensland, Australia in 2001. He is a Professor and Associate Dean (Research Strategy and Management) as well as the Head of the School of Software at the University of Technology Sydney, Australia. Michael is an internationally and nationally
renowned expert in the areas of Pattern Recognition and Artificial Intelligence. He has published over 170 papers in refereed conferences, journals and books in these areas. His research also spans various projects applying Artificial Intelligence to the fields of Engineering, Environmental Science, Neurobiology and Coastal Management. Michael has secured competitive research grants to undertake these projects with funds exceeding AUD$4.6 Million. Components of his research into the predictive assessment of beach conditions have been commercialised for use by local government agencies, coastal management authorities and in commercial applications.