An Empirical Study of Regression Test Application Frequency Jung-Min Kim
Adam Porter
Gregg Rothermel
Department of Computer Science Univ. of Maryland, College Park College Park, MD 20742, USA +1-301-405-2726
[email protected]
Department of Computer Science Univ. of Maryland, College Park College Park, MD 20742, USA +1-301-405-2702
[email protected]
Department of Computer Science Oregon State University Corvallis, OR 97331, USA +1-541-737-2542
[email protected]
A common way to study this problem has been to find or create base and modified versions of a system and accompanying test suites. Next, a test selection algorithm is run and the size and effectiveness of the selected test suite is compared to the size and effectiveness of the original test suite [e.g., 4,11,16,17].
ABSTRACT Regression testing is an expensive maintenance process used to revalidate modified software. Regression test selection (RTS) techniques try to lower the cost of regression testing by selecting and running a subset of existing test suites. Many such techniques have been proposed and initial studies show that they can produce savings. We believe, however, that issues such as the frequency with which testing is done have a strong effect on the behavior of these techniques. Therefore, we conducted an experiment to assess the effects of test application frequency on the costs and benefits of regression test selection techniques. Our results expose essential tradeoffs that should be considered when using these techniques over a series of software releases.
One limitation of this approach is that it models regression testing as a one-time activity rather than as the continuous process it is. For example, software releases often require many changes to a system with regression testing interspersed between some number of changes (rather than one regression test at the end of a release). In practice, many companies integrate changes and then regression test on a monthly, weekly, or even daily basis. Our hypothesis is that the amount of change made between regression testing sessions strongly affects the costs and benefits of different regression test selection techniques. That is, we believe that some test selection techniques will perform less cost-effectively as the amount of changes made between regression testing sessions grows. This is because they will select increasingly larger test suites and because these suites will become increasingly less cost-effective at finding faults.
Keywords regression testing, application frequency, empirical study 1
INTRODUCTION
After modifying software, developers typically want to know that unmodified code has not been adversely affected. When such unmodified code is adversely affected, we say that a regression error has occurred. Developers often perform regression testing to search for such regression errors. The simplest regression testing strategy is to rerun all existing test suites. This method is simple to implement, but can be unnecessarily expensive, especially when changes affect only a small part of the system.
If this hypothesis is true, testing practitioners may be able to better manage and coordinate their integration and regression testing processes, thereby saving time and money. Therefore we have designed and implemented an experiment to examine this hypothesis. In the remainder of this paper we review the relevant literature, describe our research hypotheses, present the design and analysis of our experiment and discuss our conclusions and future research directions.
Consequently, an alternative approach, regression test selection (RTS) technique, has been proposed [e.g., 1,2,5,6,10,14]. With this approach only a subset of test suites are selected and rerun. Since, in general, optimal test selection1 is impossible, the cost-benefit tradeoffs of RTS techniques is a central concern of regression testing research and practice.
1
2
BACKGROUND AND LITERATURE REVIEW
2.1 Regression Testing Let P be a procedure or program, let P′ be a modified version of P and let T be a test suite for P. A typical regression test proceeds as follows:
i.e., selecting exactly the fault revealing tests.
1
1
Select T′⊆ T, a set of test cases to execute on P′.
2
Test P′ with T′, establishing P′’s correctness with respect to T′.
3
If necessary, create T″, a set of new functional or structural test cases for P′.
4
Test P′ with T″, establishing P′’s correctness with respect to T″.
5
Create T″′, a new test suite and test history for P′, from T, T′, and T″.
One limitation of this model is that it overlooks the cost of undetected faults. Since a primary purpose of testing is to detect faults, it is important to understand whether, and to what extent, test selection reduces fault detection effectiveness.
Each of these steps involves important problems. However, we restrict our attention to step 1 - the regression test selection problem.
2.4 Previous Empirical Studies Initially, cost-effectiveness, as defined by Leung and White, was the central focus of regression test selection studies.
2.2 Regression Test Selection Techniques Several regression test selection techniques have been investigated in the research literature (see [13]). Here we briefly describe several techniques and give a representative example of each.
Rosenblum and Weyuker [12] applied the technique TestTube to 31 versions of the KornShell and its test suites. For 80% of the versions, their method selected all existing test cases. They note that the test suite is relatively small (16 test cases), and that many of the test cases exercise all the components of the system.
2.2.1 Retest-All Technique This method reruns all test cases in T. This method may be used when test effectiveness is the utmost priority with little regard for cost.
Rothermel and Harrold [14] conducted a similar study with their technique, DejaVu, using several 100-500 line programs and a larger (50 KLOC) program. The savings averaged 45% for small and medium sized programs, and 95% for the larger program.
2.2.2 Random/Ad-Hoc Technique Testers often select test cases randomly or rely on their prior knowledge or experience. One such technique is to randomly select a percentage of test cases from T.
These two studies seem to indicate that in some cases, regression test selection can be cost-effective. Later studies, therefore, begin to compare different methods.
2.2.3 Minimization Technique This method (e.g., [3, 6]) aims to select a minimal set of test cases from T that covers all modified elements of P′. One such technique selects at least one test case in T that exercises every program statement added or modified to create P′.
Rosenblum and Rothermel [11] compared the performance of TestTube and DejaVu in terms of test selection. The two techniques often performed similarly, but in some cases DejaVu substantially outperformed TestTube. The study did not compare other techniques nor consider fault detection.
2.2.4 Safe Techniques These techniques (e.g., [2,14]) select, under certain conditions, every test case in T that covers changed program entities in P′. One such technique selects every test case in T that exercises at least one statement that was added or modified to create P,′ or that has been deleted from P.
Graves et al. [4] examined the relative costs and benefits of several regression test selection techniques. They examined five techniques: minimization, safe, dataflow, random, and retest-all, focusing on their abilities to reduce test suite size and to detect faults. The researchers drew the following overall conclusions from the study:
2.3 Cost and Benefit Model Leung and White [8] present a simple model of the costs and benefits of RTS strategies. Costs are divided into two types: direct and indirect. Indirect costs include management overhead, database maintenance, and tool development. Direct costs include test selection, test execution, and results analysis. Savings are simply the costs avoided by not running unselected test cases. Let T′ be the subset of T selected by a certain regression test selection strategy M for program P, and let |T′| denote the cardinality of T′. Let s be the average cost per test case of applying M to P to select T′, and let r be the average cost per test case of running P on a test case in T and checking its result. Leung and White argue that for RTS to be cost-effective the inequality: s|T′| < r(|T| - |T′|) must hold. That is, the analysis required to select T′ should cost less than running the unselected test cases, T – T′.
•
The safe method detected all faults while on the average selecting 68% of the test cases. Sometimes, however, all test cases were selected.
•
The safe and dataflow techniques had nearly identical performance. They typically detected the same faults while selecting the same numbers of test cases.
•
On average, random test suites could be nearly as effective as safe.
•
Minimization yielded the smallest and the least effective test suites. For example, small random suites (with 5 or so test cases) were equally effective at finding faults, but required no analysis.
2.5 Open Questions In this research, we consider three facets of RTS: 2
may result from reusing analyses done during early testing sessions during later testing sessions.
(1) the test selection technique, (2) the application policy - the conditions that trigger regression testing: periodic execution (daily, weekly, or monthly), or rule-based execution (after all changes, after changing critical components, or at final release), and
3.2.2 Measuring Costs We considered two types of costs. The first comes from the analysis needed to select test cases. The second may come when the selected test cases do not detect faults that could have been detected by the original test set. Our cost model focuses on the latter cost. Thus we assume that regression test selection is cost-effective under the definition given by Leung and White (see Section 2.3).
(3) the exploitation of process memory - when regression testing is done frequently, information taken from previous regression testing sessions may be used to guide activities in a current testing session.
To determine whether test selection reduces fault detection effectiveness we would like to know which test cases reveal which faults in P′. However there is no simple way to determine this because when a test fails on a program that contains multiple faults it is not always obvious exactly which fault(s) caused the failure. Thus we considered three estimators.
Most previous studies have focused on the first facet while ignoring the second and third. Yet, these latter facets are important because they may greatly affect the practical costs and benefits of regression test selection. Therefore, in this paper we investigate one aspect of test application policies: how the amount of change made to a system between regression testing sessions affects the costs and benefits of different regression test selection techniques. In particular, for different regression test selection techniques we want to know, how, as the amount of change grows, do test suite reduction and fault detection ability change? What tradeoffs exist between reduction and fault detection? And when is one technique more cost-effective than another? 3
Estimator 1 - On a per-test-suite basis. One way to measure test effectiveness is to classify the selected test suite into one of three cases: (1) no test case in T detects faults, and thus, no test case in T′ detects faults; (2) some test cases in both T and T′ detect faults; or (3) some test cases in T detect faults, but no test case in T′ detects faults. Cases 1 and 2 indicate test selection that does not reduce fault detection, and case 3 captures the situation in which test selection compromises fault detection.
THE EXPERIMENT
3.1 Hypotheses H1: Test selection ratios change as test application frequency changes.
This method is imprecise because all faults in P′ are treated as a single fault. The main advantage of this method is that it is inexpensive to implement.
H2: Test effectiveness ratios change as test application frequency changes.
Estimator 2 - On a per-test-case basis. Another approach is to identify those test cases in T that detect faults in P′ but that are not included in T′. The number of test cases in T that detect faults in P then normalizes this quantity.
3.2 Measures To investigate our hypotheses we need to measure the costs and benefits of each test selection method. To do this we constructed two models: one for calculating savings in terms of test suite size reduction, and another for calculating costs in terms of fault detection effectiveness. We restrict our attention to these costs and benefits, but there are many other costs and benefits these models do not capture. Some other costs and benefits are mentioned in Section 5.
This approach is also imprecise because it assumes that every fault revealing test case reveals a different fault. When multiple test cases reveal the same fault, duplicated test cases could be discarded without sacrificing fault detection effectiveness. This measure penalizes such a decision. Estimator 3 - On a per-fault basis. This approach tries to identify all test cases that might “theoretically” reveal each fault. A test t that detects a fault f must satisfy three conditions: (1) t must traverse the program point containing f in P′, (2) immediately after t traverses the program point containing f in P′, key program state must be perturbed (3) the output of P′ for test case t must be different from that of P run on test case t.
3.2.1 Measuring Savings Reducing test suite size saves time because we run fewer test cases, examine fewer test results, and manage less test data. These savings are proportional to the reduction in test suite size. Thus, we measure savings in test selection ratio, as given by |T′|/|T|. This approach makes several simplifying assumptions. It assumes that the cost of all test cases is uniform and all the constituent costs can be expressed in equivalent units (e.g., we don’t differentiate between CPU time and human effort). It also does not measure the savings that
Using this information, one can determine which faults may be detected by each test case. This method is the most precise one, but because it requires hand3
After doing this analysis for each test in T, we count the number of faults for which there exists at least one faultrevealing test case in T. This number is called NFdet. Next, we examine T′ - again counting the number of faults for which there exists at least one fault-revealing test case. We call this number NFdet′. Finally, we designate the total number of faults in P′ as NF.
Test Pool Size
Avg. Test Suite Size
To detect the third condition we compared the output of P and P′ to identify whether they produced different outputs for test case t.
# of 1st-order Versions
To detect the second condition we further instrumented the programs, creating two blocks – one with the faulty code and one without. We captured the state of all global and in-scope local variables immediately before the change, then executed both blocks, and then compared their states upon exit. If these states differed then t satisfied the second condition.
LOC
To detect the first condition we instrumented every program modification point in P′ to determine whether t traversed the program point containing f.
Functions
For this study, we used this third approach and we implemented it as follows.
Program Name
instrumentation it is also the most expensive.
replace
21
516
12
5542
398
printtokens
18
402
7
4130
318
printtokens2
19
483
9
4115
389
schedule
18
299
7
2650
225
schedule2
16
297
8
2710
234
tcas
9
138
12
1608
83
totinfo
7
346
12
1054
199
space
136
6218
10
13585
4361
Table 1: Experimental Subjects
white-box test cases to ensure that each exercisable statement, edge, and definition-use pair in the base program or its control flow graph was exercised by at least 30 test cases.
We use these numbers to calculate two measures of effectiveness. One is relative effectiveness, which we define as NFdet′/NFdet and the other is absolute effectiveness, which we define as NFdet′/NF.
Hutchins et al. also created faulty versions of each program by modifying code in the base version; in most cases they modified a single line of code, and in a few cases they modified between 2 and 5 lines of code. Their goal was to introduce faults that were as “realistic” as possible, based on their experience with real programs.
3.3 Experimental Instrumentation Programs 3.3.1 For our study, we obtained eight C programs with a number of modified versions and test suites for each program. The subjects come from two sources. One is a group of seven C programs collected and constructed initially by Hutchins et al. [7] for use in experiments with dataflow- and control-flow-based test adequacy criteria. The other, Space, is an interpreter for an array definition language (ADL) used within a large aerospace application. We slightly modified some of the programs and versions in order to use them with our tools. Table 1 describes the subjects, showing the number of functions, lines of code, distinct versions, test pool size, and the size of the average test suite. We describe these and other data in the following paragraphs.
Ten people performed the fault seeding, working “mostly without knowledge of each other’s work” [7, p. 196]. To obtain meaningful results, the researchers retained only faults that were detectable by at least 3 and at most 350 test cases in the associated test pool. Space Program: The space system is an interpreter for an array definition language (ADL). The program reads a file that contains several ADL statements, and checks the contents of the file for adherence to the ADL grammar, and to specific consistency rules. If the ADL file is correct, Space outputs an array data file containing a list of array elements, positions, and excitations; otherwise the program outputs error messages.
Siemens Programs: Seven of our subject programs come from a previous experiment done by Hutchins et al. [7]. These programs are written in C, and range in size from 7 to 21 functions and from 138 to 516 lines of code.
Space has 33 versions, each containing a single fault that was discovered either during the program’s development or later by the authors of this study.
For each of these programs Hutchins et al. created a pool of black-box test cases [7] using the category partition method and Siemens Test Specification Language tool [9]. They then augmented this set with manually created
The test pool was constructed in two phases. First we obtained a pool of 10,000 randomly generated test cases created by Vokolos and Frankl [17]. Then we added new 4
0.0
0.2
0.4
0.6
0.8
1.0
min
dejavu
ttube
rand25
rand50
rand75
10 9 8 7 6 5
Testing Interval
4 3 2 1
retest
10 9 8 7 6 5 4 3 2 1 0.0
0.2
0.4
0.6
0.8
1.0
0.0
0.2
0.4
0.6
0.8
1.0
Size of Selected Test Suite (% of Original)
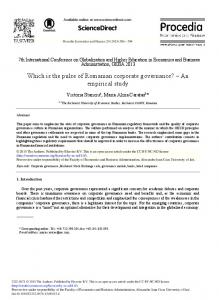
Figure 1: Test Selection Ratio by Testing Interval Conditioned on Test Selection Method test cases until every dynamically executable edge in the program’s control flow graph was exercised by at least 30 test cases. This process yielded a test pool of 13,585 test cases.
those of the Siemens programs - they take 10-100 times longer to run – we limited the number of 1st-order versions for the Space program to 10. In this way we model the situation in which regression testing is done on systems with varying amounts of modifications since the previous regression testing session.
3.3.2 Versions In this experiment we needed programs with varying numbers of modifications. We generated these modified versions in the following way. Each subject program initially consisted of a correct base version and a number of modified versions, each containing exactly one fault. We call these 1st-order versions. We selected these versions because the faults they contain are “mutually independent.” That is, any number of these faults can be merged into the base program without interfering with each other. For example, if fault f1 is caused by changing a single line and fault f2 is caused by deleting the same line, then these modifications interfere with each other. Table 1 shows the number of 1st-order versions for each subject program, ranging from 7 to 12.
Test cases, Test Pools, and Test Suites 3.3.3 We used test pools to obtain two types of test suites for each program: edge-coverage-based and non-coveragebased. To create edge-coverage-based test suites, we used the test pool for the base program, and test coverage information that we gathered from the test cases, to generate 1000 edge-coverage-adequate test suites for each base program. We also generated 1000 randomly-selected test suites for each base program. To generate the kth random test suite T for base program P (1 ≤ k ≤ 1000), we determined, n, the number of test cases in the kth edge-coverage-adequate test suite for P. Next, we chose test cases at random from the test pool for P and added them to T until it contained n test cases. This process yielded random test suites of the same size as the edge-coverage-adequate suites.
We then created higher-order versions by combining appropriate 1st-order versions. For example, in order to create an nth-order version, we combined n unique 1storder versions. We did this for every subject program until we had created all possible kth-order versions, where k was the minimum of 10 or the number of 1st-order versions available for that program. As an example, the st tcas program had 12 1 -order versions. Therefore, we st constructed 12 1 -order versions, 66 2nd-order versions, and so on up to 66 10th-order versions, for a total of 4082 versions. We did make an exception, however, for the Space program. Since its test suites are much larger than
3.3.4 Test Selection Tools To perform the experiments, we needed implementations or simulations of regression test selection tools. For safe techniques we used an implementation of Rothermel and Harrold’s DejaVu tool [15] and we simulated another safe technique, TestTube. For minimization, we created a 5
0.0
0.2
0.4
0.6
0.8
1.0
min
dejavu
ttube
rand25
rand50
rand75
10 9 8 7 6 5
Testing Interval
4 3 2 1
retest
10 9 8 7 6 5 4 3 2 1 0.0
0.2
0.4
0.6
0.8
1.0
0.0
0.2
0.4
0.6
0.8
1.0
Relative Effectiveness of Selected Test Suite (% of Detectable Defects)
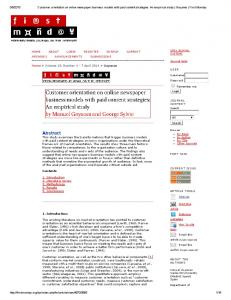
Figure 2: Relative Effectiveness by Testing Interval Conditioned on Test Selection Method From these data points we computed two dependent variables:
tool that selects a minimal set of test cases T′ such that T′ has at least one test that covers every node, in the control flow graph for P, that was changed between P and P′. As a random(n) technique we created a tool that randomly selects n% of the test cases from the suite. Retest-all does not require any tools.
The subject program (there are 8 programs, each with a variety of modified versions).
2.
The test selection technique (one of DejaVu, TestTube, minimization, retest-all, random(25), random(50), random(75)).
3.
Test suite composition (edge-coverage-based or random).
4.
Test interval (between the base and the modified program, from 1 to 10 changes can be made).
The proportion of test cases in the selected test suite T′ to test cases in the original test suite T.
2.
The number of faults revealed by T and T′.
2.
Average fault detection effectiveness.
3.4.2 Threats to Validity In this section we consider some of the potential threats to the validity of our study. Threats to internal validity are influences that can affect the dependent variables without researcher’s knowledge. They can thus affect any supposition of a causal relationship between the independent and dependent variables. In our study, our greatest concern is that instrumentation effects can bias our results. Instrumentation effects may be caused by differences in the experimental instruments (in this case the test process inputs: the code to be tested, the locality of the program changes, the composition of the test suite, or the composition of the series of versions). In this study we used two different criteria for composing test suites: edgecoverage-adequate and random. In order to reduce effects due to program versions, we used all possible
For each combination of program, test interval and technique we applied 100 edge-coverage-adequate test suites and 100 random test suites. On each test run, with base program P, modified version P′, technique M, and test suite T, we measured: 1.
Average selected test suite size.
The experiment used a full-factorial design with 100 repeated measures. That is, for each subject program, test interval and test suite composition criteria we selected 100 test suites from the test suite universe. For each test suite, we then applied each test selection technique and measured the size and fault detection effectiveness of the selected test suites. In total, we ran and evaluated 20,004,600 test suites.
3.4 Experimental Design 3.4.1 Variables The experiment manipulated four independent variables: 1.
1.
6
Second, we examine how the effectiveness of the original test suite and thus its absolute effectiveness diminish as the testing interval grows. Finally, we compare the costbenefit tradeoffs of program-analysis-based (i.e., safe and minimization) and random methods, and discuss the factors that may be responsible for the differences.
10 9
Testing Interval
8 7
In this paper, we use box plots (e.g., Figure 3) to represent data distributions. In these plots, a box represents each distribution. The box’s width spans the central 50% of the data and its left and right ends mark the upper and lower quartiles. The bold dot within the box denotes the median. The dashed vertical lines attached to the box indicate the tails of the distribution; they extend to the standard range of the data (1.5 times the inter-quartile range). All other detached points are “outliers”. We also use arrays of box plots to show data distributions that are conditioned on one or more other variables (e.g., Figure 1).
6 5 4 3 2 1 0.0
0.2
0.4
0.6
0.8
1.0
Effectiveness of Original Test Suite (% of Total Defects)
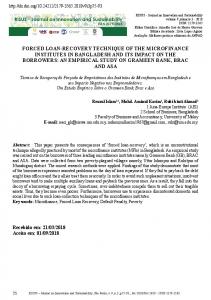
Figure 3: Absolute Effectiveness for Retest-All by Interval
By conditioned, we mean that data are partitioned into subsets, such that the data in each subset have the same value for the conditioning variables.
combinations of versions. However, at this time we do not control for the structure of the subject programs, or for the locality of program changes. To limit problems related to this, we run our test selection algorithm on each suite and each subject program.
4.1 Size Reduction Figure 1 shows the ability of each RTS technique to reduce test suite size by testing interval, conditioned on the technique itself. The random(n) methods select n% of the test cases by construction and the retest-all method always selects all test cases. Therefore we only consider program-analysis-based methods here.
Threats to external validity are conditions that limit our ability to generalize the results of our experiment to industrial practice. One threat to external validity concerns the representativeness of the subject programs. The subject programs are of small and medium size, and larger programs may be subject to different cost-benefit tradeoffs. Also, the Siemens programs contain seeded faults although every effort to make them as realistic as possible was taken. Another issue is that these faults are roughly the same “size”. Therefore, a program with, say, ten faults has been changed more than a program with one fault. Industrial programs have much more complex error patterns. Another threat to external validity for this study is process representativeness. This arises when the testing process we used is not representative of industrial ones. This may endanger our results since the test suites we utilized may be more or less comprehensive than those that could appear in practice. Also, our experiment mimics a corrective maintenance process where the specification is not changed, but there could be many other types of maintenance in which regression testing might be used. These threats can only be addressed through additional studies using a greater range of software artifacts. 4
First, we observe that DejaVu selects a median of 63.8% of the test suite when the testing interval is 1 (as we found in earlier experiments [4]). However, the median selection ratio increases rapidly as testing interval increases. For example, DejaVu’s median test selection across all programs and intervals was 98.1%. Our visual inspection of the programs suggests that selection ratio is heavily dependent on the program, and the type and location of faults. For example, DejaVu’s selection ratios range from 2.2% to 98.1% for program printtokens when the interval is 1. Next, we see that TestTube selects a median of 92.2% of the test suite when the testing interval is 1. As the testing interval increases, selection ratios increase to 99.3%. Minimization selects a median of 0.4% of the test suite for interval 1, to a median of 2.0% for interval 10. This increase is less than one new test case for each added change. For example, for program totinfo, a median of 4.2 test cases is selected when testing interval is 10 and 1 test case is selected when testing interval is 1. Relative Effectiveness 4.2 Figure 2 shows the relative effectiveness of selected test suites by testing interval, conditioned on technique.
DATA AND ANALYSIS
We analyze the data in three steps. First, we compare the ability of different RTS techniques to reduce test suite size and still detect faults as the testing interval grows.
Safe methods, by virtue of their being “safe”, guarantee that all “detectable” faults will be detected (given certain 7
0.0
0.2
0.4
0.6
0.8
1.0
min
dejavu
ttube
rand25
rand50
rand75
10 9 8 7 6 5
Testing Interval
4 3 2 1
retest
10 9 8 7 6 5 4 3 2 1 0.0
0.2
0.4
0.6
0.8
1.0
0.0
0.2
0.4
0.6
0.8
1.0
Absolute Effectiveness of Selected Test Suite (% of Total Defects)
Figure 4: Absolute Effectiveness by Testing Interval Conditioned on Test Selection Method assumptions outlined in [2,14]). That is, their effectiveness is the same as that of retest-all. Therefore, in this section we will concentrate on the random and minimization methods.
We evaluated this hypothesis by running instrumented P′ on the original suite T. We then counted the number of faults in P′ that were “detectable” by T. (See Section 3.2.2 for the conditions under which we consider a fault to be detectable.)
For random methods, the median relative effectiveness is always over 80% when the testing interval is 1. As testing interval increases, relative effectiveness also increases. For example, the median effectiveness of random(25) is 95.4%. Another thing to note is that, on average, random(50) and random(75) are nearly as effective as retest-all – with median relative effectiveness of 99.3% and 100%, respectively.
Figure 3 shows the ratio of detectable faults to testing interval for retest-all run on every combination of test suite, subject program, and interval. By construction, we know that the fault in each 1st-order version is detectable by some test cases in the test “pool” associated with that program. We also see that the median effectiveness of retest-all is 1 when the testing interval is 1. However there are several outliers, indicating that some test “suites” do not detect particular faults.
Minimization has a median relative effectiveness of 13.5% at interval 1. However, effectiveness climbs rapidly as the interval increases – with a median relative effectiveness of 59.9% at interval 10.
As testing interval increases, the percentage of detectable faults drops steadily, with a median of 88.9% when the testing interval is 10. However, since most of the higherorder (after 8th-order) versions come from three subject programs (tcas, totinfo, and replace), the behavior after interval 8 needs to be interpreted with caution. Nevertheless, the data are consistent with our hypothesis that fault detection effectiveness decreases as the number of faults increases. Therefore, we also investigated the absolute effectiveness of selected test suites.
4.3 Effectiveness of T During our study, we hypothesized that a test suite that revealed a fault f in P′ when f was the only fault in P′ might no longer reveal the same fault when f is mixed with other faults. One possible reason is that failures can be “disguised” by interacting faults. Another may be that some faults may change a program’s control flow, causing other faults to go unexecuted. If this happens, then increasing the testing interval may negatively affect not only the fault-detection effectiveness of test selection techniques, but of retest-all as well.
4.4 Absolute Effectiveness Figure 4 shows the absolute effectiveness of selected suites by test interval, conditioned on technique. Safe techniques always have a relative effectiveness of 8
100%. However, their absolute effectiveness drops as interval increases. Random techniques show a similar pattern. In contrast the median absolute effectiveness of minimization still increases as the testing interval grows.
effectiveness of test suites chosen by selective retest techniques changes as the frequency of regression testing changes.
4.5 Cost-Benefit Tradeoffs When we consider both the costs and the benefits of the different test selection techniques we find several interesting patterns.
•
As testing interval increases so does the percentage of faults that are undetectable by the original test suite. This affects the performance of all RTS techniques we studied.
•
Safe techniques selected the same or fewer test cases as retest-all did while having the same effectiveness. Therefore, they are preferable to retest-all as long as their analysis costs are less than the cost of running the unselected test cases. We saw, however, that as the testing interval grew, almost all test cases were selected. In this case, safe methods may not be preferable to retest-all.
Overall, DejaVu selected 98% of the test cases while finding 93.6% of the existing faults. But it was most costeffective when the testing interval was small (63.8% of test cases were selected). TestTube also performed best under these circumstances although the difference is not as great. These techniques may also be cost-effective when the cost of missing faults is very high or when the cost of running test cases is very high. For example, for some safety-critical systems the cost of missing a fault may be so high that non-safe RTS techniques cannot be used.
Nevertheless, our analysis showed that the performance of safe techniques depended heavily on the structure of the program, the location of faults and the composition of the test suites. For instance, test cases for the program schedule2 are constructed in such a way that each test exercises large portions of the code. Consequently, changes, no matter how small, tend to involve all test cases in the test suite. Test cases that exercise independent portions of the system might not exhibit such behavior and thus might be more amenable to safe test selection. Research that successfully merges the RTS techniques with test suite construction is likely to have a large effect on the use of safe techniques in practice.
Across all observations, minimization selected 1.7% of the test cases and found 44% of the faults. It was most cost-effective when the interval was large – at interval 10 it selected 2.0% of the test cases while identifying 52.8% of the faults. Minimization might therefore be recommended when the cost of running test cases is very high and the cost of missing faults is not too high. All random techniques had high effectiveness at low testing intervals and increasing effectiveness as testing interval increased. As testing interval increased, differences between different methods decreased. Thus, if the cost of missing faults is not too high, then a small random technique, random(25), will be the most costeffective when the testing interval is high. 5
Random techniques are surprisingly cheap and effective. Interestingly, as the testing interval increases their median effectiveness approaches that of retest-all with less variation between runs. That is: at small testing intervals effectiveness ranges from very high to very low. However, as the testing interval increases, this range gets much smaller. Thus, a user of random techniques might be more confident of their effectiveness in the latter situation.
•
The difference in performance between minimization at low testing intervals and minimization at high testing intervals was remarkable. At low testing intervals minimization selected one or two test cases and was only 15% as effective as retest-all. However, at a testing interval of 10, it selected only four or five test cases, while having about 60% of the effectiveness of retest-all.
CONCLUDING REMARKS
We have presented the initial results of an empirical study of regression test application frequency. We investigated some of the costs and benefits of several RTS techniques when the number of changes between the base and subsequent versions of a program increases. Our results highlight several differences among RTS techniques with respect to test application frequency. They also illustrate some tradeoffs and provide an infrastructure for further research. As we discussed earlier, this study has several limits to its validity. Particularly, several threats to external validity limit our ability to generalize our results. These threats can only be addressed by extensive experiments with a wider variety of programs, test suites, series of versions, type of faults, etc. Keeping this in mind, we drew the following conclusions. •
•
Thus, although this approach will miss some faults, from a cost-benefit perspective it presents an interesting option. Also, in our study minimization picks exactly one test case through a change. It would be interesting to ask what would happen if it instead
Our experimental results strongly support our hypotheses that the size and fault detection 9
picked two, three or more. •
As testing intervals increase, complex fault interactions can make it harder to detect some faults. This is somewhat obvious. More to the point, however, is that as the testing interval increases, information about a base program P, and test set T, will become less predictive of the state of P′. For example, a test set that was edge-coverage-adequate on program P, might have very different coverage of program P′.
We are continuing this family of experiments. We plan to (1) improve our cost models to include factors such as testing overhead and to better handle analysis cost, (2) extend our experiment to larger programs with a wider variety of naturally-occurring faults and (3) explore techniques that incorporate previous testing history.
5.
M. J. Harrold and M. L. Soffa. An incremental approach to unit testing during maintenance. In Proc. of the Conf. on Softw. Maint., pages 362-367, Oct. 1988.
8.
H. Leung and L. White. A cost model to compare regression test strategies. In Proc. of Int’l. Conf. on Softw. Maint., pages 201-208. Oct. 1991.
9.
T. Ostrand and M. Balcer. The category-partition method for specifying and generating functional tests. Commun. ACM, 31(6), June 1988.
13. G. Rothermel and M. J. Harrold. Analyzing regression test selection techniques. IEEE Trans. on Softw. Eng., 22(8):529-551, Aug. 1996. 14. G. Rothermel and M. J. Harrold. A safe, efficient regression test selection technique. ACM Trans. on Softw. Eng. and Methodology, 6(2):173-210, Apr. 1997. 15. G. Rothermel and M. J. Harrold. Aristotle: A system for research and development of program analysis based tools. Technical Report OSU-CISRC-3/97TR17, The Ohio State University, Mar. 1997.
K. Fischer, F. Raji, and A. Chruscicki. A methodology for retesting modified software. In Proc. of Nat’l. Tele. Conf. B-6-3, pages 1-6, Nov. 1981. T. Graves, M. J. Harrold, J.-M. Kim, A. Porter, and G. Rothermel. An empirical study of regression test selection techniques. In Proc. of the 20th Int’l. Conf. on Softw. Eng., pages 188-197, Apr. 1998.
M. Hutchins, H. Foster, T. Goradia, and T. Ostrand. Experiments on the effectiveness of dataflow- and controlflow-based test adequacy criteria. In Proc. of the 16th Int’l Conf. on Softw. Eng., pages191-200, May 1994.
12. D. Rosenblum and E. J. Weyuker. Lessons learned from a regression testing case study. Empir. Softw. Eng. Journal, 2(2), 1997.
Y. Chen, D. Rosenblum, and K. Vo. TestTube: A syetem for selective regression testing. In Proc. of the 16th Int’l. Conf. on Softw. Eng., pages 211-222, May 1994.
4.
7.
11. D. Rosenblum and G. Rothermel. A comparative study of regression test selection techniques. In Proc. of the 2nd Int’l. Workshop on Empir. Studies of Softw. Maint., Oct. 1997.
REFERENCES 1. H. Agrawal, J. Horgan, E. Krauser, and S. London. Incremental regression testing. In Proc. of the Conf. on Softw. Maint., pages 348-357, Sept. 1993.
3.
J. Hartmann and D. Robson. Techniques for selective revalidation. IEEE Software, 16(1):31-38, Jan. 1990.
10. T. Ostrand and E. Weyuker. Using dataflow analysis for regression testing. In Sixth Annual Pacific Northwest Softw. Qual. Conf., pages 233-247, Sept. 1988.
ACKNOWLEDGEMENTS This work was supported in part by grants from National Science Foundation Faculty Early Career Development Award CCR-9501354 to University of Maryland, and by National Science Foundation Award CCR-9707792 to Ohio State University, University of Maryland, and Oregon State University. Siemens Laboratories supplied some of the subject programs. Alberto Pasquini, Phyllis Frankl, and Filip Vokolos provided the Space program and many of its test cases. Chengyun Chu assisted with further preparation of the Space program and development of its test cases.
2.
6.
16. G. Rothermel and M. J. Harrold. Empirical studies of a safe regression test selection technique, IEEE Trans. on Softw. Eng., 25(6), pp. 401-419, June 1998. 17. F. I. Vokolos and P. G. Frankl. Empirical evaluation of the textual differencing regressioin testing technique. In Proc. of the Int'l. Conf. On Softw. Maint., pages 44-53, Nov. 1998.
10