An Evaluation of Automode, a Computer-Controlled Ventilator Mode, with the Siemens Servo 300A Ventilator, Using a Porcine Model Shirley J Holt RRT, Ronald C Sanders MD, Tracy L Thurman, and Mark J Heulitt MD FAARC
BACKGROUND: Weaning of mechanical ventilation in patients optimally includes meeting their needs by making frequent ventilator adjustments. The Siemens Servo 300A mechanical ventilator is designed to allow the ventilator to be interactive with the patient’s needs by making breath-bybreath adjustments in both control and support modes. We undertook the following experiment to validate that the Automode algorithm responded appropriately using a pediatric animal model when apnea occurred and if there was any impact on work of breathing. METHODS: We ventilated 6 sedated spontaneously-breathing piglets using Automode in pressure-regulated volume control/ volume support (PRVC/VS) mode, pressure control/pressure support (PC/PS) mode, and volume control/volume support (VC/VS) mode. Data were collected using both a computerized respiratory monitor and data acquisition system that recorded and analyzed individual animal breaths for response time, effort of triggering, and work of breathing. Data collection began with the animals breathing spontaneously in each support mode, followed by the administration of a short-acting neuromuscular blocker (succinylcholine) to induce apnea, thus allowing the ventilator to switch between modes automatically. Data collection was continued before, during, and after apnea to observe the duration of inspiratory effort, trigger response time, and any significant pressure or flow variances of the Automode feature. In addition, patient work of breathing (WOBP) and ventilator work of breathing (WOBV) were measured before and after each phase. RESULTS: We found no instances of failure of Automode to follow the predetermined algorithms. There was a difference in both the amount of change in pressure and most negative deflection of pressure by each animal during triggering in the post-paralysis phase (p < 0.05). Response time for individual breaths was shorter from initiation of breath to most negative deflection of pressure during the post-paralysis phase (p < 0.05). Maximum flow reached was lower in the post-paralysis phase for VC/VS and PC/PS (p < 0.05). We also found WOBP decreased and WOBV increased in the post-paralysis phase for all modes tested. CONCLUSIONS: The Automode algorithm performed as expected in this animal experiment. We conclude that differences in response time and negative deflection of pressure, as an indication of animal effort, and maximum flow reached were due to continued weakness from the neuro-muscular blocker. However, the ventilator continued to trigger despite decreased effort by the animal. [Respir Care 2001;46(1):26 –36] Key words: artificial ventilation equipment, positive-pressure respiration, inspiratory work, artificial respiration, positive endexpiratory pressure, Automode.
Shirley J Holt RRT, Ronald C Sanders MD, Tracy L Thurman, and Mark J Heulitt MD FAARC are affiliated with Critical Care Medicine, Department of Pediatrics, University of Arkansas for Medical Sciences, Little Rock, Arkansas. Shirley J Holt RRT, Ronald C Sanders MD, and Mark J Heulitt MD FAARC are also affiliated with Arkansas Children’s Hospital, Little Rock, Arkansas.
Siemens Medical Systems, Danvers, Massachusetts, provided financial support for this research. Correspondence: Mark J Heulitt MD FAARC, Department of Pediatrics, University of Arkansas for Medical Sciences/Arkansas Children’s Hospital, 800 Marshall Street, Slot 512, Little Rock AR 72202. E-mail:
[email protected].
A version of this paper was presented by Shirley Holt during the American Association for Respiratory Care International Respiratory Congress, December 13–15, 1999, Las Vegas, Nevada.
26
RESPIRATORY CARE • JANUARY 2001 VOL 46 NO 1
AUTOMODE
WITH THE
SIEMENS SERVO 300A VENTILATOR
Introduction Weaning patients from mechanical ventilators continues to be one of the most perplexing yet vital issues in caring for critically ill infants and children. Reversing the disease process that committed the patient to mechanical ventilation and then successfully decreasing ventilator support to a level that allows for extubation are the primary goals of weaning. There are various opinions about the proper way to wean patients from mechanical ventilation.1–3 However, delays in weaning patients from mechanical ventilator support are associated with a combination of equipment factors, patient conditions, and caregiver decisions regarding weaning and extubation criteria. Equipment factors relate to the ability of the mechanical ventilator to meet the needs of the patient. These equipment factors have an increased importance in pediatric patients, in which work of breathing (WOB) associated with the equipment is increased.4 –7 We believe that in order to wean patients optimally and ensure patient comfort, ventilator adjustments would have to be made moment-to-moment in response to the patient’s immediate physiologic needs. It is, of course, unrealistic for any medical, nursing, or respiratory care staff to perform in this manner. In response to this need for improved patientventilator interaction, some researchers have attempted to create an interactive computer-directed weaning system, with promising results.8 –11 In order to enhance weaning of patients from mechanical ventilation, the Servo 300A (Siemens Medical Systems, Danvers, Massachusetts) mechanical ventilator with Automode seeks to be more interactive with the patient. Automode is a patient-interactive mode that uses a computer-directed algorithm to direct both control and support modes, depending on the patient’s needs. When Automode is enabled, it allows the ventilator to switch between volume control/volume support (VC/VS), pressure control/pressure support (PC/PS), and pressureregulated volume control/volume support (PRVC/VS) modes with spontaneously triggered breaths. When Automode is activated, the ventilator switches to the corresponding support mode after the patient triggers 2 consecutive breaths. The ventilator remains in the support mode as long as the patient continues to breathe spontaneously. If the patient stops triggering, the ventilator automatically switches back to the clinician-selected control mode. This study was designed to evaluate the ability of the computerized algorithm incorporated within the Servo 300A ventilator to respond to drug-induced apnea by switching between control and support modes, using a pediatric animal model. Patient WOB and response time of the ventilator were measured as indicators of the impact on
RESPIRATORY CARE • JANUARY 2001 VOL 46 NO 1
the patient’s ability to wean effectively from mechanical ventilation. Methods Animal Model The Animal Review Committee of the University of Arkansas for Medical Sciences approved this study. Animals were cared for in accordance with the standards for care and use of laboratory animals set forth by the university. Animal Model Preparation Studies were performed on 6 pigs on different days. The animals were 2–3 weeks old and weighed approximately 6 –10 kg each. This animal model was selected because respiratory rate, tidal volume (VT), and minute ventilation are comparable to those of pediatric patients. Twenty-four to 48 hours prior to the study day, vascular catheters (5 French) were surgically placed via cutdown in the external jugular vein for drug administration. On the study day, all animals were intravenously anesthetized with midazolam (0.25 mg/kg) and propofol (3 mg/kg) and intubated with a 4.0 – 4.5 mm-inner-diameter cuffed endotracheal tube. Endotracheal tube location was confirmed by direct visualization and the cuff inflated to a minimal occlusion pressure. After intubation, the animal was placed into a prone position in a temperature-controlled chamber. Gas humidification was maintained by a heat and moisture exchanger (Humidivent 600, Portex, Keene, New Hampshire) positioned on the endotracheal tube between the animal and the pneumotachograph (Fig. 1). Supplemental intravenous anesthesia was administered continuously via the external jugular venous catheter. The anesthesia consisted of midazolam (0.15 mg/kg/h) and propofol (10 mg/kg/h). The animal’s heart rate, respiratory frequency, pulse oximetry saturation, and temperature were monitored continuously with a physiologic monitor. The level of sedation was clinically monitored in order to maintain the animal in a light sleep, breathing spontaneously, arousable with interventions or stimulation, but returning to sleep. Conducting the Automode experiment required the animals to become apneic during each study setting, thus allowing the ventilator to switch modes automatically. Succinylcholine, a short-acting neuromuscular blocking agent, was used to temporarily paralyze the animals (2 mg/kg). Since each animal responded differently to the succinylcholine, dosages of the medication were adjusted to induce the necessary time of apnea for each animal. The apnea period varied among the animals: each animal was apneic for at least 30 seconds but not longer than 4 minutes.
27
AUTOMODE
WITH THE
SIEMENS SERVO 300A VENTILATOR
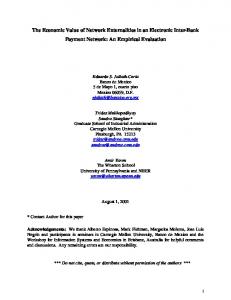
Fig. 1. Study setup components include Biopac MP-100 system (including UIM 100A component that links analog and digital inputs and outputs), Bicore monitor, Bicore flow transducer, ventilator, computer, computer monitor, heat and moisture exchanger (HME), pneumotachograph (Pneumotach), transducers, carrier demodulators, and an esophageal catheter/balloon. Dotted lines represent tubes. Solid lines represent cables.
Before performing the next experiment, a rest period was allowed for the animal to fully recover from the succinylcholine. We considered the animal fully recovered from the succinylcholine when it had returned to its normal baseline state (respiratory rate, pulse oximetry, VT). Equipment Setup The animals were sedated, intubated, and placed on the Servo 300A ventilator in the specific mode and settings, according to the study protocol. Each animal was studied on 2 separate days, using PC/PS, PRVC/VS, and VC/VS modes in random order. In the pressure-controlled modes, a peak inspiratory pressure (PIP) adequate to deliver 6 mL/kg VT and pressure support of 5 cm H2O was used. In the volume-controlled modes, a VT of 6 mL/kg was used. In all modes, ventilator frequency was 10 breaths/minute,
28
positive end-expiratory pressure (PEEP) was 5 cm H2O, inspiratory rise time was 5%, and the fraction of inspired oxygen (FIO2) was 0.30. All studies were conducted in the pediatric patient range, using flow-triggering, with the sensitivity set in the middle of the “green zone” on the Servo 300A. When the pointer of the sensitivity dial rests in the green zone, a ventilator breath is initiated when the patient’s effort causes a brief drop in flow, of 0.3–1 L/min.12 Flow is sensed at the expiratory flow transducer. The trigger sensitivity is determined as the difference between inspiratory flow and expiratory flow. Each animal was studied on 2 separate days, in all modes in which Automode could be activated. For all experiments, data were collected for at least 5 spontaneous triggered support mode breaths. Succinylcholine was then administered to induce temporary apnea. Data collection continued uninterrupted as the ventilator switched to the
RESPIRATORY CARE • JANUARY 2001 VOL 46 NO 1
AUTOMODE
WITH THE
SIEMENS SERVO 300A VENTILATOR
Fig. 2. Graph of data collected during pressure-regulated volume control/volume support (PRVC/VS) mode, with positive end-expiratory pressure (PEEP) 5 mm Hg, flow triggering, respiratory rate 10, pediatric range. This figure shows the switch from VS to PRVC and back to VS. Breaths marked “P” are PRVC breaths. Breaths marked P1 are patient-triggered PRVC breaths. Breaths marked V are VS breaths. V1 is a VS breath at the previous PRVC level. The top graph shows all signals separated for scales. The bottom graph shows the same set of breaths with the pressure scale and all signals overlapped. Pressure waveforms were measured at the airway.
control mode and back to the support mode as the animal began to breathe spontaneously again (Fig. 2). Only data from the pre-paralysis and post-paralysis phases were reported, since only ventilator work was obtained while the animal was apneic. Data Acquisition Airway pressure and flow rates were measured at the proximal end of the endotracheal tube, using a differential flow transducer equipped with a pneumotachograph/pressure transducer system connected to the BiCore CP-100 monitor (BiCore Monitoring Systems, Irvine, California). The dead space within the flow transducer was 11 mL. Intrapleural pressure was inferred using a standard commercially manufactured esophageal catheter also connected to the BiCore CP-100 pulmonary monitor. Esophageal balloon placement was confirmed using the occlusion test.13 The BiCore monitor records both measured and calculated respiratory parameters. The measured parameters
RESPIRATORY CARE • JANUARY 2001 VOL 46 NO 1
were airway pressure, esophageal pressure, and airway flow.14 Patient WOB (WOBP) and ventilator work (WOBV) are calculated from these measurements. WOBP is the amount of work done by the respiratory muscles to move a given volume of gas during spontaneous breathing or in a ventilator-assisted breath.15 The BiCore CP-100 monitor calculates WOBP by integrating the area of the esophageal pressure and VT loop from the start of inspiration until either the end of inspiration or until esophageal pressure becomes greater than end-expiratory esophageal pressure.16 WOBV is the physical force required by the ventilator to move a given volume of gas into the lung with a relaxed chest wall.15 WOBV is calculated in the BiCore CP-100 monitor by integrating the area of the airway pressurevolume loop.16 The chest wall compliance was directly measured by paralyzing each animal with succinylcholine (2 mg/kg), ensuring an adequate respiratory rate and VT with a control mode of mechanical ventilation. While the animal was in a relaxed state, chest wall compliance was obtained by analysis of the esophageal pressure and VT
29
AUTOMODE
WITH THE
SIEMENS SERVO 300A VENTILATOR
loop, using the Campbell-diagram software, and was integrated into the calculation of WOB.17 In addition to WOB, the BiCore also calculates respiratory drive (P0.1) and inspiratory time fraction (ratio of inspiratory time to total breathing-cycle time or TI/TTOT). Diaphragmatic contraction is a response to stimulation from the neural drive and P0.1 is a measure of this force in cm H2O. It is defined as the airway occlusion pressure at the first 100 ms after airway closure, prior to the animal’s conscious recognition of occlusion.18 This value represents work expenditure during the animal’s initiated ventilator breath and if elevated represents an increase in work by the animal. Consequently, a low P0.1 value may indicate when respiratory drive is blunted—for example, when there is residual effect from the neuromuscular blocking agent. Concurrently, TI/TTOT is a measure of endurance and is defined as the ratio of the inspiratory time to the total time of the respiratory cycle. This value is a ratio and therefore there has no unit of measure. If respiratory muscles fatigue, more time is spent in inspiration, so TI/TTOT decreases.16 Theoretically, this may also occur with the effects of neuromuscular blocking agents. Additional measurements of respiratory flow and pressure waveforms were acquired using the Biopac MP-100 System (MP-100 with AcqKnowledge software, Biopac Systems, Santa Barbara, California), a computer-based data acquisition system that performs many of the same functions as a chart recorder. For each Biopac MP-100 System study, a nonheated 0 –35 L/min pneumotachograph was placed in line between the animal and ventilator. Respiratory flow was obtained by connecting 2 pressure taps on the differential flow pneumotachograph (Model 4500A, Hans Rudolph, Kansas City, Missouri) to a variable-reluctance pressure transducer (⫾ 2 cm H2O) and carrier demodulator (CD15, Validyne Engineering, Sacramento, California). To monitor pressure, the pneumotachograph was equipped with a pressure hose, barb-type port that allowed airway pressure sampling. This port was connected to a separate variable-reluctance pressure transducer (⫾ 50 cm H2O) (MP45– 871, Validyne Engineering, Sacramento, California) and carrier demodulator. All output signals were routed via an analog channel box into the Biopac MP-100 data acquisition unit, converting them into digital signals that can be processed with a computer. Signals were obtained at a rate of 1,000 samples per second. Volume measurements were obtained through the computer by integrating the flow signal. In addition, a patient trigger voltage signal was routed via a custom-made cable to the analog channel box and MP-100 and displayed by the computer, utilizing Biopac’s AcqKnowledge software. Calibrations were tested using 2 known high and low signals. These data were used to compare breath-by-breath respiratory patterns of our animal model. Time measurements were taken from the initiation of a breath (start of
30
deflection of inspiratory flow) to the most negative deflection of pressure and from the initiation of the breath to the maximum flow obtained during the breath cycle (Figs. 3 and 4). We defined these measurements as duration of inspiratory effort. Other data obtained were most negative deflection of pressure at the airway, maximum flow, and the change in pressure from the start of deflection of pressure to the most negative deflection in pressure (⌬P). Statistical Analysis Each animal was used as its own control. Descriptive statistics were performed for WOBP, WOBV, respiratory rate, minute ventilation, peak inspiratory flow, peak expiratory flow, PIP, P0.1, TI/TTOT, duration of inspiratory effort, maximum flow, and ⌬P. The mean values for these were compared by the Wilcoxon signed rank test for significant differences, using commercially available statistical software, SPSS for Windows (SPSS, Chicago, Illinois). A p value ⱕ 0.05 was considered statistically significant. Results Table 1 lists mean values for measurements obtained from respiratory wave forms collected with the Biopac MP-100 system. The most negative deflection of pressure needed to generate a breath was lower in the pre-paralysis phase of the experiment, by a mean of 79% across all modes, which was statistically significant. Also, in all modes, the duration of inspiratory effort (elapsed time from initiation of breath to most negative deflection of pressure), was shorter (30 – 42%) in the post-paralysis phase, whereas the time from initiation of breath to maximum flow in the post-paralysis phase was slightly longer for PRVC/VS (17%) than for VC/VS (3%) or PC/PS (⬍ 1%). These differences were not statistically significant and indicate that there was little change in inspiratory flow delivery to the animals in the VC/VS and PC/PS ventilation modes. However, during the post-paralysis phase, there was a significant decrease in the maximum flow reached in VC/VS (45%) and PC/PS (62%). In the post-paralysis phase of the experiment PRVC/VS also showed a decrease (24%) in maximum flow, but this difference was not statistically significant. Figure 2 shows signals for pressure, flow, volume, and patient trigger for the pre-paralysis and post-paralysis phases. When the animal switched from PRVC to VS, the next 2 animal-initiated breaths were PRVC breaths. The next triggered breath was delivered as a PRVC breath. The next breath was a VS breath delivered with a pressure level equal to the last PRVC breath. There were no episodes of arterial oxygen desaturation during the switch from control to support modes.
RESPIRATORY CARE • JANUARY 2001 VOL 46 NO 1
AUTOMODE
WITH THE
SIEMENS SERVO 300A VENTILATOR
Fig. 3. Graph of data collected during volume control/volume support (VC/VS) mode, with positive end-expiratory pressure 5 mm Hg, respiratory rate 10, flow triggering, pediatric range. This figure shows a single pre-paralysis breath. The top graph shows all signals separated for scales. The bottom graph shows the same breath with the pressure scale and all signals overlapped. Pressure waveforms were measured at the airway. Delta p (the change in pressure from the start of deflection of pressure to the most negative deflection in pressure) ⫽ 2.62 cm H2O.
The magnitude of negative deflection of pressure represents the difference between the baseline pressure and the most negative deflection of pressure (⌬P), which is a representation of the magnitude of the animal’s effort. The ⌬P decreased significantly (146 –248%) in the post-paralysis phase for all modes studied. For example, in PRVC/VS the animal created a ⌬P of 4.22 cm H2O in the pre-paralysis phase, but only exerted a ⌬P of 1.28 cm H2O in the post-paralysis phase (see Figs. 3 and 4). Figure 5 is a box plot of WOBP before and after paralysis for each mode. In all ventilator modes, the WOBP was an average of 150% lower in the post-paralysis phase (p ⫽ 0.028). Table 2 lists mean values for data collected from the BiCore CP-100 monitor. WOBV increased by an average of 55% in the post-paralysis phase, representing increased work by the ventilator, thus more support. Respiratory rate (8 –24%) and minute ventilation (19 – 42%) were lower in the post-paralysis phase for all 3 modes. Peak inspiratory
RESPIRATORY CARE • JANUARY 2001 VOL 46 NO 1
flow (9 –27%) was higher and peak expiratory flow was on average 10% lower in the post-paralysis phase. PIP (2– 11%) showed minimal differences between pre-paralysis and post-paralysis across all modes. For all the values above, none of the differences in the values were considered clinically important except WOBV. The P0.1 and TI/TTOT values were also collected by the BiCore monitor and are included in Table 2. Both of these measurements may reflect residual effects of the neuromuscular blocking agent. However, in this experiment the pre-paralysis and post-paralysis values were not increased to a level of clinical importance. Discussion Although devices implementing the concepts that Automode is based on have been anticipated in the patient care arena, validation of this feature on the Servo 300A in the animal lab is essential to assure patient safety. The data
31
AUTOMODE
WITH THE
SIEMENS SERVO 300A VENTILATOR
Fig. 4. Graph of data collected during volume control/volume support (VC/VS) mode, with positive end-expiratory pressure 5 mm Hg, respiratory rate 10, flow triggering, pediatric range. This figure shows a single post-paralysis breath (same animal and study as Figure 3). The top graph shows all signals separated for scales. The bottom graph shows the same breath with the pressure scale and all signals overlapped. Pressure waveforms were measured at the airway. Delta p (the change in pressure from the start of deflection of pressure to the most negative deflection in pressure) ⫽ 0.78 cm H2O.
obtained during this experiment indicated that the Automode algorithm performed as expected, without causing an increase in WOB or ventilator response time. Weaning patients from mechanical ventilation requires waiting until the disease process that caused the patient to need assisted ventilation reverses and then successfully decreasing ventilator support to a level that allows extubation. Successfully weaning patients off the ventilator rapidly is of utmost importance because of inherent risks involved in such an invasive medical intervention.19 Restoring infants and children to a physiologic state of normal spontaneous ventilation is critical to their long-term prognosis because of the special risks they face due to their anatomic and physiologic differences from adults.20 An important factor in successful weaning of mechanical ventilation is the clinician’s ability to manipulate the ventilator so that it responds to the patient’s physiologic respiratory demands by providing more or less support, as needed. If the ventilator itself could make these adjustments, based on the patient’s physiologic needs and ven-
32
tilatory pattern, it would provide optimal weaning.21 Experiments with the concept of closed-loop ventilation have been investigated by other researchers attempting to interface patients and ventilators, using computer-directed algorithms in this way.8 –10 The person making the decision to wean the patient may have an impact on the length of mechanical ventilation. Respiratory therapist-driven weaning protocols are being examined as an alternative to current standard practices of weaning.22,23 It is thought by some health care providers that respiratory therapists might be optimal weaning facilitators. Decision-making by respiratory therapists has been thought to have the potential to reduce the length of mechanical ventilation, because of the availability of respiratory therapists at the bedside during their frequent patient assessments. Respiratory therapists frequently perform diagnostic functions such as sampling for arterial blood gas analysis, pulse oximetry, end-tidal carbon dioxide measurement, and airway function screening, and they have the expertise to interpret that information.
RESPIRATORY CARE • JANUARY 2001 VOL 46 NO 1
AUTOMODE Table 1.
WITH THE
SIEMENS SERVO 300A VENTILATOR
Mean Values from Measurements of Respiratory Wave Forms Measurement
Pre-Paralysis
Post-Paralysis
p Value
Pressure Regulated Volume Control/Volume Support (Ventilator Setting) (PRVC/VS) Most negative deflection of pressure (cm H2O) Initiation of breath to most negative deflection in pressure—time elapsed (ms) Maximum flow (mL/s) Initiation of breath to maximum flow—time elapsed (ms) Change in pressure from initiation of breath to most negative pressure (cm H2O)
1.87 ⫾ 0.99 132 ⫾ 69 198 ⫾ 43 310 ⫾ 144 4.22 ⫾ 1.20
3.80 ⫾ 0.47 101 ⫾ 67 160 ⫾ 33 361 ⫾ 111 1.28 ⫾ 0.52
0.028 0.028 0.173 (NS) 0.463 (NS) 0.028
4.20 ⫾ 0.69 82 ⫾ 18 127 ⫾ 12 379 ⫾ 51 1.09 ⫾ 0.51
0.043 0.043 0.043 0.893 (NS) 0.043
4.01 ⫾ 0.30 108 ⫾ 43 123 ⫾ 25 405 ⫾ 102 1.24 ⫾ 0.31
0.028 0.028 0.028 0.917 (NS) 0.028
Volume Control/Volume Support (Ventilator Setting) (VC/VS) Most negative deflection of pressure (cm H2O) Initiation of breath to most negative deflection in pressure—time elapsed (ms) Maximum flow (mL/s) Initiation of breath to maximum flow—time elapsed (ms) Change in pressure from initiation of breath to most negative pressure (cm H2O)
2.37 ⫾ 0.23 115 ⫾ 25 184 ⫾ 37 370 ⫾ 121 3.80 ⫾ 1.04
Pressure Control/Pressure Support (Ventilator Setting) (PC/PS) Most negative deflection of pressure (cm H2O) Initiation of breath to most negative deflection in pressure—time elapsed (ms) Maximum flow (mL/s) Initiation of breath to maximum flow—time elapsed (ms) Change in pressure from initiation of breath to most negative pressure (cm H2O)
2.54 ⫾ 0.79 154 ⫾ 75 199 ⫾ 47 402 ⫾ 72 3.06 ⫾ 1.07
Values are mean ⫾ standard deviation. NS ⫽ not significant.
However, there are currently no data documenting the use of that type of weaning protocol with neonatal and pediatric patients. Automode may be a useful tool in providing the bridge between respiratory therapist-driven protocols and closedloop ventilation. It may provide respiratory therapists with the computer-driven, physiologically interactive equipment necessary to enhance weaning, thus enabling patients the opportunity to discontinue mechanical ventilation expeditiously. This study found that the Automode algorithm did not increase measured WOB. The patient’s WOB depends on pre-trigger and trigger factors such as patient effort to trigger and delay between trigger and response of the ventilator.24 The ⌬P, as an indication of the animal’s effort to trigger, was greatest in the pre-paralysis period. The reason for this difference may be that the animals had not completely recovered from the paralytic agent when the ventilator again began to triggered by the animal. The animals were simply not able to exert as great a negative deflection as before being paralyzed. Having to pharmacologically paralyze the animals to induce apnea was not ideal, since this pharmacologic intervention would not normally be used clinically in this way. Clinically, patients would be on appropriate sedation, not paralytics, during
RESPIRATORY CARE • JANUARY 2001 VOL 46 NO 1
the weaning phase, and any apnea episodes would depend on the disease process. There was no significant difference in time from initiation of the breath to the maximum flow of each breath before or after the induced apnea. The lack of a disparity in time differences indicates that, although the animals were creating less negative pressure to obtain a breath post-paralysis, there was no increase in time necessary to reach maximum flow. The amount of maximum flow decreased during the post-paralysis phase, and this difference was statistically significant for PC/PS and VC/VS. However, there was no difference in peak inspiratory flow among the modes. These decreases in flow may also be due to the paralytic agent. The reason that the maximum flow of PRVC/PS had less of a decrease than the other 2 modes studied is not clear, but may represent a type II error since the p value for PRVC/VS was trending toward statistical significance (p ⫽ 0.173). The flow patterns acquired with the AcqKnowledge Biopac MP-100 information system did show differences before and after the support ventilation. Those differences may be explained by the residual effect of the neuromuscular blocking agent given to the animals to induce apnea and would not be a factor clinically.
33
AUTOMODE
WITH THE
SIEMENS SERVO 300A VENTILATOR
Fig. 5. Patient work of breathing (WOBP), pre-paralysis and post-paralysis measurements for each mode. Each box plot shows the median, quartiles, and extreme values within a category. PRVC/ VS ⫽ pressure-regulated volume control/volume support. PC/PS ⫽ pressure control/pressure support. VC/VS ⫽ volume control/volume support. p value ⬍ 0.05 for comparison of WOBP for PRVC/VS pre-paralysis and post-paralysis phase. p value ⬍ 0.05 for comparison of WOBP for VC/VS VS pre-paralysis and post-paralysis phase. p value ⬍ 0.05 for comparison of WOBP for PC/PS VS pre-paralysis and post-paralysis phase.
A limitation of this study is the necessity of paralytics to induce apnea. The use of this type of drug does not reflect the expected clinical pathway for a patient weaning from mechanical ventilation. But we felt it was the most reproducible method to allow us to induce apnea. The purpose of this study was to test the Automode algorithm and to determine whether it performed as advertised and to look at the impact on WOB when the switch to Automode occurred. Since WOB is most affected in the pre-trigger/ trigger phase by changes in the degree of effort by the patient (most negative deflection of pressure measured at the airway) and the speed of response of the ventilator to the patient’s needs, we focused our attention on those 2 factors. However, WOB and response time of the ventilator did not increase despite the use of a paralytic agent. Further, we measured P0.1 and TI/TTOT. Respiratory drive (P0.1) is a result of diaphragmatic contraction stimulated by neural drive. The clinical importance of this value, if elevated, represents an increase in work expenditure by the animal, or, if decreased, represents blunted respiratory
34
drive. Blunted respiratory drive may be seen, for example, in our experiment with the use of neuromuscular blocking agent. Consequently, a low value for P0.1 may indicate when respiratory drive is blunted, but P0.1 is maintained up to 98% of somatic muscle paralysis.25 In contrast, TI/TTOT is a measure of endurance and is defined as the ratio of the inspiratory time to the total time of the respiratory cycle. If respiratory muscles fatigue, more time is spent in inspiration, so TI/TTOT decreases. Theoretically, this may occur with the effects of neuromuscular blocking agents. However, our results did not show either value to reach a level of clinical importance after paralysis. Another limitation to our study design may have been the dead space associated with the monitoring pneumotachographs and heat and moisture exchanger. The total dead space for our experimental setup was 22.14 mL (BiCore pneumotachograph 11 mL, Hans Rudolph pneumotachograph 8.74 mL, heat and moisture exchanger 2.4 mL). A potential limitation of our study design would be if dead space in our experimental setup caused increased arterial
RESPIRATORY CARE • JANUARY 2001 VOL 46 NO 1
AUTOMODE Table 2.
WITH THE
SIEMENS SERVO 300A VENTILATOR
Mean Values from Measurements of Respiratory Variables
Measurement
Pre-Paralysis
PostParalysis
p Value
Pressure Regulated Volume Control/Volume Support (Ventilator Setting) (PRVC/VS) f (breaths/min) VE (L/min) PIFR (L/min) PEFR (L/min) PIP (cm H2O) WOBV (j/L) P0.1 (cm H2O) T1/TTOT
22 ⫾ 6 2.25 ⫾ 0.96 0.18 ⫾ 0.02 0.13 ⫾ 0.03 12.16 ⫾ 2 0.52 ⫾ 0.20 3.75 ⫾ 1.6 0.37 ⫾ 0.8
20 ⫾ 2 1.89 ⫾ 0.50 0.20 ⫾ 0.04 0.12 ⫾ 0.01 13.24 ⫾ 2 0.87 ⫾ 0.24 3.04 ⫾ 1.6 0.75 ⫾ 1.05
0.463 (NS) 0.345 (NS) 0.173 (NS) 0.463 (NS) 0.075 (NS) 0.046 0.345 (NS) 0.600 (NS)
Volume Control/Volume Support (Ventilator Setting) (VC/VS) f (breaths/min) VE (L/min) PIFR (L/min) PEFR (L/min) PIP (cm H2O) WOBV (j/L) P0.1 (cm H2O) T1/TTOT
22 ⫾ 5 2.26 ⫾ 0.76 0.20 ⫾ 0.08 0.13 ⫾ 0.03 12.19 ⫾ 2 0.50 ⫾ 0.11 4.39 ⫾ 1.4 0.32 ⫾ 0.52
19 ⫾ 4 1.59 ⫾ 0.32 0.25 ⫾ 0.11 0.12 ⫾ 0.01 13.51 ⫾ 3 0.88 ⫾ 0.27 2.54 ⫾ 1.03 0.33 ⫾ 0.82
0.046 0.028 0.600 (NS) 0.116 (NS) 0.116 (NS) 0.028 0.028 0.917 (NS)
Pressure Control/Pressure Support (Ventilator Setting) (PC/PS) f (breaths/min) VE (L/min) PIFR (L/min) PEFR (L/min) PIP (cm H2O) WOBV (j/L) P0.1 (cm H2O) T1/TTOT
22 ⫾ 6 2.24 ⫾ 0.79 0.19 ⫾ 0.03 0.14 ⫾ 0.02 13.77 ⫾ 2 0.78 ⫾ 0.07 3.38 ⫾ 1.42 0.30 ⫾ 0.96
18 ⫾ 6 1.59 ⫾ 0.26 0.25 ⫾ 0.17 0.12 ⫾ 0.02 14.10 ⫾ 2 0.95 ⫾ 0.16 2.7 ⫾ 1.1 0.31 ⫾ 0.72
0.249 (NS) 0.249 (NS) 0.753 (NS) 0.028 0.463 (NS) 0.028 0.173 (NS) 0.753 (NS)
Values are mean ⫾ standard deviation. NS ⫽ not significant f ⫽ respiratory rate VE ⫽ minute ventilation PIFR ⫽ peak inspiratory flow rate PEFR ⫽ peak expiratory flow rate PIP ⫽ peak inspiratory pressure WOBV ⫽ ventilator work of breathing P0.1 ⫽ respiratory drive T1/TTOT ⫽ respiratory time fraction
carbon dioxide tension that increased respiratory drive. However, respiratory drive, as measured by P0.1, was not clinically different before and after paralysis. Also, we have previously measured end-tidal carbon dioxide with the same equipment setup used during this experiment (eg, dead space), and found that end-tidal carbon dioxide was not elevated, and ranged between 38 and 45 mm Hg. The SV300A is designed to meet the needs of neonatal, pediatric, and adult patients. Consequently, it provides distinctive flow ranges for each patient group. The apnea
RESPIRATORY CARE • JANUARY 2001 VOL 46 NO 1
alarm time on the SV300A is predetermined by the patient range selector. For example, in the neonatal mode, the apnea alarm is 10 seconds, but in the pediatric range it is 15 seconds. In contrast, during Automode, if the patient cannot maintain spontaneous breathing, the ventilator shifts back to the control mode after 8 seconds in the pediatric range and 5 seconds in the neonatal range. A potential problem of Automode not reproduced in our study is the possible inability of the ventilator to match the patient’s needs for flow with duration of the predefined time before switching back to the control mode. For example, the patient may need flow rates provided in the pediatric range but cycle time as defined in the neonatal range. Thus, there is a potential for hypercarbia. Offering the clinician the ability to match flow requirements and cycle time would enhance the ability to meet patient needs not already met by the SV300A. The addition of Automode may be an important contribution to the “weaning toolbox” already in place in intensive care units, but further clinical investigation is needed. Conclusions The initial information obtained during this experiment introduces other questions and concerns in the pediatric population, attesting to the need for this study to be done in the intensive care unit. Documentation with the AcqKnowledge Biopac MP-100 and BiCore systems pressure curves, flows patterns, and WOB for patients on Automode could be collected in the clinical setting. The Automode algorithm performed as expected in this animal experiment and did not increase WOB. Our results indicate that patients might benefit from this new closedloop ventilation technology. REFERENCES 1. Tobin MJ. Weaning patients from mechanical ventilation: how to avoid difficulty. Postgrad Med 1991;89(1):171–173, 176–178. 2. Knebel AR. Weaning from mechanical ventilation: current controversies. Heart Lung 1991;20(4):321–331. 3. Pierson DJ. Weaning from mechanical ventilation: why all the confusion? Respir Care 1995;40(3):228–232. 4. Carmack J, Torres A, Anders M, Wilson SW, Holt S, Heulitt MJ. Comparison of inspiratory work of breathing in young lambs during flow-triggered and pressure-triggered ventilation. Respir Care 1995; 40(1):28–34. 5. Heulitt MJ, Torres A, Anders M, Wilson SW, Carmack J. Comparison of total resistive work of breathing in two generations of ventilators in an animal model. Pediatr Pulmonol 1996;22(1):58–66. 6. Heulitt MJ, Holt S, Wilson SW, Rhodes S. Comparison of total work of breathing during pressure support and CPAP between two next generation ventilators in a pediatric animal model (abstract). Crit Care Med 1997;25(1):A102. 7. Nishimura M, Hess D, Kacmarek RM. The response of flow-triggered infant ventilators. Am J Respir Crit Care Med 1995;152(6 Pt 1):1901–1909.
35
AUTOMODE
WITH THE
SIEMENS SERVO 300A VENTILATOR
8. Strickland JH Jr, Hasson JH. A computer-controlled ventilator weaning system. Chest 1991;100(4):1096–1099. 9. Tong DA. Weaning patients from mechanical ventilation: a knowledge-based system approach. Comput Methods Programs Biomed 1991;35(4):267–278. 10. Strickland JH Jr, Hasson JH. A computer-controlled ventilator weaning system: a clinical trial. Chest 1993;103(4):1220–1226. 11. East TD, Bohm SH, Wallace CJ, Clemmer TP, Weaver LK, Orme JF Jr, Morris AH. A successful computerized protocol for clinical management of pressure control inverse ratio ventilation in ARDS patients. Chest 1992;101(3):697–710. 12. Siemens Servo 300/300A ventilator operating manual 8.0/9.0, General Description section pp. 20. 13. Baydur A, Behrakis PK, Zin WA, Jaeger M, Milic-Emili J. A simple method of assessing the validity of the esophageal balloon technique. Am Rev Respir Dis 1982;126(5):788–791. 14. CP-100 Pulmonary monitor: Calculations and measurement manual, pp 4. 15. CP-100 Pulmonary monitor: Calculations and measurement manual, pp 21. 16. CP-100 Pulmonary monitor: Calculations and measurement manual, pp 24–36. 17. Blanch PB, Banner MJ. A new respiratory monitor that enables accurate measurement of work of breathing: a validation study. Respir Care 1994;39(9):897–905.
36
18. Millic-Emili J, Whitelaw WA, Derenne JP. New tests to access lung function: occlusion pressured—a simple measure of the respiratory center’s output. N Engl J Med 1975;293(20):1029–1030. 19. Heulitt MJ, Anders M, Benham D. Acute respiratory distress syndrome in pediatric patients: redirecting therapy to reduce iatrogenic lung injury. Respir Care 1995;40(1):74–85. 20. Lanteri CJ, Sly PD. Changes in respiratory mechanics with age. J Appl Physiol 1993;74(1):369–378. 21. Ranieri VM. Optimization of patient-ventilator interactions: closedloop technology to turn the century (editorial). Intensive Care Med 1997;23(9):936–939. 22. Ely EW, Baker AM, Dunagan DP, Burke HL, Smith AC, Kelly PT, Johnson MM. Effects on the duration of mechanical ventilation of identifying patients capable of breathing spontaneously. N Engl J Med 1996;335(25):1864–1869. 23. Horst HM, Mouro D, Hall-Jenssens RA, Pamukov N. Decrease in ventilation time with a standardized weaning process. Arch Surg 1998;133(5):483–488; discussion 488–489. 24. Ranieri VM, Mascia L, Petruzzelli, Bruno F, Brienza A, Giuliani R. Inspiratory effort and measurement of dynamic intrinsic PEEP I COPD patients: effects of ventilator triggering system. Intenisve Care Med 1995;21(11):896–903. 25. Holle RH, Schoene RB, Pavin EJ. Effect of respiratory muscle weakness on P0.1 induced by partial curarization. J Apl Physiol. 1984 57(4);1150–1157.
RESPIRATORY CARE • JANUARY 2001 VOL 46 NO 1