int. j. remote sensing, 2001, vol. 22, no. 13, 2641 –2647
An evaluation of diVerent bi-spectral spaces for discriminating burned shrub-savannah S. TRIGG*† and S. FLASSE† *P.O. Box 2881, Oshakati, Namibia †Natural Resources Institute, Medway University Campus, Chatham Maritime, Kent ME4 4TB, UK; e-mail: s.p.j.
[email protected] (Received 12 September 2000; in nal form 21 February 2001) Abstract. We report on the numerical separation of burned and unburned vegetation classes using diVerent bi-spectral spaces, based on the analysis of spectroradiometric data collected in situ and convolved to ve spectral bands at red to mid-infrared (MIR) wavelengths. A combination of two MIR bands was found to have strong spectral separation of burned and unburned samples. Using these bands, a spectral index was formulated which is highly sensitive to spectral changes due to burning and relatively insensitive to intrinsic variability. Results have implications for the remote sensing of burned shrub-savannah using bands available on high- and low-spatial resolution sensors, in particular, Landsat TM and MODIS.
1.
Introduction Due to the substantial impacts of biomass burning, one area of remote sensing research is focused on developing algorithms to detect areas burned annually at a global scale (Pereira et al. 1997 ). Reliable remote detection of burned vegetation requires the use of spectral bands that are sensitive to signi cant changes in radiance in response to burning, henceforth called burn signals (Trigg and Flasse 2000 ), which can be isolated form spectral changes from other sources, henceforth called perturbing factors. More simply, the spectral bands used should provide a suYcient ratio of signal (due to burning) to noise (from perturbing factors) to allow reliable detection of burned areas. Perturbing factors include the geometry of illumination and observation, variable atmospheric conditions and intrinsic spectral variation at the surface, such as:
d
d
Variable photosyntheti c states and type of pre-burn vegetation. The spectral re ectance of pre-burn vegetation varies with vegetation type and also changes markedly as vegetation senesces. These factors in uence the spectral contrast between pre-burn vegetation and burned surfaces. For example, greenness measures such as NDVI are of limited use in areas where primarily senescent vegetation burns, as is usually the case in African savannahs (Eva and Lambin 1998 ). Variable properties of combustion residues. Fire of diVerent combustion eYciency produce combustion residues of variable re ectance, from dark-coloure d char Internationa l Journal of Remote Sensing ISSN 0143-116 1 print/ISSN 1366-590 1 online © 2001 Taylor & Francis Ltd http://www.tandf.co.uk/journals DOI: 10.1080/01431160110053185
S. T rigg and S. Flasse
2642
d
d
(incomplete combustion) to brighter ash for eYcient combustion (Stronach and McNaughton 1989). T emporal-spectral evolution of burned surfaces. Surface re ectance increases rapidly after grassland burns, especially in savannah ecosystems (Frederiksen et al. 1986, Trigg and Flasse 2000 ). For example, diVerent thresholds have been necessary for the remote detection of areas burned at the beginning and end of a time period of just 10 days (Eva and Lambin 1998). Surface heterogeneity. Pre- and post-burn surfaces usually comprise a complex mosaic of cover types.
Even within a single ecosystem, perturbing factors account for signi cant spectral variation that aVects the magnitude and residence time (duration), and hence detectability of burn signals. The degree to which burn signals can be isolated from all other sources of spectral variation will largely determine the accuracy of burned area detection. Designing reliable detection algorithms therefore requires knowledge of spectral displacements due to burning and due to perturbing factors, in each ecosystem where res are to be detected remotely. While external factors such as observation and atmospheric conditions have been covered widely in the literature (e.g. Kaufman 1989, Meyer et al. 1995), inherent variations in the burn signal have not. In this Letter, we explore spectral displacements due to burning and perturbing factors, based on the analysis of spectroradiometric data recorded in situ in a burned shrub-savannah . Using diVerent two-band combinations, we rst derive the numerical separation between burned and unburned vegetation classes, both subject to intrinsic perturbing factors at the surface. Having identi ed a strongly discriminating band combination, we present a spectral index designed to isolate spectral changes caused by burning from variability due to perturbing factors, as a way of increasing signal to noise available for detection. 2.
Materials and methods Spectral measurements were made at burned and pre-burn vegetation sites in a shrub-savanna h in East Caprivi, north-east Namibia. Spectra were collected using a vertical-looking, tripod-mounted GER spectroradiometer as described in Trigg and Flasse (2000). The measurements were made under a range of conditions related to intrinsic perturbing factors (table 1) to allow spectral variability resulting from these factors to be characterised. All measurements were made between 9:30 and 11:40 GMT during the period 6 June to 3 July 1999, within Caprivi’s May–November burning season. Re ectance spectra were convolved into Band Equivalent Re ectance (BER) for ve spectral bands at red to mid-infrared wavelengths, as described in Trigg and Flasse Table 1.
Sources of potentially perturbing spectral variability (perturbing factors) inherent in the in situ data.
Sample attributes Pre-burn vegetation type and state: Combustion residues: Spectral-temporal evolution: Spatial integration:
Range measured Senescent grasses Green to senescent shrubs Char, char and ash, ash 0 to 23 days post burn 30 cm FOV, xed
Remote Sensing L etters
2643
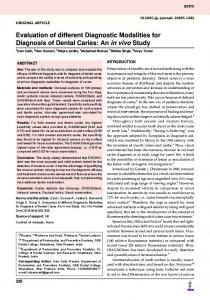
(2000). We used the lter functions of bands 1, 2, 5, 6 and 7 of the MODIS (Moderate Resolution Imaging Spectroradiomete r) instrument, to cover approximatel y the range of channels available (at re ective wavelengths) on sensors commonly used for detecting burned areas (table 2). Blue and green bands were not considered due to their particularly high susceptibility to atmospheric scattering in smoky conditions (Miura et al. 1998), combined with their weak discriminatory power in the case of burned areas (Trigg and Flasse 2000). The JeVries Matusita separability test was applied over diVerent two-band combinations (bi-spectral spaces) to determine which space was most discriminating of the burned areas tested against unburned areas. J–M provides a measure of the distance between two classes in a given set of bands and has a lower bound of zero for identical classes and an upper bound of 1.41 for perfectly separated classes (Niblack 1986). To illustrate how the spectroradiometric data can also be used to explore the eVects of particular perturbing factors, we present J–M values for diVerent types and mixtures of pre-burn vegetation. Three vegetation classes were tested against the burned class, namely: Grass, Shrubs and Both (pooled grass and shrubs tested against the burned class). Having identi ed the bi-spectral space with largest J–M distance between burned and unburned vegetation samples, a scatter plot was used to visualise the con guration of the respective sample clusters within this space. This assisted the formulation of a linear spectral index sensitive to changes caused by burning but relatively insensitive to noise from perturbing factors. 3. Results and discussion 3.1. J–M analysis Figure 1 plots in ascending order the J–M distance between the burned surface class and the three unburned vegetation classes for diVerent bi-spectral spaces. J–M distances show dependence upon the vegetation classes considered and the bands used: d
d
Red-SMIR and SNIR-LNIR spaces: low J–M values indicate considerable overlap between burned and unburned classes and consequently low potential for use in burned area detection algorithms. Red-LNIR, SNIR-SMIR and red-SNIR spaces: Separation is moderate and dependent on the vegetation stratum considered. J–M distances are largest if
Table 2.
MODIS bands and comparable bands from other high repeat frequency sensors. MODIS bands
EM region Red SNIR LNIR SMIR LMIR
Comparable bands on other sensors
Band
Spectral range (mm)
AVHRR
VGT/XS
ATSR-2
TM
1 2 5 6 7
0.620–0.670 0.841–0.876 1.230–1.250 1.628–1.652 2.105–2.155
Yes Yes – – –
Yes Yes – Yes –
Yes Yes – Yes –
Yes Yes – Yes Yes
SNIR: Short wavelength Near-Infrared; LNIR: Long wavelength Near-Infrared; SMIR: Short wavelength Mid-Infrared; LMIR: Long wavelength Mid-Infrared.
S. T rigg and S. Flasse
2644
Figure 1.
d
J–M distance between burn and vegetation classes in diVerent bi-spectral spaces.
shrubs burn, smallest if senescent grass burns and intermediate for pooled grass and shrubs (Both). This suggests limited potential of these spaces in savannah and other ecosystems where primarily senescent grass and shrubs burn. In the remaining spaces (red-LMIR, LNIR-SMIR, SNIR-LMIR, LNIR-LMIR and SMIR-LMIR), J–M distances exceed 1.0 for all vegetation strata, indicating increased potential over the previous spaces. J–M distances are largest for all vegetation strata in SMIR-LMIR space, with values all close to J–M’s upper bound. Furthermore, as both bands are in the mid-infrared, this space should be especially robust against perturbations from even optically thick smoke plumes, which are virtually transparent at MIR wavelengths (Miura et al. 1998 ).
As the SMIR-LMIR space yields near-maximum J–M distances for all vegetation strata, there will be little bene t in using additional bands to separate the burned and unburned samples. However, out of the sensors in table 2, this particular space
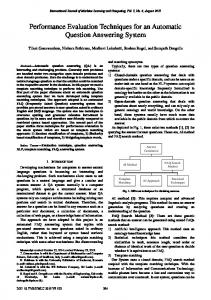
Figure 2. (a) Bi-spectral plot showing an example of a linear index and ideal orientation of displacements in response to burning (perpendicular to index solines) and displacements due to perturbing factors (parallel to isolines). (b) Burn and vegetation classes plotted in the SMIR-LMIR space, where ( ) corresponds to burned areas, (s ) to preburn shrubs and (+) to pre-burn grass. MIRBI isolines have been superimposed and are annotated with index values (in bold type). (c) Schematic representation of spectral variability due to diVerent perturbing factors (vegetation type and photosynthetic state, spectral evolution with time after burn, diVerent combustion residues). The major direction of spread due to these factors aligns approximately orthogonal to the sensitivity direction of the MIRBI index in SMIR-LMIR spectral space.
Remote Sensing L etters
(a)
2645
(b)
(c)
2646
S. T rigg and S. Flasse
is only available on MODIS and TM. For other sensors, further analysis (not reported here) suggests that separation will be increased signi cantly by using additional bands (including thermal bands). The remote detection of burned areas using any of the above spaces may also require extra bands to resolve any spectral confusion with targets not included in this analysis, e.g. water, cloud, cloud-shadow and urban areas. 3.2. A spectral index in SMIR-L MIR space for detecting burned savannah The mathematical formulation of a spectral index for detecting burned vegetation will aim to orientate lines of equal index value (isolines) perpendicular to displacements caused by burning and parallel to displacements from perturbing factors in a discriminating spectral space. Having done this, spectral changes due to burning will yield displacement vectors that cut across isolines and change index values signi cantly, giving the index its required sensitivity to burn signals. Conversely, displacements due to perturbing factors will occur mainly parallel to isolines and therefore have little eVect upon index values (Verstraete and Pinty 1996 ). These requirements are illustrated in gure 2(a). With isolines thus orientated the index becomes a convenient way of maximising the ratio of signal to noise available to algorithms for detecting burned vegetation, and spectral indexes have already been used widely for this purpose (Pereira et al. 1997, Pereirea 1999). Plotting the data in SMIR-LMIR space ( gure 2(b)) reveals that the vegetation (shrub plus grass) and burn clusters are near-linear, near-parallel and distinctly separate. With this con guration, a simple linear index is suYcient to provide isolines similar to those required in gure 2(a). A Mid-Infrared Burn Index (MIRBI) was derived as a perpendicular index based on the slope and intercept of a line tted to the burned samples in SMIR-LMIR space using linear regression: L MIR=0.98SMIR+1.5
(1)
where L MIR is Band Equivalent Re ectance in LMIR and SMIR is Band Equivalent Re ectance in SMIR. The index becomes: MIRBI=10L MIR
9.8SMIR+2
(2)
MIRBI isolines are superimposed on the SMIR-LMIR plot in gure 2(b). It is evident that any changes due to burning will cause displacements that cut across isolines and change index values signi cantly. Furthermore, gure 2(c) shows schematically that the major direction of spread of spectral variability due to perturbing factors (variable photosyntheti c state of pre-burn vegetation, combustion residues and spectral evolution with time after burn) aligns almost parallel to the isolines. The perturbing factors will therefore aVect index values much less than burning. 4.
Conclusion Of the two-band combinations considered, the SMIR-LMIR space yielded the highest (near-maximum) numerical separation of burned and unburned classes in conditions of variable vegetation type, photosyntheti c state, combustion residues and spectral evolution with time after burn. The MIR wavelength range of both
Remote Sensing L etters
2647
bands should also make this space especially robust against the perturbing eVects of scattering by even optically thick smoke plumes. MIRBI was designed in the discriminating SMIR-LMIR space, to provide high sensitivity to spectral changes caused by burning, and relatively low sensitivity to intrinsic variability. It therefore has potential for detecting burned areas using remotely sensed imagery, although this potential must be con rmed using data sensed at coarser spatial resolutions and containing mixed pixels of burned and preburn vegetation. We are currently assessing the use of MIRBI to discriminate burned areas on Landasat TM and MODIS imagery, with encouraging preliminary results. Acknowledgments Thanks are expressed to Andrew Trigg and Martin Hipondoka for their assistance in the eld, to the NERC (Natural Environment Research Council ) Equipment Pool for Field Spectroscopy for loaning the Spectroradiometer and to the European Union Joint Research Centre and the Natural Resources Institute, University of Greenwich for nancial support. References Eva, H., and Lambin, E. F., 1998, Burnt area mapping in Central Africa using ATSR data. International Journal of Remote Sensing, 19, 3473–3497. Frederiksen, P., Langaas, S., and Mbaye, M., 1986, NOAA AVHRR and GIS-based monitoring of re activity in Senegal—a provisional methodology and potential applications. In Fires in the T ropical Biota, Ecological Studies 82, edited by J. G. Goldammer (Berlin: Springer), pp. 400–417. Kaufman, Y. K., 1989, The atmospheric eVects on remote sensing and its corrections. In T heory and Applications of Optical Remote Sensing, edited by G. Asrar (New York: John Wiley and Sons), pp. 336–428. Meyer, D., Verstraete, M., and Pinty, B., 1995, The eVect of surface anisotropy and viewing geometry on the estimation of NDVI from AVHRR. Remote Sensing Reviews, 12, 3–27. Miura, T., Huete, A. R., van Leeuwen, W. J. D., and Didan, K., 1998, Vegetation detection through smoke- lled AVIRIS images: an assessment using MODIS band passes. Journal of Geophysical Research, 103, 32 001–32 011. Niblack, W., 1986, An Introduction to Digital Image Processing (Englewood CliVs: Prentice Hall). Pereirea, J. M. C., 1999, A comparative evaluation of NOAA/AVHRR vegetation indexes for burned surface detection and mapping. IEEE T ransactions on Geoscience and Remote Sensing, 37, 217–226. Pereirea, J. M. C., Chuvieco, E., Beaudoin, A., and Desbois, N., 1997, Remote sensing of burned areas: a review. In A Review of Remote Sensing Methods for the Study of L arge W ildland Fires, edited by E. Chuvieco (Alcara de Hanares: Universidad de Alcala), pp. 127–183. Stronach, N. R. H., and McNaughton, S. J., 1989, Grassland re dynamics in the Serengeti ecosystem, and a potential method of retrospectively estimating re energy. Journal of Applied Ecology, 26, 1025–1033. Trigg, S., and Flasse, S., 2000, Characterising the spectral-temporal response of burned savannah using in situ spectroradiometry and infrared thermometry. International Journal of Remote Sensing, 21, 3161–3168. Verstraete, M., and Pinty, B., 1996, Designing optimal spectral indexes for remote sensing applications. IEEE T ransactions on Geoscience and Remote Sensing, 34, 1254–1265.