OCTOBER 2010
VOSS ET AL.
1747
An Example Crossover Experiment for Testing New Vicarious Calibration Techniques for Satellite Ocean Color Radiometry KENNETH J. VOSS,* SCOTT MCLEAN,1 MARLON LEWIS,1 CAROL JOHNSON,# STEPHANIE FLORA,@ MICHAEL FEINHOLZ,@ MARK YARBROUGH,@ CHARLES TREES,& MIKE TWARDOWSKI,** AND DENNIS CLARK11 * Physics Department, University of Miami, Coral Gables, Florida Dalhousie University, and Satlantic Inc., Halifax, Nova Scotia, Canada # Optical Technology Division, National Institute of Standards and Technology, Gaithersburg, Maryland @ Moss Landing Marine Laboratory, Moss Landing, California & NATO Undersea Research Centre, La Spezia, Italy ** WET Labs, Inc., Narragansett, Rhode Island 11 DBA Marine Optical Consulting, Arnold, Maryland, and the Joint NIST/Utah State University Program in Optical Sensor Calibration, Utah State University Research Foundation, Logan, Utah 1
(Manuscript received 31 August 2009, in final form 3 May 2010) ABSTRACT Vicarious calibration of ocean color satellites involves the use of accurate surface measurements of waterleaving radiance to update and improve the system calibration of ocean color satellite sensors. An experiment was performed to compare a free-fall technique with the established Marine Optical Buoy (MOBY) measurement. It was found in the laboratory that the radiance and irradiance instruments compared well within their estimated uncertainties for various spectral sources. The spectrally averaged differences between the National Institute of Standards and Technology (NIST) values for the sources and the instruments were ,2.5% for the radiance sensors and ,1.5% for the irradiance sensors. In the field, the sensors measuring the above-surface downwelling irradiance performed nearly as well as they had in the laboratory, with an average difference of ,2%. While the water-leaving radiance Lw calculated from each instrument agreed in almost all cases within the combined instrument uncertainties (approximately 7%), there was a relative bias between the two instrument classes/techniques that varied spectrally. The spectrally averaged (400–600 nm) difference between the two instrument classes/techniques was 3.1%. However, the spectral variation resulted in the freefall instruments being 0.2% lower at 450 nm and 5.9% higher at 550 nm. Based on the analysis of one matchup, the bias in Lw was similar to that observed for Lu(1 m) with both systems, indicating the difference did not come from propagating Lu(1 m) to Lw.
1. Introduction Vicarious calibration is the process of combining data from a satellite sensor with combinations of in situ measurements and models to determine the on-orbit calibration factor for the satellite sensor (Clark et al. 1997). For ocean color radiometry, this process provides both an on-orbit system calibration of the satellite instrument and the processing system/algorithms; the final calibration number is therefore specific to that processing system.
Corresponding author address: Kenneth J. Voss, Physics Department, University of Miami, Room 304, 1320 Campo Sano Dr., Coral Gables, FL 33146. E-mail:
[email protected] DOI: 10.1175/2010JTECHO737.1 Ó 2010 American Meteorological Society
Because the ocean reflectance is relatively low compared to the atmospheric reflectance, accurate retrievals of the radiance exiting the ocean surface require very accurate top-of-the-atmosphere radiances. The level of accuracy required exceeds any prelaunch calibration that can be achieved—even neglecting changes that occur during and after launch. Historically, the vicarious calibration process, which provides International System of Units (SI) traceable values for water-leaving spectral radiances, usually occurs in an area of very uniform oceanic optical properties, along with a simple, preferably clean, cloud-free atmosphere. The two major instrumented sites for this effort to date have been the Marine Optical Buoy (MOBY) site off Lanai, Hawaii (Clark et al. 2003), and
1748
JOURNAL OF ATMOSPHERIC AND OCEANIC TECHNOLOGY
the BOUSSOLE (Boue´e pour L’acquisition de Se´ries Optiques a` Long Terme) site for European satellites, in the Mediterranean offshore from Nice, France (Antoine et al. 2008). These continuous data sites are useful, as they can provide the opportunity to accumulate statistics on the water-leaving radiance Lw and can follow any abrupt changes in the satellite sensor. While these two sites can provide continuous data, it would also be advantageous as well to collect data from additional sites covering other regions with different water types and atmospheres for a number of reasons. First, the accumulation of large numbers of vicarious calibration matchups on a global scale reduces the statistical uncertainty in the estimation of the derived calibration factors. Also, because the typical ocean color satellite radiance measurements are done with bandwidths of 20–40 nm, and often with complicated spectral responses, it is useful to have several vicarious calibration sites where the combination of water-leaving radiance and atmospheric signals have a different spectrum. This would illuminate problems due to out-of-band response and atmospheric correction issues. Because of the recent interest in coastal observations, it would also be helpful if these measurements were done in coastal, case II waters, where the ocean optical properties are very different from the Hawaiian clear, blue water site with its maritime atmosphere. However, coastal vicarious calibration introduces issues with optical stability, intrapixel variability in the water-leaving radiance, atmospheric correction models, and other issues that must be carefully considered. The idea behind the Spectral Ocean Radiance Transfer Investigation Experiment (SORTIE) program is to combine very careful measurements of hyperspectral radiometric quantities [in particular, water-leaving radiance, an apparent optical property (AOP)] with measurements of the inherent optical properties (IOPs). Through models, these IOP measurements can be used to compute an estimate of the water-leaving radiance and provide a mapping tool for assessing the variability in the water-leaving radiance field around the site. These maps could provide the basis for evaluating the uncertainties associated with intra- and interpixel variability, which is critical to validating satellite retrievals in the optically complex waters within the coastal zone. This paper addresses the uncertainties associated with the AOP measurement part of this approach. MOBY has been characterized and calibrated at a robust level and represents the highest level of accuracy for water-leaving radiance measurements (Clark et al. 2002). As such, alternative methods for vicarious calibration in other locations should be tested at this site and compared with MOBY. This paper reports on such a comparison between
VOLUME 27
MOBY and that of another family of hyperspectral sensors that was used in SORTIE experiments.
2. Instrument descriptions MOBY uses a custom hyperspectral radiometer that is fiber coupled to upwelling radiance and downwelling irradiance collectors at different depths, and to an abovewater-surface downwelling irradiance collector (Clark et al. 2003). The fibers sequentially illuminate the Marine Optical System (MOS), which contains two spectrographs: one for the blue part of the spectrum (340–640 nm) and one for the red portion of the spectrum (550–955 nm). In operation there are two active MOBY systems that are alternated, approximately quarterly. During these experiments, MOS204 and MOS205 are referred to as even and odd buoy deployments, respectively. The laboratory and the first field experiments, described below, used MOS205 (odd), while the second field experiment used MOS204 (even). An extensive instrument uncertainty budget for MOBY has been reported in Brown et al. (2007) with the uncertainties broken down into individual components, including terms for stability during the MOBY deployments and environmental effects. For laboratory measurements of radiance (neglecting the deployment and environmental effects), the MOBY radiance uncertainties range from 1.21% at 411.8 nm to 0.77% at 665.6 nm. For upwelling spectral radiances in the current MOBY database, the estimated combined standard uncertainty, including the deployment and environmental factors, varies by wavelength between 2.6% (411.8 nm) and 3.4% (546.8 nm), increasing to 12.2% at 665.6 nm. The high value at the red wavelengths is mostly driven by variability in the estimate of the MOBY self-shading bias (Mueller 2007). When corrections are made for self-shading, the estimated combined uncertainty drops to between 2.4% and 3.3%. The instruments used for comparison were the HPL series1 of radiance radiometers and the HSE series of irradiance radiometers (HyperPRO II, Satlantic Inc.), configured to measure hyperspectral downwelling spectral irradiance Ed and hyperspectral upwelling spectral radiance toward the zenith Lu measured at 3.3-nm increments from 350 to 700 nm with a wavelength accuracy of 60.1 nm. Each spectral band was approximately 9 nm wide. The measured values of Ed and Lu as a 1 Identification of commercial equipment to adequately specify the experimental problem does not imply recommendation or endorsement by the National Institute of Standards and Technology (NIST), nor does it imply that the equipment identified is necessarily the best available for the purpose.
OCTOBER 2010
1749
VOSS ET AL.
TABLE 1. Uncertainty budget for Satlantic radiance (HPL 180) sensors. Values given are one s uncertainties relative to the value of the calibration gain at the given wavelength in percent. Uncertainty budget for HPL180 Radiometric standards Wavelength (nm) NIST spectral irradiance Labsphere plaque Transfer to HyperOCR Radiometric transfer Interpolation Reproducibility Wavelength accuracy SLC Thermal responsivity correction Combined standard uncertainty
412.8 1.04 1.8
442.7 0.94 1.8
489.4 0.86 1.8
529.5 0.80 1.8
546.2 0.78 1.8
666.2 0.68 1.8
0.00 0.00 1.61 0.91 0.10 0.03 2.79
0.00 0.00 1.61 0.77 0.09 0.01 2.71
0.00 0.00 1.61 0.56 0.08 0.00 2.63
0.00 0.00 1.56 0.44 0.02 0.02 2.55
0.00 0.00 1.56 0.39 0.04 0.02 2.54
0.00 0.00 1.52 0.19 0.09 0.06 2.46
function of depth and wavelength were obtained using a free-fall profiling radiometer system (Waters et al. 1990). These sensors were characterized and calibrated using NIST standard lamps or integrating sphere sources pre- and postcruise following standard protocols developed in partnership with the National Aeronautics and Space Administration (NASA) and NIST (Hooker et al. 2002; Mueller et al. 2003). Following the same approach as with MOBY, estimated uncertainties for the Satlantic instruments are ,2.8% for radiance and ,2.1% for irradiance (Tables 1 and 2) between 412 and 665 nm. These sensors are not deployed long term and thus have reduced uncertainties due to environmental factors. However, there is an uncertainty associated with the derivation of Lw from the Lu cast. This is estimated to be 1.2%, following the protocol of Zibordi et al. (2004), and was included in the uncertainties for the field measurements. Both the MOBY and Satlantic sensors include corrections because of stray light (Feinholz et al. 2009); these are particularly important when looking at sources with a color spectrum significantly different from the calibration source.
MOBY data are reported at every 0.58 nm with an instrument bandpass of 0.91 nm for the blue spectrograph, while HPL and HSE data are reported every 3.5 nm with an instrument bandpass of 9 nm. When comparing the HPL/HSE data with the MOBY data, the MOBY data are averaged using a 9-nm Gaussian bandwidth at the HPL/HSE wavelengths to account for the difference in bandwidth of these sensors.
3. Laboratory experiments Before the field comparison of MOBY and the HyperPRO sensors, a series of laboratory intercomparisons were performed. These measurements are useful as they form a basis for the field intercomparisons, and if difficulties are experienced in the field, the laboratory measurements can be used to help interpret these differences. In the laboratory, several different colored sources were used. Each of these sources was calibrated at NIST before the laboratory work in Honolulu, Hawaii, and monitored for stability before and after measurements by MOBY, HPL, and HSE. NIST provided
TABLE 2. As in Table 1, but for Satlantic irradiance (HSE 192) sensors. Uncertainty budget for HSE192 Radiometric standards Wavelength (nm) NIST spectral irradiance Labsphere plaque Transfer to HyperOCR Radiometric transfer Interpolation Reproducibility Wavelength accuracy SLC Thermal responsivity correction Combined standard uncertainty
412.8 1.04 0
442.7 0.94 0
489.4 0.86 0
529.5 0.80 0
546.2 0.78 0
666.2 0.68 0
0.00 0.00 1.55 0.91 0.10 0.03 2.08
0.00 0.00 1.10 0.77 0.09 0.01 1.64
0.00 0.00 0.74 0.56 0.08 0.00 1.27
0.00 0.00 0.76 0.44 0.02 0.02 1.19
0.00 0.00 0.72 0.39 0.04 0.02 1.14
0.00 0.00 0.78 0.19 0.09 0.06 1.06
1750
JOURNAL OF ATMOSPHERIC AND OCEANIC TECHNOLOGY
estimates of the spectral radiance of these sources to compare with the measurements by the two sensors. This performance measure was independent of the calibration/ characterization of the respective instruments; neither of these measurements were used in the calibration of the sensors, nor were they used to change the results of the sensors. For the laboratory intercomparisons of radiance, an Optronics Laboratories OL420 was used as the radiance source. This instrument was calibrated at NIST just prior to this experiment on the Facility for Spectroradiometric Calibrations (FASCAL; Walker et al. 1987), and the NIST Visible Transfer Radiometer (VXR) was used at NIST after this calibration. The stability of the VXR was assessed by comparing measurements from a traveling radiance sphere source and a NIST laboratory sphere, before and after the SORTIE laboratory experiment. At some point between shipping from NIST to Hawaii, the OL420 source changed its radiance. Measurements by the VXR were used to derive correction factors for the radiance levels for this experiment, with the correction factors varying from 0.7% at 412 nm to 0.3% at 661 nm. Uncertainty in the open (e.g., unfiltered) values of the OL420 radiance, after correction, ranged from 1.15% at 400 nm to 0.8% at 600 nm. For the OL420 with a BG28 filter (to roughly simulate clear seawater), the total uncertainty is approximately 1.5% at 400 nm and 2.1% at 500 nm. For the irradiance source, NIST FEL lamps, the total uncertainty for the MOBY downwelling irradiance above the surface Es channel was estimated following the approach described in Brown et al. (2007). The combined standard uncertainty is estimated to be about 2.5%; however, there are components such as the effect of in situ fouling during a deployment that are solely based on subjective judgment. If only the radiometric scale and the transfer to MOBY are considered (as appropriate for the laboratory comparison), the combined standard uncertainty is 1.4% at 412 nm and 1.1% for the other ocean color bands. Compared to the Lu uncertainty budget, there are additional components for the spectral irradiance of the source, because the FEL lamps are operated with different power supplies in use during the NIST calibration. Also, at the MOBY site, lamps are operated in an enclosed housing designed to reduce scattered light, which is a problem for all irradiance calibrations. For the laboratory comparison with the HSE, this housing worked to our advantage, as the HSE and MOBY irradiance collectors are similar in design. Therefore, no corrections were necessary for differences in collection area of either HSE or MOBY compared to the conditions corresponding to the lamp calibration at NIST. The mechanical reference plane that determines
VOLUME 27
FIG. 1. Laboratory measurements of the Optronics OL420 radiance source by the MOBY arms and the HPL180 and HPL191. (a) Measured radiance values by detectors. (b) Percent difference of respective instruments values and NIST-reported radiances for these sources. Symbols are the same in (a) and (b). Dashed and dotted lines are combined uncertainties of NIST values and specific instrument (MOBY and HPL, respectively). The k 5 2 uncertainties are plotted, which correspond to the 95% confidence level.
the lamp-to-collector distance for the HSE was also similar to the MOBY Es, so there was no bias introduced by a difference in this distance setting. In Figs. 1 and 2 the uncertainties, at the k 5 2 level, are shown for both the MOBY and HPL sensors. These uncertainties are a combination of the estimated uncertainties of the source along with the uncertainties of the specific instrument. In Fig. 3 the uncertainties are also shown at the k 5 2 level, combining the uncertainties of the MOBY or HSE sensor and the estimated source uncertainties.
Results 1) RADIANCE SENSORS The first comparison will be between two of the three MOBY arms, two HPL radiance sensors (HPL180 and HPL191), and the NIST OL420 radiance light source. This is very similar to the calibration source used for the primary calibration of both the MOBY sensor and the
OCTOBER 2010
VOSS ET AL.
FIG. 2. As in Fig. 1, but with a BG28 filter to simulate a clear, blue water ocean spectral radiance, by the MOBY arms and the HPL180 and HPL191.
HPL sensors. Figure 1 shows the result of this comparison. As expected, the two sensors perform within the combined uncertainty of the source and detectors. The maximum deviation from the NIST values are 3.4%, 2.8%, 2.7%, and 4.0% for the MOBY top arm, MOBY mid-arm, HPL191, and HPL180, respectively. The spectrally averaged differences are 0.85% 6 0.92%, 20.02% 6 0.84%, 1.80% 6 0.55%, and 0.05% 6 0.64% for the MOBY top arm, MOBY mid-arm, HPL180, and HPL191, respectively. Also note that there is a large correlation between the MOBY and HPL180 measurements at the finescale. Thus, some of the small-scale structure could be due to wavelength interpolation of the NIST values. To look at a more difficult case, a light source composed of the OL420 with a Schott BG28 glass filter was used to produce a colored light source, as shown in Fig. 2. As can be seen in these figures, all of the instruments’ responses are very similar. For the range from 400 to 500 nm, the average percent difference between NIST values and the measured values are 20.60% 6 1.04%, 21.05% 6 0.99%, 20.95% 6 0.43%, and 22.5% 6 0.54% for the MOBY top arm, MOBY mid-arm, HPL180, and HPL191, respectively. In the region above 500 nm, the
1751
FIG. 3. As in Fig. 1, but of two FEL irradiance lamps by the MOBY surface irradiance sensor and the HSE irradiance detector.
errors are highly correlated, meaning that the interpolation of the NIST values (NIST values were reported at 10-nm increments and were interpolated using a cubic spline interpolation) may be an issue. This is also where the radiance is very low, so small differences are large in terms of the percent difference. Throughout most of the spectral range, the values from the MOBY and HPL180 are very close (within 1%) with this case, where, because of the narrower band of illumination and the spectral differences between this and the primary blackbody calibration source, the stray light correction (SLC) of each instrument can become important.
2) IRRADIANCE SENSORS At the MOBY field site there was no a straightforward way to produce colored irradiance sources, so the analysis here on irradiance collectors is restricted to open (unfiltered) FEL lamps, effectively a blackbody source. As shown in Fig. 3 HSE192 system has a spectrally smooth difference between the NIST value and its measurement, while the MOBY irradiance is fairly flat, but exhibits a 2% discrepancy between the two spectrographs in the system at 600 nm. This jump is indicative of problems with the SLC based on characterization
1752
JOURNAL OF ATMOSPHERIC AND OCEANIC TECHNOLOGY
VOLUME 27
TABLE 3. Station dates, location, and measurement time for each instrument, and solar geometry during MOBY measurement. Solar azimuth angle is defined such that when the sun and MOBY arm are aligned, the angle corresponds to 1808; when the MOBY structure is between the MOBY arm and the sun, the angle corresponds to 08. Distance of Actual HPL MOBY time HPL HPL HPL cast to measurement Solar zenith Solar azimuth (UTC) instrument cast MOBY (n mi) time (UTC) angle (8) angle (8)
Date
MOBY location
3 Mar 2007
20849.469N, 157811.829W
2225
HPL191 HPL191 HPL180
SAA SAB SBA
0.94 1.19 0.94
2239 2248 2239
27.8
55
4 Mar 2007
20849.279N, 157812.049W
2125
HPL191 HPL180
SAB SBB
1.86 1.86
2134 2134
32.9
60
5 Mar 2007
20849.299N, 157811.979W
0025
HPL191 HPL180
SAF SBF
0.42 0.42
0025 0025
37.3
130
23 Jun 2008 20849.529N, 157811.919W
2245
HPL180 HPL252 HPL180 HPL252
SBC SCB SBD SCC
2.42 2.42 2.13 2.13
2232 2232 2247 2247
4.1
150
26 Jun 2008 20849.589N, 157811.089W
2045
HPL191 HPL180 HPL252 HPL191 HPL252 HPL191 HPL180
SAB SBB SCB SAC SCC SAD SBD
0.36 0.36 0.36 0.36 0.36 0.36 0.36
2032 2032 2032 2045 2045 2055 2055
24.8
100
measurements made in 2002, and a more recent remeasurement of this specific MOBY instrument resulted in a revised SLC and better matching. However, the original SLC is used in this paper to be consistent with the current MOBY database. Both systems showed a similar bias between their measurements and the NIST values. For F431 the average bias over the range 400–900 nm was 21.07% 6 0.49% and 21.18% 6 0.60% for the HSE192 and MOBY, respectively. For F432 the average bias over the range of 400–900 nm was 21.25% 6 0.55% and 21.06% 6 0.86% for the HSE192 and MOBY, respectively. The average bias for MOBY and HSE192 agreed for each lamp to within 0.2%; however, both pointed to a bias of between 21.0% and 1.5% between their measurements and the NIST values for these lamps. Throughout the range of 400–900 nm, the maximum difference between the two systems was 1.4%. Both the bias with respect to the NIST values and the bias between the systems are within the estimated uncertainties.
4. Field experiments The crossover experiments were performed at the MOBY Lanai site during two field missions. We tried to make the measurements with the Satlantic instruments coincident in time and space with the MOBY acquisition
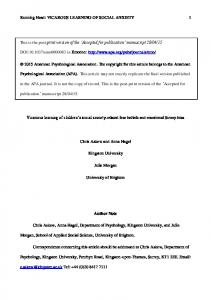
time, since these times are predetermined by the MOBY program. Actual acquisition times and locations will be slightly different, as the instrument casts take finite time, and the ship can only come within a certain distance of the buoy for safety reasons. Table 3 has the actual positions and times of the acquisitions. The MOBY site is an area in which the water properties are reasonably homogeneous. To illustrate this we calculated the ratio bbt(460)/[at(460) 1 bbt(460)], shown in Fig. 4, where bbt(460) is the total backscattering at 460 nm and at(460) is the total absorption at 460 nm. This ratio was depthweighted according to the first derivative of diffuse attenuation for remote sensing comparisons (Zaneveld et al. 2005) and is proportional to surface reflectance. Data were obtained directly after the radiometry comparisons on 3 March 2007 by a towed instrument measuring IOPs, mapped with respect to latitude and longitude. The location of MOBY is in the center of the image (crossed 3 times during the tow). Results generally show steadily decreasing values during the tow, reaching a minimum of about 4% below the values at the beginning of the tow. Because the ship passed near MOBY several times during the 5.8-h tow, the steadily decreasing values appear to be a regionwide temporal effect and not spatial patchiness. Decreasing values are driven by increasing attenuation through the afternoon, consistent with diurnal variability in optical properties as observed previously
OCTOBER 2010
VOSS ET AL.
FIG. 4. The equation hbbt460/(at460 1 bbt460)i, mapped with respect to latitude and longitude. The location of MOBY is marked with a black circle. Units for latitude and longitude are decimal degrees. Results show patchiness with a standard deviation less than 2% of the mean value. There is also a trend of steadily decreasing values during the tow, reaching a minimum of about 4% less than values at the beginning of the tow.
in open ocean waters (Siegel et al. 1989; Cullen et al. 1992; Gardner et al. 1995; Claustre et al. 1999). Based on these data, one would expect the variability due to water optical properties to be less than 5% in the blue wavelengths. This variability would decrease toward the red wavelengths (600 nm) where the properties of pure water become a significantly larger component of the total optical properties. For each of the matchups, we will look at the average and standard deviation of the difference in percent between the HPL- and MOBY-derived values of the waterleaving radiance, Lw [200 3 (HPL 2 MOBY)/(HPL 1 MOBY)], and the maximum and minimum difference over the range from 400 to 550 nm. To determine these factors, the MOBY data were averaged to match the Satlantic bandpass and center wavelengths as described earlier. The Lw must be estimated by propagating measurements of the upwelling radiance at a depth below the surface up to just below the surface [Lu(2)] and then propagating this radiance through the air–sea interface. Each instrument has a slightly different method of determining Lu(2), driven in part by the instrument specifics. MOBY derives two types of Lw—Lw1 and Lw7—that are differentiated by how the Lu(2) value is generated. MOBY has measurement arms at 1, 5, and 9 m. For Lw1 the Lu measurements at 1 and 5 m are used to derive an upwelling radiance attenuation coefficient (KLu), which is then used to propagate the radiance at 1 m to form
1753
Lu(2). In Lw7 the Lu measurements at 5 and 9 m are used to derive KLu, which is used to propagate the Lu at 5 m to the surface. We have used Lw1 throughout this paper. The HPL instruments were processed using the multicast processing method to derive Lu (Zaneveld et al. 2001; Zibordi et al. 2004). In this method, multiple shallow casts are combined to increase the density of data near the surface. Each datum is normalized to a surface Es value, using its corresponding Ed value, so that all measurements are comparable. The data are filtered for zero or negative values, in the case that the measurement is very close to the dark value. The data are then regressed (log of radiance versus depth), and data are refiltered at 610 standard deviations from the regression line to remove outliers. The regression is then repeated. For each wavelength the regression KLu value is checked to see if it is lower than Kw (pure water from Morel 2001); if so, KLu for that wavelength is set to (Kw 2 0.001). At this point the optical depth is found (1/KLu), and the regression is recalculated using data from the surface to 1.5 optical depths or from the bottom of the cast, whichever is smaller. During the SORTIE cruises, the casts were done to 10 m. The Lu(2) value is given as the zero intercept of this final regression and KLu is also determined, but not routinely saved by the processing system. The HPL measurements were normalized to the time of the MOBY measurement using the surface Es value. In the case when the measurement time of MOBY took place during the period of the HPL casts, this Es value was found through linear interpolation of the HSE irradiance measurements. When the MOBY measurement took place outside of this time, Es was estimated by a linear extrapolation of the HSE measurements. The magnitude of this correction varies with time of day for the same time difference between the HPL and MOBY, with the minimum correction around solar noon (approximately 2240 UTC during the first field experiment and 2230 UTC during the second). This factor can be up to a 3% correction for a 10-min difference in measurement times, largest for the measurements either earlier or later than solar noon. The estimated uncertainty in this correction is 0.8%. The subsurface radiance Lu(2) must then be propagated through the surface. Both groups use the theoretical Fresnel coefficient for the air–water interface, thus the same transmission factor for the radiance through the water surface. On Figs. 5b–9b, the estimated combined uncertainty is shown. This is the combined uncertainty of both instruments, including environmental factors, as discussed above.
1754
JOURNAL OF ATMOSPHERIC AND OCEANIC TECHNOLOGY
FIG. 5. Matchup of MOBY and HPL191 and HPL180 systems on 3 Mar 2007. All HPL measurements are renormalized to the MOBY measurement time. Agreement with HPL191 is very good, while HPL180 is biased high. Dashed lines are the k 5 2 uncertainties for both instruments combined, which correspond to the 95% confidence level. In (b) the open symbols are the results after performing a shadow correction on the MOBY data only.
a. Results The first crossover experiment took place in March 2007. This consisted of two Satlantic HyperPRO II radiance sensors—HPL180 and HPL191—along with the odd series MOBY. There were three sets of crossovers during this period. The detailed information on the matchups is shown in Table 3. The agreement between the two measurement systems was generally within the expected uncertainty; however, it was not as close as was found in the laboratory. For the first matchup, at 2225 UTC 3 March 2007 (note: time listed is MOBY collection time), HPL191 agreed with the MOBY measurement, while the HPL180 measurement was higher (Figs. 5a and 5b). The SAA sample and SBA sample were taken at the same time; however, they have a 5.5% spectrally averaged difference (Fig. 5b). In this nomenclature, the second letter specifies the instrument used (A 5 HPL191, B 5 HPL180, C 5 HPL252),
VOLUME 27
FIG. 6. Matchup of MOBY and HPL191 and 180 systems on 4 Mar 2007. Both HPL systems are slightly higher than MOBY. Lines and symbols as in Fig. 5.
while the third letter specifies the station. The SAA and SBA stations were 0.94 n mi from the MOBY buoy, while the SAB sample was 1.19 n mi from MOBY. The second matchup was at 2125 UTC 4 March 2007 and shown in Fig. 6. Here both the HPL180 and HPL191 were biased high relative to MOBY. These HPL casts were done approximately 1.9 n mi from the MOBY buoy; however, as shown, in general this region does not have strong gradients in the optical properties. The two HPL instruments were 4% and 7.3% higher than the MOBY-measured radiance and were 3.3% different from each other (when the two measurements were done simultaneously, in the same location, and with the same techniques). The last matchup from this series was at 0025 UTC 5 March 2007 and shown in Fig. 7. Once again the HPL instruments were biased high relative to the MOBY buoy with an average percent difference of 6.5% (HPL191) and 5.6% (HPL180). These casts were done very close to the MOBY buoy, 0.42 n mi, and at the same time as MOBY, so no renormalization was required. In this case the two HPL measurements agreed with each other very well (within 0.9%).
OCTOBER 2010
VOSS ET AL.
1755
FIG. 7. Matchup of MOBY and HPL191 and 180 systems on 5 Mar 2007. Lines and symbols as in Fig. 5.
FIG. 8. Matchup of MOBY and HPL252 and 180 systems on 23 Jun 2008. Lines and symbols as in Fig. 5.
The second crossover experiment took place in June 2008. As mentioned above, this crossover used the even series MOBY instrument. In this experiment three Satlantic HyperPRO II radiance sensors (HPL) were profiled simultaneously. Detailed information on the matchups are shown in Table 3 and provided two more successful matchups. The first matchup was at 2245 UTC 23 June 2008 and is shown in Fig. 8. The data were taken between 2.1 and 2.4 n mi away from the MOBY buoy. The later casts (SBD and SCC) were taken very close in time with the MOBY, and these two casts had the best agreement with the MOBY measurement, with a spectrally averaged difference of 1.8% and 0.9%. The agreement with the other two casts is also good, at 2.4% and 4.2% for SBC and SCB, respectively. If anything, the four HPL measurements are slightly high relative to MOBY. The second matchup during this experiment was at 2045 UTC 26 June 2008 and is shown in Fig. 9. There were six casts acquired that matched up with the MOBY measurement period. All of these measurements were listed as being performed within 0.36 n mi of MOBY. The average percent difference between the HPL measurements and the MOBY buoy was between 1.9% and
21.0%. The spread between the individual HPL measurements was on the order of 3%. Interestingly, while the matchup on 23 June had the HPL slightly higher than MOBY in the range from 400 to 475 nm, this matchup showed the measurements being slightly lower. In Figs. 5b–9b we also show the matchup with a shadow correction derived from Mueller (2007). Mueller found through Monte Carlo modeling, with estimates of the water optical properties at the MOBY site, that the MOBY shadowing effects were most strongly affected by relative azimuthal angles between the MOBY arms and the solar position than with any other variable. The solar azimuthal angles can be determined by the location and time of day; the MOBY orientation is measured with a compass on the MOBY buoy. The relative azimuthal angle is shown in Table 3 and is defined such that 08 corresponds to having the sun on the opposite side of the main buoy structure from the measurement arms. For azimuthal angles between 458 and 1808 (the azimuthal range experience during these matchups), the azimuthal variations of the shadowing corrections varied by less than 1% at a specific wavelength. For high solar zenith angles, the correction increases due to the shadowing by the arm and collector itself. Using Fig. 6.3c in Mueller
1756
JOURNAL OF ATMOSPHERIC AND OCEANIC TECHNOLOGY
VOLUME 27
FIG. 10. Matchup of MOBY Es and HSE192 on 5 Marc 2007. Line as in Fig. 5.
of the HSE and MOBY sensors; however, they are smaller than the radiance uncertainties because of fewer environmental factors. But the measurement falls easily within the estimated uncertainty.
b. Discussion of results FIG. 9. Matchup of MOBY and HPL252 and 180 systems on 26 Jun 2008. Lines and symbols as in Fig. 5.
(2007), we estimated the shadowing correction as a function of wavelength and solar geometry. The corrections ranged from 1% to 1.8% at 400 nm to 6.5% to 15% at 600 nm. The strongest corrections were performed for the 23 June 2008 measurement, which had the highest solar zenith angle. No corrections were made to the profiling radiometer. Applying this correction lowered the percent difference between the HPL and MOBY systems, which, since the HPL measurement tended to be higher, improved the agreement. We also analyzed the Es measured with MOBY (and the same spectrometer measuring the upwelling radiance) and the HSE192 detector for the 0025 UTC 5 March 2007 matchup. There was no correction made for the possible tilt of the MOBY or HSE192 cosine collector; however, the sea state was ,1 m at this time. As can be seen in Fig. 10, the matchup between these two sensors is very good, with the average difference of 22.0%, and the maximum being 20.1% and the minimum being 23.0%. There was a difference of approximately 6% in the HPL and MOBY Lw matchup at this time. The Es spectral agreement is actually slightly better than it was in the laboratory, as the step discontinuity in the MOBY measurement is not evident. The uncertainties shown are once again the combined uncertainties
There are some features in common between the two experiments and some differences. In the first experiment, the difference graphs show similar spectral behavior, with a minimum near 450 nm and increasing in either direction. For the laboratory comparisons with the open source (lamp spectra), the two types of instruments (MOBY top/mid arm and HPL180/191) have a slightly different behavior: at wavelengths less than 450 nm, MOBY measures a higher radiance than the NIST source and HPL instruments. When viewing the colored source, below 450 nm MOBY and HPL180 are very close, while above 450 nm a very slight trend starts to develop, with the HPL instrument slightly higher than the MOBY measurement, relative to the NIST values for this source. The radiance measurements that result from a colored source like this, and Lw in the vicinity of Lanai, require careful characterization of the instrument stray light. If the similarities between the spectral response of the two matchup days during the second experiment are also taken into consideration (where a separate MOBY buoy with a different SLC was used), it points to a slight difference in how the SLC is working between the MOBY instrument and the HPL class of instrument. After the first experiment, the SLC on the MOBY instrument was remeasured and a modified SLC was produced. This is not in the current MOBY public dataset, so it is not shown; spectral differences between the MOBY and the HPLs, however, changed significantly
OCTOBER 2010
VOSS ET AL.
at the shorter wavelengths (;5% at 412 nm) with the application of the newer SLC. Looking at the first matchup experiment, it can be seen that even with the same type of instrument, in the same location, with simultaneous data, in very good to ideal conditions, there can be a 3%–6% variation in the Lw produced. We observed a bias in the Lw, with the HPL on average slightly higher than the MOBY; therefore, we investigated other causes that might be responsible for the differences in the in-water measurements. As mentioned earlier, to produce an estimate of Lw for both types of instruments requires propagating subsurface observations up to just below the surface and then transmitting the radiance through the surface. In both cases an immersion coefficient must also be applied to account for the use of the radiance detector in the water versus the air. So, there are three factors that must be used in the estimation of Lw based on subsurface observations: the instrument immersion coefficient, the radiance attenuation (which must be measured in some manner) from the measurement depth to the surface, and the radiance transmission through the surface. Both instruments use the theoretical Fresnel coefficient for the air–water interface, thus the same transmission factor for the radiance through the water surface, so this cannot account for the difference. In addition, they also use similar immersion factors, computed from the refractive index of glass and seawater, as the instrument designs are also similar. Validation of the theory would be wise, as subtle effects such as possible internal reflections are not included in the modeled results (Zibordi and Darecki 2006). This leaves the radiance attenuation as a factor that is determined by each group independently from their dataset. To investigate this, the KLu used in cast SBF (HPL180) at 0025 UTC 5 March 2007 and the MOBY-retrieved KLu for this same time was checked. The maximum difference between these two values was 0.005 m21, which would correspond to only 0.5% discrepancy between the two measurements alone based on a propagation distance of 1 m. The MOBY processing generates two Lws: Lw1 and Lw7. We used Lw1 throughout this paper. For this dataset, Lw7, which effectively uses a KLu between 5 and 9 m, is consistently lower than Lw1. In the blue wavelengths, this is probably an effect of a varying radiance distribution near the surface, and Lw7 is approximately 10% lower than Lw1. In the red wavelengths, the effect of Raman scattering becomes very important for the 9-m Lu measurement, hence KLu becomes much smaller than it should be, and Lw7 decreases significantly compared to Lw1. The magnitude of the change in radiance over the upper meter is approximately equal to the attenuation coefficient KLu and is shown in Fig. 10.
1757
FIG. 11. Comparison of HPL180 and MOBY Lw and HPL180 and MOBY Lu measured at 1 m on 5 Mar 2007. In each case, percent difference is HPL 2 MOBY. Also shown is exp(KLu), derived from the calculated KLu, which propagates the radiance from 1 m to Lu(2).
Working backward the Lu measured at 1-m depth from the top arm of the MOBY and that measured with the HPL180 during the same cast, SBF, can be reviewed. The HPL180 result is used by fitting a line to the logtransformed radiance values for depths between 0.8 and 1.2 m around the measurement depth and then using this line to determine the upwelling radiance at 1 m. The difference between HPL180 and MOBY Lu(1 m) is shown in the Fig. 11. On top of this, the same values for the Lw difference between HPL180 and MOBY are repeated. As can be seen, much of the difference in Lw originates right at the measurement depth for MOBY, thus much of the difference originates directly from the Lu measurement itself. Another possibility involves an error or bias in the depth measurement of either sensor. This would cause an error proportional to the factor [exp(KLu) 2 1] shown in Fig. 11. MOBY uses a constant measurement depth determined by the physical dimensions of the buoy and arm to determine the propagation distance from the nominal 1-m sensor to the surface. MOBY will follow longer period waves; however, many shorter waves may go by during the course of the 30-s integration time used for Lu(1 m). Because of the nonlinear relationship between water depth and attenuation, a sinusoidal wave passing above a fixed MOBY arm will cause slightly less attenuation than estimated with the sensor at a fixed average depth. This would cause MOBY to slightly over estimate Lw (which is inconsistent with the results found). While the HyperPRO data reduction uses the absolute measurement depth for each measurement point, the HyperPRO packages are tarred before each cast to
1758
JOURNAL OF ATMOSPHERIC AND OCEANIC TECHNOLOGY
account for changes in atmospheric pressure and sensor drift, which would result in an offset. A positive depth offset such as this would result in a spectral shape to the percent differences similar to that in Figs. 5–9. However, there is no reason to think that the resulting bias would exceed ’0.5 m, which would not be enough to account for the total spectral difference shown in Figs. 5b–9b.
5. Conclusions We found that in laboratory comparisons, the radiance and irradiance instruments compare within their estimated uncertainties for various spectral sources. The spectrally averaged differences between the NIST values for the sources and the instruments were ,2.5% for the radiance sensors and ,1.5% for the irradiance sensors. In the field, the sensors measuring Es performed as well as they had in the laboratory, with an average difference of ,2%. While the water-leaving radiance Lw calculated from each instrument agreed in almost all cases within the combined instrument uncertainties (approximately 7%), there was a relative bias between the two instrument classes/techniques that varied spectrally. The spectrally averaged (400–600 nm) difference between the two instrument classes/techniques was 3.1%. However, the spectral variation resulted in the free-fall instruments being 0.2% lower at 450 nm and 5.9% higher at 550 nm. Based on the analysis of one matchup, the bias in the Lw was similar to that observed for Lu(1 m) with both systems, indicating the difference did not come from propagating Lu(1 m) to Lw. Factors such as the attenuation coefficient and interface transmission coefficients were ruled out, both because the same factors were used for both types of systems and because the difference appeared at the measurement of Lu(1 m). The immersion coefficient each instrument used was similar, but this was calculated from physical properties. While there could be differences due to internal scattering in the instruments (Zibordi and Darecki 2006), they would not show the spectral features observed. Additional factors, which include instrument selfshadowing above that predicted by models (Mueller 2007) and changes in the pressure offset, could account for some of the difference between the measurements. However, nothing conclusive was found. At this time it is important to stress that the field measurements agreed within the estimated instrument uncertainties in almost all cases. While the differences deserve further investigation, the two approaches provided a comparable level of accuracy in the derivation
VOLUME 27
of water-leaving radiances for comparison with satellite observations of the sea surface. In terms of vicarious calibration, it is important to point out at least two issues. First, the variations between two copies of the same sensor, using the same data reduction processes, measured at the same time and within tens of meters of the same location, show how much variability can occur even in these clear water sites. Second, the variation between different and similar sensing systems/protocols shows that it is important for multiple matchups (obtained through time series or extended cruises) to be used to set the vicarious calibration level in satellites because of this environmental variability. Single matchups are not sufficient to achieve the measurement goals of ocean color satellites. Acknowledgments. This work was supported by NASA under Grants NNX06AD44G (KV), NNX06AH14G (CT), NASA to NOAA NNG04HK33I (BCJ), and NOAA to NIST NA05AANEG0013 (BCJ). Dennis Clark was supported by Space Dynamics Laboratory, Logan, Utah, under a Joint NIST/Utah State University Program in Optical Sensor Calibration. We also would like to thank Dr. James Mueller for his help in interpretation and using his shadowing correction for the MOBY instrument.
REFERENCES Antoine, D. A., P. Guevel, J.-F. Deste´, G. Be´cu, F. Louis, A. J. Scott, and P. Bardey, 2008: The ‘‘BOUSSOLE’’ buoy—A new transparent-to-swell taut mooring dedicated to marine optics: Design, tests, and performance at sea. J. Atmos. Oceanic Technol., 25, 968–989. Brown, S. W., and Coauthors, 2007: The Marine Optical Buoy (MOBY) radiometric calibration and uncertainty budget for ocean color satellite sensor vicarious calibration. Sensors, Systems, Next-Generation Satellites XI, R. Meynart et al., Eds., International Society for Optical Engineering (SPIE Proceedings, Vol. 6744), 10.1117/12.737400. Clark, D. K., H. R. Gordon, K. J. Voss, Y. Ge, W. Broenkow, and C. C. Trees, 1997: Validation of atmospheric correction over the oceans. J. Geophys. Res., 102, 17 209–17 217. ——, M. E. Feinholz, M. A. Yarbrough, B. C. Johnson, S. W. Brown, Y. S. Kim, and R. A. Barnes, 2002: Overview of the radiometric calibration of MOBY. Earth Observing Systems VI, W. L. Barnes, Ed., International Society for Optical Engineering (SPIE Proceedings, Vol. 4484), 64–76. ——, and Coauthors, 2003: MOBY, a radiometric buoy for performance monitoring and vicarious calibration of satellite ocean color sensors: Measurement and data analysis protocols. Ocean optics protocols for satellite ocean color sensor validation, Revision 4, NASA Tech. Memo. NASA/TM-2003-211621/ Rev4-Vol.VI, J. L. Mueller, G. S. Fargion, and C. R. McClain, Eds., NASA, Goddard Space Flight Center, 3–34. Claustre, H., A. Morel, M. Babin, C. Cailliau, D. Marie, J.-C. Marty, and D. Vaulot, 1999: Variability in particle attenuation and
OCTOBER 2010
VOSS ET AL.
stimulated fluorescence in the tropical and equatorial Pacific: Scales, patterns and some biogeochemical implications. J. Geophys. Res., 104, 3401–3422. Cullen, J. J., M. R. Lewis, C. O. Davis, and R. T. Barber, 1992: Photosynthetic characteristics and estimated growth rates indicate grazing is the proximate control of primary production in the equatorial Pacific. J. Geophys. Res., 97, 639–654. Feinholz, M. E., S. J. Flora, M. A. Yarbrough, K. R. Lykke, S. W. Brown, B. C. Johnson, and D. K. Clark, 2009: Stray light correction of the Marine Optical System. J. Atmos. Oceanic Technol., 26, 57–73. Gardner, W. D., S. P. Chung, M. J. Richardson, and I. D. Walsh, 1995: The oceanic mixed-layer pump. Deep-Sea Res. II, 42, 757–775. Hooker, S. B., S. McLean, J. Sherman, M. Small, G. Lazin, G. Zibordi, and J. W. Brown, 2002: The Seventh SeaWiFS Intercalibration Round-Robin Experiment (SIRREX-7), March 1999. NASA Tech. Memo. NASA/TM-2002-206892/VOL17, NASA Goddard Space Flight Center, 78 pp. Morel, A., and S. Maritorena, 2001: Bio-optical properties of oceanic waters: A reappraisal. J. Geophys. Res., 106, 7163–7180. Mueller, J., 2007: Self-shading corrections for MOBY upwelling radiance measurements. Final Rep., NOAA Grant NA04NESS4400007, 33 pp. [Available online at http://moby. mlml.calstate.edu/sites/default/files/2007_NOAA_Self-Shading% 20Corrections%20for%20MOBY.pdf.]
1759
——, and Coauthors, 2003: Ocean optics protocols for satellite ocean color sensor validation. NASA Tech. Memo. NASATM-2003-21621/Rev4-Vol II, 63 pp. Siegel, D. A., T. D. Dickey, L. Washburn, M. K. Hamilton, and B. G. Mitchell, 1989: Optical determination of particulate abundance and production variations in the oligotrophic ocean. Deep-Sea Res., 36, 211–222. Walker, J. H., R. D. Saunders, and A. T. Hattenburg, 1987: NBS measurement services: Spectral radiance calibrations. National Bureau of Standards Special Publ. 250-1, 68 pp. Waters, K., R. C. Smith, and M. R. Lewis, 1990: Avoiding shipinduced light-field perturbation in the determination of oceanic optical properties. Oceanography, 3, 18–21. Zaneveld, J. R. V., E. Boss, and A. Barnard, 2001: Influence of surface waves on measured and modeled irradiance profiles. Appl. Opt., 40, 1442–1449. ——, A. H. Barnard, and E. Boss, 2005: Theoretical derivation of the depth average of remotely sensed optical parameters. Opt. Express, 13, 9052–9061. Zibordi, G., and M. Darecki, 2006: Immersion factors for the RAMSES series of hyper-spectral underwater radiometers. J. Opt., A8, 252–258. ——, D. D’Alimonte, and J.-F. Berthon, 2004: An evaluation of depth resolution requirements for optical profiling in coastal waters. J. Atmos. Oceanic Technol., 21, 1059–1073.