An Example on Realizing Economics-Driven Software Mining Rami Bahsoon
Wolfgang Emmerich
School of Computer Science, The University of Birmingham, Edgbaston, Birmingham B15 2TT, UK
[email protected]
London Software Systems, Dept. of Computer Science,
Abstract Economics-driven software mining (EDSM) sifts through the repository data to extract information that could be useful for reasoning about not only the technical aspects but also the economics properties related to the development and/or evolution of software systems, and in relation to the environments in which they are procured, developed, evolved and used. The objective is to provide the analyst with insights into investment decisions related to the development, maintenance, and evolution of software systems. EDSM can also assist the analyst in resource planning and utilization. In this paper, we define EDSM, describe a scenario for realizing EDSM, and provide an example. The example represents a small-size component-based distributed architecture, where we mined existing performance repositories to value the ranges in which a given software architecture can scale to support likely changes in load. The mining is based on a financial analogy. The mining step is then complemented with real options analysis to predict the values resulted from the ranges in which an architecture can scale under uncertainty, where uncertainty is attributed to the unpredicted change in load. The example shows the usefulness of EDSM in informing tradeoffs analysis in software design decision making. Keywords. Economics-Driven Software Engineering, Mining Software Repositories, Maintenance and Evolution.
1. Introduction Effort on Mining Software Repositories (MSR) [MSR 1-4] has revolved around approaches which analyze the data stored in software repositories to assist in program understanding and visualization; predict and gauge the reliability and quality of software systems; study the evolution of software systems through discovering patterns of change and refactorings; modeling defects and their repair; and understand the origins of code cloning and design changes. Contributions have also included case studies showing how data can be extracted from software repositories to improve software design and reuse. The overall goal is utilize the mined data for predicting and planning various aspects of software projects. Meanwhile, software engineers are faced with general lack of adequate models and methods, which connect technical engineering concepts to economics and value creation under given circumstances [EDSR 1-8]. Reflecting on the Software Engineering discipline, [Sul99] note that the problem in the field is that “no serious attempt
University College London, Gower Street, WC1E 6BT, UK w.emmerich @cs.ucl.ac.uk
is made to characterize the link between structural decisions and value added”. That is, the traditional focus of software engineering is more on structural and technical perfection than on value added [EDSR 1-8; Boe00; Erd00]. This argument is applicable to the emerging MSR discipline, where the current focus appears to be purely a technical endeavor with little attention paid to economics context. For example, software repositories are often mined and analyzed ignoring the link between technical properties, economics, and value creation under a given circumstances. Such a link may provide the software analyst with a powerful tool for predicting cost/value information for developing and evolving dependable software; understanding the economics of refactoring and reengineering; assisting in resource planning and utilization; and understanding the economics ramification of the change; defects and their repair; on the system and its design artifacts (e.g., architectures); and informing design trade-offs. The objective is to utilize data buried in software repositories to provide insights into investment decisions related to the development and evolution of software systems to assist in resource planning and utilization. Conversely, mining software repositories could be seen as an effort for empirically developing economics-driven software engineering models and methods, which could have the promise in addressing the need indicated by [Sul99; Boe00; EDSR 1-8]. In this paper, we define EDSM, describe a possible scenario for realizing EDSM, and provide an example of use. Drawing on a case study that adequately represents a medium-size component-based distributed architecture, we mine existing performance repositories to value the ranges in which a given software architecture can scale to support likely changes in load. The mining is based on a financial analogy, where we utilize the concept of twin asset in financial engineering to justify mining relevant repositories. The mining process in then complemented with real options analysis for predicting the values resulted from the ranges in which an architecture can scale under uncertainty, where uncertainty is attributed to the unpredicted change in load. As the exact method for analyzing scalability is subject to debate, we focus the analysis on throughput as a way for measuring scalability. The provided pointers describe how EDSM can inform tradeoffs in software design decision making. The paper is further structured as follows. Section 2 defines EDSM and discusses a possible scenario to realiza-
tion. Section 3 presents an example on realizing EDSM. Section 4 briefly outlines related work. Section 5 concludes.
to fully answer. Software economics is still an immature discipline and unable to fully answer queries on the economics of distributed software engineering development, paradigms, technologies, distributed computations, etc.
2. Economics (or “Freakonomics”)-Driven Software Mining?
Freakonomic[Lev05], a recent best selling economics book by Levitt and Dubners, and their Freakonomic New York Times Magazine column address economics and social issues that are frequently difficult, but not impossible, to quantify. Freakonomics applies economics concepts in specific life situations and describes the application through tales, which are intended to challenge prior beliefs (i.e., the conventional wisdom). Levitt and Dubners demonstrate that the means of formulating testable hypotheses, the difficulties involved in gathering useful data and the utilization of those data are testaments to the discipline and creative mental processes of true scientific inquiry. Freakonomics attempts to demonstrate the power of data mining. Many of their results emerge from Levitt’s analysis of various databases, and in asking the right questions. In Freakonomics, the “implicit” process is initiated with inquiries that may not sound like typical questions for an economist to ask. For example, why, if gang-affiliated crack dealers make so much money, so many of them still live with their mothers? Tales showing relationships between causes, correlations, effects and their economics implication are analysed. Interestingly, such questions, which have no unifying links at the first glance, often result in new evidence-based discoveries, which may improve our understanding of the system in question, its relationship to the environment, and its economics. The logic is a mental exercise, say, if X relates to Y and Y relates to Z, then X should relate to Z in a way.
Economics-driven software mining (EDSM) is based on the premise that non-trivial, unknown, and valuable information lies in an existing data repository, where the goal of the mining is to sift through the repository data to extract information that could be useful for reasoning about not only the technical aspects but also the economics properties of the development and/or evolution of software systems, with the environments in which they are procured, developed, evolved and used [Bah07]. According to [Min99], the process of mining software repositories encompasses: (i) Data extraction from repositories; (ii) preprocessing the data for analysis, where the extracted data has to be formatted (e.g., treating noisy or missing data), sampled, and often need to be adapted to the mining algorithm(s). The data is then ready to be mined by a data mining algorithm(s); (iii) data mining which aims at extracting patterns of interesting and potentially useful, unknown, non-trivial information from the data; and (iv) data interpretation where the patterns identified are interpreted into knowledge, which can then be used to support decision-making. Different mining techniques may be used to achieve this step. EDSM poses several challenges. For example,
How can we decide on which data to be extracted and be mined?
Which of the mined data could be revealing to both the technical and economical properties of a software system and relative to the mining objectives?
What are the mining tools that could be used for extracting meaningful inputs for the economicsdriven software engineering analysis?
How can we ensure that the mining objectives have been satisfied and the obtained knowledge is meaningful inputs to the economics-driven software engineering analysis?
What are the appropriate analyses tools that could be used for supporting EDSM?
The challenge, therefore, is to realize EDSM in light of these questions. We argue that Freakonomics[Lev05] is appealing for economics-driven software mining. We believe that mining software repositories data to reason about both technical and economical properties in software requires radical, adhoc, and freak approaches for answering questions and formulations related to such properties, which classical software economics and the science of economics may fail
Freakonomics style to mining software repositories is appealing to the case of software engineering as the analysis may lead to evidenced-based discoveries, which could be beneficial for understanding the economics of building long-lived dependable systems and in relation to environment in which systems are procured, developed, evolved, and used. Furthermore, the nature of questions asked may seem to be unrelated, but the questions are merely a step towards the goal-seeking process for information. For example, despite the connection of scalability in software to value, there is a general lack of value-driven models, which connect this property to value under given circumstances. This could be attributed to the fact that the exact method for measuring scalability is still subject to debate: first, scalability is frequently thought of in terms of numbers of users that can be supported on either a single node or collectively on all nodes in a system; it denotes the ability to accommodate a growing future load. Second, the change in load demands is critical as it could impact the architecture at its various levels: structure, topology, and infrastructure. For example, the challenge of building a scalable system is to support changes in the allocation of components to hosts without breaking the architecture of the software system, or changing the design and code of a component [Emm00].
Third, the change in load could impact other non-functional requirements such as performance, reliability, and availability, when the change is poorly accommodated by the architecture. As a result, this debate is appealing to freakstyle to EDSM as the analysis is hard to understand with the sole use of classical methodologies to software economics; the analysis may need to span different dimensions of the software system including structural and behavioral. This is important to account for the economics ramification of the fluctuation in load on the structure (e.g., maintainability), the behavior (e.g., throughput), and their implications on the business value (e.g., revenues/ operations handled at a unit time) of given system. For example, throughput, as scalability measure, is correlated with value. That is, the more business transactions can be performed by a system, the more value is said to be created for the enterprise. By mining the load and throughput related histories, we can then compute the associated costs and benefits derived from executing these transactions over a time period. This could provide the analyst with an idea of the fluctuation in value. Consider a scenario where we need to add an extra distributed node for accommodating the load. By adding an extra node, it may not necessarily mean that an additional node may generate extra revenues, but perhaps loses, as the usage of the node might not necessarily be fully utilized to outweigh its cost. By enhancing the security of one of the system’s components, revenue may drop as we may “hurt” throughput which is tied to performance. This trivial example shows that reasoning about value added in software is complex as it is often correlated with qualities of the software system (or so called non-functionalities) and their dependency. These qualities can be retrospectively extracted from system usage profiles to reason about the economics “performance” of the system so that better utilization of recourses may be achieved. In realizing EDSM, we can utilize what the MSR community has implemented, tested, and evaluated from techniques, approaches, and extractors when mining software repositories. However, an effort is still needed on understanding how we can sift through the mined data to extract information that could serve as input for economics models (e.g. cost/benefit, real options, and utility theory) and tools to be used. Furthermore, traceability and dependency techniques could be a promising starting point for analysing queries that are hard to understand in a straightforward way, where the traces and dependencies can be utilized for analysis. Traceability and dependency techniques are well established components in software engineering and their uses have been demonstrated in many areas including software impact analysis, software testing and regression testing, and tracing requirements artefacts to design and/or back to people. Data visualisation and simulation tools may complement these approaches to facilitate comprehension of the causes, effects, and the interconnections of the contributing attributes. These tools can automatically produce
charts containing interesting associations of various characteristics of the software and their economics. The process of mining software repositories includes (i) setting a goal for the analysis (i.e. the mining objective); (ii) selecting the economics models which can perform the analysis; (iii) developing the mining tools for extracting and mining information, which could serve as inputs for the models in (ii); (iv) capturing and interpreting the derived patterns; (v) modeling and computation; and (vi) result interpretations, analysis and reflection, where the mining step can be complemented by economics analysis to provide an answer for queries related to the economics of software artifacts, project utilization, and management. The queries could range from simple to more Freakonomics style of queries. For example, let us assume that the query is to understand the evolution pattern of component X in a given architecture and the cost trends of evolving X over a time period. The change history of X could be mined using existing approaches and can be then complemented by cost estimation to cast effort of evolving X over a given period to cost (in £). Note, these models could be adapted from finance, economics, etc. on condition that the model assumptions are plausible or simplified to serve the software engineering mining objectives. The drawn analogy, the model inputs, and the made assumptions can then justify mining relevant repositories. In some cases, the analysis tool tends to shape the mining tool. An example is provided in Section 3, where adopting options analysis from financial engineering has constrained the way we extract and mined data.
3. An Example In this section, we provide an example on realizing EDSM from our application of real options theory in software engineering [Bah05] and [Bah08] and as a proof of concept. Setting. Let us consider a three-tier architecture of an online banking system application, referred to as Duke’s. This architecture will be built on middleware, such as Java 2 Enterprise Edition (J2EE) and the Common Object Request Broker Architecture (CORBA). Depending on which middleware is chosen, different architectures may be induced [DiN99]. Given the choice of either CORBA or J2EE to induce an architecture, let us assume that the Duke’s Bank system needs to scale to accommodate the growing number of clients in one-year time. An architecture which can scale to address such changes in load with limited resources and shorter time-to-market is a significant asset for surviving the business, cutting down maintenance costs, utilizing resources, and creating value. In particular, the cost and value derived from the flexibility in scaling up due to inducing the architecture with either CORBA or J2EE can inform the decision tradeoffs in considering either. Hence, the value added can inform the selection of application server products to induce Duke’s.
Drawing on the Duke’s case, we show how existing performance benchmark repositories are utilized and mined to predict the values in which a given software architecture induced by a middleware can scale to support changes in load. In particular, we mined relevant performance benchmarks to understand how the architecture of the system may behave once induced with either J2EE or CORBA with respect to throughput, which is a scalability and load measure. The mining is based on a financial analogy, where we “mimic” the concept of twin asset in financial engineering to justify mining relevant repositories and for valuing throughput using historical data. The approach utilizes online data and benchmarks, submitted from different practitioners and vendors. The mining process is then complemented with real options analysis for predicting the values resulted from the ranges in which an architecture can scale under uncertainty, where uncertainty is attributed to the unpredicted change in load. The rationale is that the combination could provide the architect/analyst with a useful tool for understanding the extent to which the software system is can accommodate the change in load and starting from early stages of the software lifecycle, where the system need not be implemented. We now provide an example on realizing EDSM as highlighted in Section 2. The process comprises (i) setting the mining objectives, (ii) selecting the economics models which can serve the analysis of the said objectives; (iii) developing the mining tools for extracting and mining information serving the chosen model in (ii), and (iv) analyzing and interpreting the derived patterns. Setting the mining objectives. Let us assume that we are given the choice of two middleware M0 and M1 to induce the architecture of a particular system as it is the case of Duke’s. Let us assume that S0, S1 are the architectures obtained from inducing M0 and M1 respectively. Say, M1 is an economical choice, if it adds value to S1 relative to S0. We attribute the added value to the enhanced flexibility of S1 over S0 in scaling up the architecture. But the added value is uncertain, as the demand and the nature of the future change and load are uncertain. We set some queries: (i) How valuable is the flexibility of either alternative, relative to likely change in scalability, will be in the long-run? (ii) Which solution is more valuable under uncertainty, where uncertainty is attributed to the unanticipated changes in load? (iii) What is the impact of volatility on value creation under given consideration? (iv) What is the impact of uncertainty on our choice? (v) Can high uncertainty, due to the likely future load, make the less favorable technology more appealing for the decision maker (and vice versa)? The mining objectives and the queries look to be sparse, with questions that look to have implicit but not explicit links. The challenge now is to select the economics model(s), which could be suited for addressing the said objectives. It is worth noting that answering these questions require an economics-driven software engineering models,
which will in turn tune the way data is mined from the repositories. As we can see that the value of flexibility under uncertainty is critical to choice of the economics models. The data representing uncertainty determines the repositories that we need to look at. Selecting economics models, which can serve the analysis of the said objective(s). We argued that options theory is well suited to address the above mining objectives. We formulate the objectives as an option problem: Real options analysis recognizes that the value of the capital investment lies not only in the amount of direct revenues that the investment is expected to generate, but also in the future opportunities that flexibility creates [Erd00; Sul99]. An option is an asset that provides its owner the right without a symmetric obligation to make an investment decision under given terms for a period of time into the future ending with an expiration date [Tri95]. If conditions favorable to investing arise, the owner can exercise the option by investing the exercise price defined by the option. A call option gives the right to acquire an asset of uncertain future value for the strike price [Tri95]. ArchOptions[Bah05; Bah04], a real options based model which values the growth options of an architecture relative to some future changes, as a way for understanding the architectural flexibility with respect to changes in requirements. A growth option is a real option to expand with strategic importance [Tri95] and is common in infrastructure-based investments, as it is the case with software architectures. Since the future changes are generally unanticipated, the value of the growth options lies in the enhanced flexibility of the architecture to cope with uncertainty. ArchOptions builds on a simple and intuitive analogy with Black and Scholes [1973], described in Table 1. Table 1. Financial/real options/ArchOptions analogy Option on stock
Real option on a project
ArchOptions
Stock Price
Value of the expected cash flows
value of the “architectural potential” relative to the change xiVp
Exercise Price
Investment cost
Estimate of the likely cost to accommodate the change Ceip
Time-toexpiration
Time until opportunity disappears
Time indicating the decision to implement the change (tp)
Volatility
Uncertainty of the project value
“Fluctuation” in the return of value of V over a specified period of time (σ)
In the context of ArchOptions, the flexibility of the middleware induced-architecture in coping with changes in load has a value in the form of growth options. This value is strategic in essence, uncertain as the demand on the future changes are uncertain, and may not be immediate. The added value may take the form of (i) accumulated savings
through coping with the change without “breaking” the architecture, mostly these are changes in non-functional requirements; (ii) extending the range of services while leaving the architecture intact; and (iii) the ability to respond to competitive forces and changing market conditions that may pose higher Quality of Service (QoS) requirements, such as the demands for higher availability, scalability, and so forth. Choosing a particular middleware to induce the architecture of the software system can be seen as an investment to purchase flexibility in the induced software architecture. The ranges, in which the load changes, influence the choice. A “wise” selection is seen as an investment to buy flexibility, which could be valued as future growth options [Tri96] on the architecture of the software system. These options enhance the upside potentials of the structure when the load change; they differ from one middleware to another. That is, S1 is said to be more accommodating to the change than S0 when S1 holds more growth options than S0. For a valuation point of view p, we focus the analysis on the calls of the ArchOptions model for valuing the growth options, as given in (1) accounting for both the expected value and exercise cost to accommodate future requirements ii, for i ≤ n. Valuing the expectation E of expression (1) uses the assumptions of Black and Scholes[Bla73] and detailed in previous work[Bah05; Bah04]. ∑ i=1…n E [max (xiVp - Ceip, 0)]
(1)
The payoff of the constructed call option gives an indication of how valuable the flexibility of an architecture is, when enduring some likely changes in requirements. The selection has to be guided by the expected payoff in (∑ i=1…n E [max (xiVp - Ceip, 0])S1 relative to that of (∑ i=1…n E [max (xiVp - Ceip, 0])S0. That is, if (- Ie + ∑ i=1…n E [max (xiVp - Ceip, 0)] S1 > ∑ i=1…n E [max (xiVp - Ceip, 0)] S0) for some likely changes, then it is worth investing in M1, as the investment in M1 is likely to generate more growth options for S1 than for S0 and relative to the p valuation point of view. If (E [max (xkVp - Cepk, 0)])S1=0), then M1 is not likely to payoff, relative to M0, as the flexibility of the architecture to the change is not likely to add a value for S1 on p, if the change need to be exercised. Two interpretations might be possible: (i) the architecture is overly flexible in the sense that its response to the change(s) has not “pulled” the options relative to p. This implies that the embedded flexibility (or the resources invested in implementing flexibilityif any) are wasted and unutilized to reveal the options relative to the changes and relative to p (ii) the other case is when the architecture is inflexible relative to the change. This is when the cost of accommodating the change on S1 is much more than the cumulative expected value of the architecture responsiveness to the change.
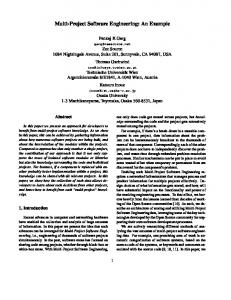
Developing the mining tools for extracting patterns serving the chosen economics model(s). Let us see how the choice of options theory and ArchOtions to valuation of scalability have guided the way relevant repositories are mined. Options valuation using Black and Scholes[1973] techniques determine the value of an asset in question in span of the market value using a correlated twin asset [Tri95]. The twin asset is an asset that has the same risks as the asset in question will have when the investment has been completed [Sch00]. To understand the behavior of the asset in question, we can use a twin asset, also referred to as a replicated portfolio. The assumption is that under similar conditions the twin asset and the asset in question are interchangeable for all practical purposes and should be worth the same. Throughput, a scalability measure, expresses the amount of work performed by the system under test during a unit of time. This criterion is based on the observation that for a fixed system with a given throughput (e.g., a single host), there is an inverse relationship between the response time and the number of clients. In other words, the more clients submitting requests, the longer are the delays. A well-known throughput metric is the Total Operations Per Second (TOPS) completed during the measurement interval, referred to as TOPS [http://www.spec.org/]. TOPS is composed of the total number of business transactions completed in the customer domain, added to the total number of work orders completed in the manufacturing domain, normalized per second[http://www.spec.org/]. We have mined relevant performance benchmarks, published in (http://www.spec.org/) to understand how the architecture of the system may behave once induced with either J2EE or CORBA with respect to throughput. An extract is shown in figure 1. We only use benchmarks, which are close to the case at hand. We then normalize the mined benchmarks for easing the comparison. We appealed to the use of published benchmarks, for the following reasons:
The system of the given architecture need not be implemented during the evaluation. Thus, performance measures may not be available. We argue that using published benchmarks mimics the concept of the twin asset for we are relying on historical information (though not traded in span of the market, but still hold market information) which shows possible variations in performance in connection to change in load and relative to the candidate implementations. These benchmarks often hint that the throughput is dependent on and can be estimated from the middletier “processing power” of the architecture. The advantage of this approach is that the published benchmarks could reveal risks of the operating environment on the choice. Benchmarks are revealing on the performance
Figure 1. Example of repositories of benchmarks for throughput
Analyzing and interpreting the derived patterns. Figure 2 shows the likely throughput trend that the J2EEinduced architecture may exhibit relative to the CORBAinduced one, upon varying the TOPS and the number of hosts. For the J2EE-induced architecture, we provide throughput estimations for two possible implementations: one with JBoss and the other with WLS. For the CORBAinduced architecture, we provide estimates upon the use of JacORB to induce the architecture. Table 2 depicts the upper limit of TOPS supported per host for each of WLS, JBOSS, JacORB induced architectures for 1 to 4 hosts. Figure 3 shows the likely cost-trend upon inducing the Duke’s bank architecture with J2EE (using either WLS or JBOSS) and with CORBA (using JacORB). The likely cost is plotted against the number of hosts (1 to 4). The cost refers to the lifecycle cost of the System Under Test (SUT). The cost includes Application Servers/Containers, Database Servers, network connections, etc. Assuming, for example, a five-year lifecycle, cost would include all hard-
ware (purchase price), software including license charges, and hardware maintenance. For the CORBA version, it assumed that the investment incurs an upfront cost to the development of the replication mechanism to support faulttolerance and load-balancing services for high load scenarios [Bah05b]. For the J2EE version of WLS, a license cost is incurred per host.
Throughput of WLS, JBOSS, and JacORB upon varying the load and hosts 3000.00 2500.00 2000.00 TO PS
dimension because, for example, if multiple benchmarks are conducted with a suitable mix of relevant factors, it may be possible to obtain a set of basic scalability results that can be used for estimating the throughput of possible configurations of the architecture. Depending on the benchmarking algorithm, the relevant scalability factors can be, for example, the number of objects, the number of clients, or the number of nodes in the system etc. supported in response to growing load. A major problem in comparing benchmark results, however, is that different hardware platforms and configurations (e.g., memory, disk drives etc) often produce different results making the comparisons difficult. Further, vendors often try many different ways to optimize performance, including adding cache memory and putting cache buffers on disk arrays. This can give a wide spectrum of worst and best scenarios that could mimics fluctuation, which is a volatility measure, of the option approach.
WLS JBOSS
1500.00
JacORB 1000.00 500.00 0.00 1
2
3
4
No of hosts
Figure 2. TOPS/host for each of WLS, JBOSS, JacORB (1- 4 hosts)
In [bah05], we have seen that the structural analysis is in favor of the J2EE-induced architecture, the throughput analysis may reveal a different trend upon scaling up each version. From the throughput valuation point of view, Figure 2 shows that when the Duke’s architecture will be induced with JBOSS, a J2EE implementation, the system is likely to be slower than that of the JacORB one. This is because JBOSS uses reflection [http://www.jboss.org]. This also implies that there are some chances for the JBOSS-induced architecture to require more hardware for addressing this deficiency. When inducing the Duke’s architecture with WLS, another J2EE implementation, the system is very likely to be faster than that of the JacORB implementation. WLS, however, comes with significant licenses costs; this cost grows with the number of hosts, as the load increases. Coining the TOPS with their associated costs, Figure 2, Figure 3 and Table 2, hint that there might be a case for JacORB in certain throughput range. Moreover, note that once the services for realizing scalability (i.e., the fault-tolerance and load balancing service) are implemented, the cost is incurred once and amortized across the hosts. Table 2. Upper limit of TOPS/host for WLS, JBOSS, JacORB Hosts
WLS
JBOSS
JacORB
1
732.00
400.26
546.80
2
918.36
502.16
686.01
3
1395.44
763.03
1042.39
4
2640.96
1444.08
1972.79
ported throughput is 105.12 TOPS, price/performance is $54,551.16/TOPS.
WLS, JBOSS, and JacORB Costs for 1-4 hosts 350000.00 300000.00
$
250000.00
WLS
200000.00
JBOSS
150000.00
JacORB
100000.00 50000.00 0.00 1
2
3
4
No of hosts
Figure 3. Likely cost-trend upon inducing the Duke’s bank architecture with J2EE-(WLS/JBOSS) and with CORBA (JacORB)
Modeling and computation. The case of valuing throughput is appealing to ArchOptions for the following major reasons: First, there is cone of uncertainty associated with the growing load and consequently in the value added as result of our choice. Moreover, the TOPS are of straightforward contribution to value. That is, the more operations are completed per second, the more value is added to the enterprise. However, TOPS incur a price upon executing the operations. The price again is dependent on several factors such as the number of hosts, the hardware, the license cost, and any additional costs that are necessary for making the middleware adaptable to the growing load. In the context of the Duke’s Bank, the TOPS range is often uncertain as it is dependent on the customers’ behavior at a time. The uncertainty in the likely range (i.e., TOPS), the associated costs for executing the TOPS, and the “fluctuation” in the value added as a result make the case very appealing to the use of ArchOptions. Below, we estimate the parameters for computing throughput, Pthro using ArchOptions to address the set mining objectives. Estimating (CeiPthro). TOPS denotes the Total Operations completed per Second. For simplicity of explanation, let us assume that the system of the induced architecture needs to scale up to support an additional operation per unit-time. An additional operation buys an architectural potential paying an exercise price. In terms of throughput, architectural potential is a performance measure. Hence, what an extra operation pays, if materializes, is a bandwidth for performing that operation. Inducing the Duke’s bank with either J2EE or CORBA provide different bandwidth capabilities for performing the operation at different prices. If the implementation of either happens to hold embedded growth options in supporting the extra operation, then the operation is said to pay an exercise price to buy options on the architecture. For the exercise price, we use a well-known normalization factor, which is the price/performance [http://www.spec.org/jAppServer2005/] (i.e., the lifecycle cost of the System Under Test (SUT) as configured for the benchmark divided by the throughput). This is provided in the data mined. As an example, assuming five-year lifecycle, the cost would include all hardware (purchase price), software including license charges, and hardware/software maintenance. If the total price is $5,734,417 and the re-
then
the
Estimating volatility (σPthro). Volatility represents uncertainty attributed to the likely growing of load. For some computation, we abide to the real options principles in computing volatility: we use the standard deviation of xiVPthros due supporting extra operations for a range of load at a host (as the range is said to be revealing to the fluctuation in the value). For other computations, we use modeling estimates for volatility, representing uncertainty to demonstrate how volatility influences the choice and as a way to answer the mining objectives. Estimating (xiVPthro). For simplicity, we estimate xiVPthro relevant to the business domain. For every completed online operation, Duke’s would not have to serve a customer in person at a branch; the Duke’s savings are in the manual-effort for not serving clients at a branch. Exercise time (t Pthro) and free risk interest rate(r Pthro). As a simulation assumption, we set the exercise time to one year, assuming that the Duke’s Bank needs to accommodate the change in one-year time. We set the free risk interest rate to zero (i.e., assuming that the value of money today is the same as that in one year’s time). Results interpretations and analysis. Now, We answer and reflect on the mining objectives we set to demonstrate usefulness of EDSM. We complement the observed patterns with options computation to inform the problem of tradeoff analyses and decision making in selecting a candidate middleware to induce an architecture, relative to Pthro. The likely change in load is the major source of uncertainty that faces Duke’s Bank. To address uncertainty and provide better insights on value creation, we have appealed to the use of real options theory. Let us have a close look at the impact of the volatility parameter, which is an expression of uncertainty to address the mining objectives. In options computation, volatility estimates the “cone of uncertainty” in the future value of the asset, rooted as its current value and extending over time as a function of volatility. As volatility increases, total uncertainty around the benefits also increases. The more TOPS a host is likely to support, the more likely that the actual benefits to “wander” up and down and deviate from the expected present value if the load grows. Let us assume that the present load is in the range of 30- 50 TOPS. Based on the mined data, 30-50 TOPS could be easily addressed by one host using either M0 (JacORB) or M1 (Jboss or WLS).
For such a low throughput requirements, inducing the architecture with M0 may appear to be more attractive as when compared to inducing the architecture with M1 (using either JBOSS or WLS). This is because M1 incurs license costs for WLS. Moreover, looking at S1 when induced with JBOSS, S1 is likely to be in magnitude slower than S0 as when induced with JacORB due to its use of reflection. This means that S1 (JBOSS) will support fewer TOPS and consequently will create less value added per second as
when compared to S0. For such low load, the faulttolerance and load-balancing services need not be implemented on S0 [Bah 05]. If options analysis is not used, M0 will be a no-brain choice for inducing the Duke’s Bank architecture. Though inducing the architecture S1 with M1 (using WLS) appears less attractive than M0 (JacORB), S1 may still carry embedded growth options which will only materialize if the load grows. If we use a Present Value (PV), the computation will based on the benefits of supporting the TOPS less their costs (i.e., the computation does not account for uncertainty). The resulted valuation will compute the present value as realized and ignore the growth options. In other words, inducing the architecture with WLS if undertaken, PV would hint that S1 would destroy value rather than create it. That is, Value S1 = PV. However, ValueS1 is actually Value S1 = PV + Opt. That is, M1 carry embedded growth options, Opt. The Opt, if left unexercised, are ignored by the non-options analysis. Hence, Value for S1 is then said to be underestimated. As a result, S0 may look more attractive (Table 3). The Present Value calculation of Table 3 shows that S1 is the least attractive for this range of load. The computation is based on the benefits of supporting 100 TOPS less their costs. However, the computation ignores the growth options on S1 in supporting additional 632 TOPS using the first host. Similarly, PV systematically undervalues the growth potential of S1 (JBOSS) and S0 (JacORB) in respectively supporting 300.26 TOPS and 446.26 TOPS. That is, PV ignores the flexibility value of S1 and S0 in responding to the growing load at host 1.
100 TOPS
Max TOPS
CeiPThro
XiVPThro
PV
Table 3. Illustration PV per second ($) for low throughput (100 TOPS)
S1(WLS)
732.00
853.11
12.63
-840.48
Value Ignored (TOPS)
S1(JBOSS)
-632 -300.26
400.26
603.11
12.63
-590.48
12.63
-590.48
S0(JacORB)
-446.80 546.80
603.11
Note, it is a fact that PV does not work well for projects with future decisions that depend on how uncertainty resolves. Though they can be used to evaluate the operational benefits in a stable environment with well-understood and measurable costs and benefits, they have little to offer when capturing additional value due to flexibility under uncertainty, such as strategic opportunities and the ability to respond to changing conditions. Using PV, S1, when induced with WLS, reports negative values upon inducing the architecture with WLS for this range of load. However, the situation indicates that these results underestimate the value of S1, as S1 can better respond to uncertainty, where the load is likely to grow over 100 TOPS. In Table 4, we turn to ArchOptions to capture the growth options on S1
and S0. The volatility parameter is an expression of the range of “benefits” at a host. For S1 (WLS): the benefits could “wander” from zero (i.e., idle state with no operations executing at a second) to the benefits derived from full utilization of capacity (i.e., in the support of 732 TOPS). That is, the volatility of 66% for S1 (WLS) indicates that the benefits of executing the TOPS is in the range of $0(idle) to $92.42(full utilization) per second on host 1. Similarly, for S0 (JacORB): the 45% volatility for S0 (JacORB) indicates that the benefits of executing the TOPS are in the range of $0(idle) to $69.04 (full utilization) per second on host 1. As for the options on S1(WLS), S1 has “pulled” the options on one host for this range of load. This is because we have accounted for the possible fluctuation in the derived values from supporting the TOPS. Considering such “fluctuation” provides us with better insights on the architectural potential of S1 in support of this likely change in load. Table 4 suggests S1 has reported a value added of $0.017 on 1 host. Table 4. Illustration options per second ($) very low throughput scenario (100 TOPS) 100 TOPS
CeiPThro
XiVP-
σPthro
Options
Thro
Actual Value (TOPS)
S1(WLS)
853.11
92.42
66%
0.01700
100 + 632
S1(JBOSS)
603.11
50.53
35%
0+
100 + 300.26
S0(JacORB)
603.11
69.04
49%
0.00001
100 + 446.80
Let us now assume that Duke’s Bank needs to support more customers. Assume that the load is likely to grow and be in the range of 600- 686 TOPS (Table 5): S1, when induced with WLS, realizes the change in load by one host. S0, when induced with JacORB, will need two hosts and will incur the cost of developing the fault-tolerance and load-balancing services on the structure. Yet, S1 when induced with JBOSS will require three hosts and will incur additional hardware costs for completing the 686 TOPS. Figure 4 shows a scenario for a likely load of 600-686 TOPS for S1 when induced with WLS and for S0 when induced with JacORB. S1 could be regarded as an investment with a wide range of possible outcomes. However, S0 is an investment with a relatively narrower range. For S1, the investment is said to be more volatile. This is because S1 can support more TOPS/host resulting in a possible range of values. Relating this to PV, this means that there is a chance of producing positive PV in the future. Hence, a real option under this set of outcomes would have value. As for the S0, the valuation under this scenario is more stable. This is because S0 can support at most 686 TOPS for the existing configuration. This means that S0 has no chance of producing a project with a positive PV beyond 686 TOPS. That is an option using the latter set of outcomes would have no value.
interest that the MSR community has reported some results. These contributions, however, are essentially technical endeavor with no attention paid to the economics context. For example, software repositories are often mined and analyzed ignoring the link between technical properties, economics, and value creation under a given circumstances. Our contribution is novel in addressing this gap.
Figure 4. Impact of volatility on value
Actual Value (TOPS)
Added Value l 14.52
686 TOPS + 686 TOPS+ 46 TOPS 77 TOPS
24.34 0
0 TOPS
Options Predicted($) 106.7 47.34 0
σPthro 10.52% 6.9% 0%
XiVPThro 231.06 240.85 216.54
CeiPThro 124.36 193.51 285.32
No Hosts 1 3 2
S0(JacORB) S1(JBOSS)
S1(WLS)
Full Utilization
Table 5. Options in ($) per second under full utilization of hosts for load greater than 686 TOPS on S0 and S1 and values added /second
4. Related Work Mining Software Repositories (MSR) [MSR 1-4] is an increasingly growing community in Software Engineering. The workshop web [http://msr.uwaterloo.ca/] provides excellent up-to-date online reference summarizing the contribution to MSRs since the workshop inception. In summary, contributions have revolved around approaches which analyze the data stored in software repositories to assist in program understanding and visualization; predict and gauge the reliability and quality of software systems; study the evolution of software systems through discovering patterns of change and refactorings; modeling defects and their repair; and understand the origins of code cloning and design changes. Contributions have also looked at case studies showing how data can be extracted from software repositories to improve software design and reuse. Challenges facing the MSR community like exchanging formats, metamodels, infrastructure and tools to facilitate the sharing of extracted data and to encourage reuse and repeatability have also been proposed, discussed, and debated. Case studies, on extracting data from repositories of large long lived projects and suggestions for benchmarks are areas of
Meanwhile, another community pioneered by Sullivan, Notkin, Shaw, and Boehm and their colleagues are interested in linking technical engineering concepts to economics and value creation [ESDM1-8]. Up to our knowledge, no contribution has been reported on EDSM, except for our recent position statement [Bah07]. Hence, our contribution bridges the gap between these two communities. It could be argued however that researchers in software economics have been mining software repositories since the early days of the field and mainly for cost and resource justification. This is true with no doubt. However, effort has not been focused on the link between technical decisions and value. Moreover, the type of analysis we’ve addressed is not classical; it resembles that of Freakonomics in nature. In [Bah05], we quantified the value of the structure in scaling to accommodate the change, by looking at the cost of change and by valuing the savings in maintenance, deployment, and configuration costs to realize the change on each structure of Duke’s[Bah05]. In [Bah08], we focus the analyses on the behavioral aspect to analyze scalability, where we use throughput to measure scalability: despite the clear connection of scalability to value, there is a general lack of value-driven models and methods, which connect this property to value under given circumstances. In this paper, we define EDSM. We look at how the mining objectives can influence the chosen economics models. We show how the chosen economics models can then inform the sources to be mined for answering the set objectives and informing software architecture-design tradeoffs.
5. Conclusion We have defined Economics-Driven Software Mining (EDSM). We have highlighted a scenario for realizing EDSM. We have presented an example on realizing EDSM. The example describes how software repositories could be mined to value the ranges in which a given software architecture can scale to support likely changes in load. The exposed arguments of Section 3 provide an example of the invaluable insights that the analyst might benefit from upon complementing the mined data with economics computation. These arguments show how EDSM can be a powerful tool for connecting technical concerns in software to value creation under given circumstances, where “freak” type of analysis is the norm. Such analysis has the promise to provide the software analyst with a powerful tool for predicting cost/value information for developing and evolving dependable software and un-
derstanding the economics ramification of the change on the system and its design artifacts (e.g., architectures); and informing design trade-offs. The objective is to provide insights into investment decisions related to the development and evolution of software systems and assisting in resource planning and utilization. Ongoing work includes designing an automated infrastructure and tools support Freak-style to EDSM. Effort includes designing a semiautomated support for executing the EDSM process, which we described including deriving interesting patterns, facilitating the computation, visualizing the results, assisting in interpretations, and supporting sensitivity analyses. Interestingly, MSR [1-4] drew the attention to a new challenge faced by empirical studies: whereas previous studies suffered from lack of data, current studies face challenges dealing with enormous amounts of freely available data from easily accessible repositories online such as forums, code, and bug reports repositories. Though this fact may have implications on the quality of the mined data and the resulted analysis under a given circumstance, this could also hint to opportunities for EDSM, where existing knowledge could provide insights into investment decisions related to development and evolution of systems. This could, for example, be based on analogies and similar to the way we have “mimicked” the concept of twin asset.
[Emm00] Emmerich, W.: Software Engineering and Middleware: A Road Map. In: A. Finkelstein (ed.), Future of Software Engineering, ACM Press (2000b) 117-129 [Emm02] Emmerich, W.: Distributed Component Technologies and their Software Engineering Implications. In: Proc. of the 24th Int. Conf. on Software Engineering, Orlando, Florida, ACM Press (2002) 537-546 [Erd0] Erdogmus, H., Boehm, B., Harrison, W., Reifer, D. J., and Sullivan, K. J.: Software Engineering Economics: Background, Current Practices, and Future Directions.Tutorial Summary. In: Proc. of 24th Int. Conf. on Software Engineering, ACM Press (2002) 683-684 [Min99] Mining Software Engineering Data: A Survey [MSR1-4] MSR 1-4: Proceedings of the ICSE Workshops on Mining Software Repositories, In conjunction with ICSE 2004- 2007. [OMG00] Object Management Group: The Common Object Request Broker: Architecture and Specification, 2.4 ed., OMG (2000) [Stev05]Steven Levitt and Stephen J. Dubner (2005). Freakonomics: A Rogue Economist Explores the Hidden Side of Everything. William Morrow/HarperCollins [Sul01] Sullivan, K.J., Griswold, W., Cai, Y., and Hallen, B.: The Structure and Value [Sul96] Sullivan, K. J.: Software Design: The Options Approach. In: the Proc. of the Second Int. Software Architecture Workshop. Joint Proc. of SIGSOFT '96 Workshops, San Francisco, CA (1996) 15–18 [Sul99] Sullivan, K. J.: Chalasani, P., Jha, S., and Sazawal, V.: Software Design as an Investment Activity: A Real Options Perspective. Real Options and Business Strategy: Applications to Decision-Making. In: Trigeorgis L. (ed.) Risk Books (1999) 215-260 [Sun] Sun Microsystems Inc.: Duke’s bank http://java.sun.com/j2ee/tutorial/1_3-fcs/doc/Ebank.html
6. Acknowledgment We thank Prof David Rosenblum for some related discussion.
7. References [Bah04] Bahsoon, R. and Emmerich, W.: Evaluating Architectural Stability with Real Options Theory. In: Proc. of the 20th IEEE Int. Conf. on Software Maintenance (2004) [Bah05] Bahsoon, R., Emmerich, W., and Macke, J.: Using ArchOptions to Select Stable Middleware-Induced Architectures. In: IEE Proceedings Software, Special issue on Relating Requirements to Architectures, IEE Press 152(4) (2005) 176-186 [Bah07] Bahsoon, R. and Emmerich, W.: Economics-Driven Software Mining. In: Proc. Of the ICSE 2007 workshop on Economics of Software and Computation. To appear [Bah08] Bahsoon, R. and Emmerich, W.: (2008) An Economics-Driven Approach for Valuing Scalability in Distributed Architectures. In Proc. of the 7th Working IEEE/IFIP Conference on Software Architecture (WICSA 2008), Vancouver, Canada. IEEE Computer Society Press. [Bla73] Black, F., and Scholes, M.: The Pricing of Options and Corporate Liabilities. Journal of Political Economy. U. of Chicago Press (1973) 637-654 [Boe00] Boehm, B., and Sullivan, K. J.: Software Economics: A Roadmap. In: A. Finkelstein (ed.): The Future of Software Engineering. ACM Press (2000) 320-343 [DiN99] Di Nitto, E., and Rosenblum, D.: Exploiting ADLs to Specify Architectural Styles Induced by Middleware Infrastructures. In: Proceedings of the 21st Int. Conference on Software Engineering, ACM Press (1999) 13-22 [EDSR 1-8] EDSER 1-8: Proceedings of the Workshops on EconomicsDriven Software Engineering Research: In conj. with the 21st through 28th International Conference on Software Engineering (1999 - 2006)
application,
[Tri95] Trigeorgis, L.: Real options in Capital Investment: Models, Strategies, and Appications. Praeger Westport, London (1995) of Modularity in Software Design. In: the Proceedings of the ninth ESEC/FSE (2001)