An Experimental Framework to Validate 3D Models of Cardiac Electrophysiology Via Optical Imaging and MRI Mihaela Pop1, Maxime Sermesant2,3, Desmond Chung1, Garry Liu1, Elliot R. McVeigh4, Eugene Crystal5, and Graham A. Wright1 1
Department of Medical Biophysics, University of Toronto, Sunnybrook Health Sciences Centre, Toronto, Canada
[email protected] 2 ASCLEPIOS project, INRIA Sophia Antipolis, France 3 Division of Imaging Science, King’s College, London, UK 4 Laboratory of Cardiac Energetics, National Heart Lung and Blood Institute, National Institute of Health, Bethesda, Maryland, USA 5 Arrhythmia Services, Sunnybrook Health Sciences Centre, Toronto, Canada
Abstract. Our aim is to develop a framework to validate 3-D computer models of cardiac electrophysiology using measurements of action potential obtained via optical imaging (based on voltage-sensitive fluorescence), and heart anatomy and fiber directions which are obtained from magnetic resonance imaging (MRI). In this paper we present preliminary results of this novel framework using a healthy porcine heart ex vivo model and the Aliev & Panfilov mathematical model. This experimental setup will facilitate the testing, validation and adjustment of computational models prior to their integration into clinical applications. Keywords: computer modelling, electrophysiology, optical imaging, MRI.
1 Introduction Computer modelling is a powerful tool used in electrophysiology to predict the electrical activity in normal and pathologic cases. In particular, it could help us understand and predict the arrhythmic events associated with myocardial infarction, a major cause of deaths [1]. Detailed ionic models, as well as macroscopic, phenomenological models have been proposed in computational electrophysiology to solve for the action potential (AP) propagation and its duration [2-5]. The mathematical approach is usually chosen by the investigators based on the available input and desired output parameters, as well as computational resources. It is, however, very challenging to non-invasively obtain quantitative validation of these models from data close to in vivo geometry and physiology. To calculate the duration of the action potential, one needs the precise depolarization and repolarization times. Currently, monophasic action potentials (MAP) can be recorded in vivo via a catheter-electrode invasively inserted into the heart; however, this electrode records only one measurement (from the location where is positioned) [6]. To increase the number of simultaneous recordings, one can use an electrode-sock F.B. Sachse and G. Seemann (Eds.): FIMH 2007, LNCS 4466, pp. 100–109, 2007. © Springer-Verlag Berlin Heidelberg 2007
An Experimental Framework to Validate 3D Models
101
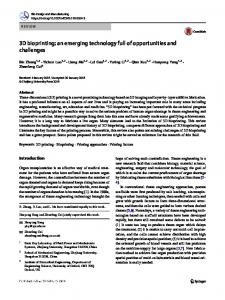
(comprising 256 or more electrodes), but the sock records the extracellular potentials [7]. An alternative is given by the optical imaging technique, which has been shown to provide fast and accurate measurements of AP in explanted hearts prepared under physiological conditions close to those in vivo [8, 9]. The fluorescence dye is sensitive to the changes in transmembrane potential, therefore, the changes in the signal intensity can be recorded optically at submillimetric spatial resolution and high temporal resolution. To avoid erroneous estimations of the AP propagation and conduction velocity, a few methods have been proposed to reconstruct the 3D heart surface from 2D optical images [9-11]. Our aim is to build a validation framework for 3-D mathematical models of cardiac electrophysiology using measurements of action potential obtained from optical fluorescence images, as well as the anatomy and fiber directions obtained via MR imaging. The first task is to compare and adjust the predictions of the mathematical model with direct measurements of action potential in healthy hearts. A diagram of the validation framework is illustrated in Figure 1 below.
Fig. 1. Framework to construct the computer model from optical and MR images of the heart
In this paper we present preliminary results of this framework using explanted porcine healthy hearts and the Aliev & Panfilov monodomain model. The twovariable model developed by Aliev & Panfilov (based on reaction-diffusion equations) solves for the action potential without computing ionic currents [4].
2 Methodology In this section we describe in detail the steps performed to build the validation framework proposed above. For simplicity, we describe these steps in the order they were accomplished. We first performed the optical experiment, and then used MR imaging to construct the computer model (i.e. the anatomy and fiber directions) of the same heart. The computational mesh was constructed from the anatomy scans and the simulations were performed with parameters that reproduced the experimental conditions (e.g. the position of pacing electrode, the duration of stimulus, etc). The initial input parameters of the model can be adjusted based on the measurements of action potential.
102
M. Pop et al.
2.1 Optical Experiment The animals were anesthetized, the chests opened and the hearts exposed (in accordance to the animal research protocol guidelines approved at Sunnybrook Health Centre, Toronto, Canada). The hearts were then immediately excised after euthanasia. The blood was flushed out and the aorta rapidly cannulated and attached to a Langendorff perfusion system. Throughout the experiments, the hearts were constantly perfused with oxygenated Tyrodes’ solution (95%O2 & 5%CO2), maintained at a pH=7.0±0.3 and at a temperature of 37.0±0.5ºC. The hearts were paced at different constant frequencies between 1-2Hz via a bipolar stimulating Ag/AglCl2 electrode coated with gold at the tip to avoid polarization effects (GrassTelefactor, USA). The duration of the square stimulus was set to 10ms. A 20ml bolus of fluorescence dye solution (0.2ml di4-ANEPPS, Biotium Inc) was injected into the heart via the perfusion line. To avoid motion artifacts, an electromechanical uncoupler (2,3-butanediome monoxime, Sigma Aldricht) was also injected in the perfusate solution, resulting in suppression of the heart motion. The dye was excited with green light (530±20nm) via 150W halogen lamps (MHF G150LR, Moritek Corp, Japan). To avoid photo-bleaching, the lamps were controlled by shutters (labeled ‘S’ in Figure 2 below). The emitted signals from the hearts were filtered through a high-pass filter (> 610nm) and captured by a high-speed dual-CCD system (MICAM02, BrainVision Inc. Japan).
Fig. 2. Schematic of the optical experiment using a dual-camera system to record the action potential from the heart perfused ex vivo via a Langendorff system
The relative changes in the intensity of the fluorescence follow the changes in transmembrane potential. The recorded AP waves were denoised with a spatial-cubic filter and further analyzed with BV-Ana software (BrainVision, Japan). The images recorded by the dual optical system were used to reconstruct the 3D surface of the heart. The details of the stereo reconstruction and calibration methods can be found elsewhere [11]. In the current work, 5-7 opaque markers were glued onto the epicardium to provide a way to register the optical images with the surface of the model from MR images. We estimate the rigid transformation between the markers’ optical and MR 3D
An Experimental Framework to Validate 3D Models
103
coordinates by solving the least-squares difference using quaternions via a function implemented in the Visualization Toolkit (VTK, Kitware Inc.) libraries [12]. One marker was placed at the exact location of the stimulating electrode and this location was specified in the simulations. 2.2 Magnetic Resonance Imaging At the completion of the optical experiment, the hearts were imaged using a 1.5Tesla Signa GE MR scanner for markers locations, anatomy, and fiber directions. For the markers locations we used a 3D fast spin echo (FSE) sequence using the following MR parameters: TE=60ms, TR=1000ms, slice thickness = 1.5 mm, a FOV and matrix yielding an in-plane interpolated resolution of 0.5x0.5mm. The diffusion-weighted imaging sequence was developed at the Laboratory of Cardiac Energetics (NIH/NHLBI, USA) [13] and implemented on our research scanner. We used the following MR parameters: TE=26ms, TR=800ms, NEX=1, b-value = 700, 7 directions for diffusion gradients, with the same FOV/matrix as for the 3D FSE series. The heart anatomy was extracted from the un-weighted images (i.e. b=0) and used to generate the volumetric mesh for the mathematical model. 2.3 Computer Model We use the model of the heart described in [14] to perform our simulations. We briefly detail the Aliev and Panfilov model. In the system equations given in (1-2) we solve for V, the action potential, and r, the recovery variable contribution:
∂V = ∇ ⋅ ( D∇V ) − kV (V − a )(V − 1) − rV + I stim ∂t
(1)
∂r μr = −(ε + 1 )(ku (u − a − 1) + r ) ∂t μ2 + V
(2)
The term –kV(V-a)(V-1) controls the fast processes (initiation and upstroke of action potential) via the threshold parameter a, while r, determines the dynamics of the repolarization phase. The term Istim represents the extra-stimuli (e.g. the pacing stimulus in the experiment). Most of the parameters (i.e. ε=0.01 a=0.1, k=8, μ1=0.01 and μ2=0.3) were set as in [2] to reproduce the shape, duration (i.e. 350ms) and restitution of AP obtained from experiments in canine cardiac tissue (the only available data in the literature, given in [15]). The model accounts for the heart anisotropy via the diffusion tensor, D, which depends on tissue diffusivity d (set to 1 for a normal/healthy conduction). The value in anisotropy ratio is set to 0.25 for an electrical wave propagating twice as fast along the fiber than in the transverse direction. The variables in the Aliev and Panfilov model are dimensionless, therefore they must be re-scaled to be related to physical values. For example, the normalized AP in the model varies between 0 and 1, which corresponds to real values of transmembrane potential between -90 and +20mV. The heart surface mesh is created from the anatomy images using classical segmentation algorithms (thresholding, mathematical morphology, marching cubes)
104
M. Pop et al.
and then the volumetric tetrahedral mesh is generated with the GHS3D package (INRIA, France). We solve for the transmembrane potential using the Finite Element Method, with an explicit Euler time integration scheme. The code was written in C++ and uses OpenGL libraries to display the results. For the simulations presented in this study, we used a computational time step of 1x10⁻⁴s. The simulation time for one heart cycle (of 0.85s) on a mesh of approximately 41000 elements is about 10min on an Intel ® Pentium 4, 3.2GHz CPU, with 1Gb of RAM.
3 Results The following section presents the results obtained in each step detailed in the methodology described above. 3.1 Optical Recordings of Action Potential
Figure 3.a shows a 2D image of the propagating AP acquired by one camera (with a 0.7mm spatial resolution and 3.7ms temporal resolution) at an instance in time marked by the dotted lines in the AP waveforms (obtained at a pacing frequency of 1.2 Hz at different pixel locations). Figure 3.b illustrates examples of AP waves recorded at other frequencies (i.e. 1.4, 1.6, 1.8 and 2Hz). The average duration of APD50 (the action potential measured at 50% repolarization) can be calculated for each frequency.
(a)
(b)
Fig. 3. (a) The 2D optical image at one instance in time and the AP waves recorded at a pacing frequency of 1.2Hz, where the red color corresponds to the depolarized phase of AP, while the blue corresponds to the complete repolarized phase; (b) the normalized AP waves at other pacing frequencies
3.2 Three-Dimensional Stereo Reconstruction of Epicardial Surface
Results from the 3D stereo reconstruction are presented in Figure 4. Figure 4.a shows the surface reconstructed with the texture mapped and the markers visible in Figure 4.b. For the optical imaging configuration used to generate the results shown in this paper, the 3D reconstruction procedure was able to measure the depth of an image
An Experimental Framework to Validate 3D Models
105
point to within 2mm, and it’s fronto-parallel position within 0.5mm. The action potential propagation, at one instance in time, was projected onto the 3D reconstructed surface and shown in Figure 4.c.
(a)
(b)
(c)
(d)
Fig. 4. Results from the 3D stereo reconstruction: surface rendering (a), texture mapping (b), propagation of normalized AP at one instance in time, for example the blue color indicates that the heart was completely repolarized (c) and isochronal map mapped onto the 3D surface (d)
The activation times can also be represented by isochrones (lines connecting pixels of equal activation time). Isochronal maps can be produced over one heart beat. An example is presented in Figure 4.d, where the isochrones were calculated with the BV-Ana software from the maximum and the minimum values of the transmembrane potential 50%(Vmax-Vmin), plotted with a 20ms interval, and mapped onto the 3D reconstructed surface. The 3D isochronal map can be used for comparisons with the output of the computer model. For this, the 3D optical surface and the 3D MR surfaces have to be registered via the markers (see 3.3). 3.3 Registration of the 3D Optical Surface with 3D MR Surface
The stimulating electrode location (encircled) and the markers locations in the 2D optical images are shown in Figure 5.a and 5.b, respectively. Figure 5.c shows the markers visible in the MR volume-rendered image. From the rigid transformation, the 3D positions (i.e. coordinates) of the markers were estimated by the optical stereo reconstruction to be within 1.2mm of their positions indicated in the volumetric MR scan.
(a)
(b)
(c)
Fig. 5. The electrode position (a). The markers locations in fluorescence (b) and MR (c) images, respectively.
106
M. Pop et al.
3.4 Fiber Directions
Figure 6 shows the fiber directions (in one of the hearts) obtained from diffusionweighted MR images. The fiber directions can be visualized using MedINRIA1 software (fig. 6.a.), which encodes the RGB colors for the three orthogonal directions. In the computational mesh, the fiber directions were specified at the baricenter of each tetrahedral element of the mesh (fig. 6.b).
(a)
(b)
Fig. 6. (a) Cross section and lateral view of one heart, with fibers reconstructed; (b) the fibers assigned in the computational mesh
3.5 Computer Simulation Results
Figure 7 displays simulation results produced with the threshold parameter a in the model initialized at a=0.1. The electrode location is depicted by the bright red dot in Figure7.a. Propagation of depolarization/repolarization wave on the heart at one instance in time is shown Figures 7.b and 7.c. An example of an isochronal map is given in Figure 7.d. Figure 8.a shows an example of the changes in transmembrane potential (normalized values) predicted before the adjustment of Aliev-Panfilov model. These initial simulations produced an APD50 of 350ms at 1.2Hz. The value of threshold parameter a in the model was adjusted from a=0.1 to a=0.12, via a trial and error procedure, until the simulations produced an APD50=290ms at 1.2Hz (Figure 8.b) as measured in experiments.
(a)
(b)
(c)
(d)
Fig. 7. Simulations results of the mathematical model obtained with the canine data from [4]
1
http://www-sop.inria.fr/asclepios/software/MedINRIA
An Experimental Framework to Validate 3D Models
(a)
107
(b)
Fig. 8. The changes in transmembrane potential over one heart cycle (at 1.2Hz) before (a) and after (b) the adjustment of the threshold parameter a in the model
4 Discussion and Future Work The validation of computer models is an important step prior to their integration into clinical applications involving patients (i.e. diagnosis and therapy planning). Ionic models are accurate, but they are computationally expensive and need experimental validation at the same cellular scale. Alternatively, one can use the macroscopic model developed by Aliev and Panfilov. This model has been recently used to build maps of local apparent electrical conductivity by integrating information from measurements obtained via an epicardial sock in a dog heart model, in vivo [7, 16]. In the work presented here, we proposed a novel validation framework in an ex vivo model of healthy porcine hearts, and we have presented preliminary results. The AP duration and propagation is measured with high spatial (i.e. 0.7mm) and temporal resolution (i.e. 3.7ms) via optical imaging, which allowed us to observe the AP wave in detail. The computer model was then built from MR anatomy images of the same heart, and integrated with the structural anisotropy due to fiber directions. The main output of the model is the solution for transmembrane potential. This output can be adjusted to yield the same AP duration as in the optical recordings. However, only the adjustment of the threshold parameter is insufficient since it does not affect the shape of AP. It can be seen (by comparing Fig.3 and Fig.8) that the repolarization phase appears steeper in the calculated AP compared to the optical recordings. This could be due either to a limitation of the Aliev-Panfilov model or to our simplified fitting procedure. In this respect, the work will be extended to fit all of the model parameters from the restitution curve of AP (from the recordings at different frequencies, as in [4]). We do not expect significant differences between the model parameters obtained in [4] from the dog data, and our pig data. To realistically compare the predictions with the measurements for the propagation of AP and the isochronal map, we proposed a 3D stereo reconstruction of the surface of the heart. The registration between the optical and MR surfaces performed very well (i.e. the markers’ position in the optical and the MRI locations corresponded within 1.2mm). One of the markers gave the position of the pacing electrode enabling us to specify precisely the stimulus location in the simulations. The current image acquisition was limited to only one optical angle. A rotation of the heart in front of the cameras could enable the propagation of the electrical wave to be recorded from other angles as well, and to recover the entire surface of the heart.
108
M. Pop et al.
However, the depth from which the optical signals originate makes the signal interpretation very complex, because the signals do not originate only from several millimeters beneath from the recording site. Instead, the epicardial optical signals contain a depth-weighted average of transmembrane potential signals generated by the fluorescent photons from a 3D volume beneath the surface. These findings were validated with other electrical models (i.e. bidomain and Luo-Rudy) [17-18]. It would be very interesting to compare the solution of the Aliev and Panfilov model with the calculated transmembrane potential generated by the flux of photons during the process of illumination and emission. It was also shown that the morphology of optical AP changes with the change in the direction of the wave front propagation, because of the complex anisotropy of the myocardium [19]. However, in their study, the authors obtained the fiber orientations (on a 3D slab of tissue) via histology. In our model, the fiber directions are noninvasively obtained for the entire heart from MRI. Therefore, our framework allows one to investigate whether the Aliev and Panfilov model predicts such changes by varying the position of the pacing electrode (as this location is precisely identified via an opaque marker in the MR images). Our ultimate goal is to predict the electrical propagation in pathologic cases. It is known that in structurally diseased hearts, the wave propagation is abnormal and vulnerable to reentry phenomena [1]. We plan to test the computer model by performing simulations to study the perturbations in the wave propagation, in the presence of anatomic blocks and areas of slow electrical conduction.
Acknowledgment The authors would like to thank Dr. J. M. Rogers (University of Alabama, Birmingham, USA) for valuable discussions regarding the optical technique, Dr. Patrick Helm (University of Virginia, USA) for help with implementing the diffusion-weighted sequence on our scanner, Mr. A. Kim and Mr. K. Anderson for technical assistance with the optical set-up and to the veterinary technicians at Sunnybrook for help with the animal studies. This study was supported by funding from the Ontario Research and Development Challenge Fund, the Canadian Foundation for Innovation, and the Ontario Innovation Trust. Ms. Mihaela Pop is supported by a PhD scholarship from the Heart and Stroke Foundation of Canada.
References 1. Kebler, A., Rudy, Y.: Basic mechanisms of cardiac impulse propagation and associated arrhythmias. Physiological Review 84, 431–488 (2004) 2. Nash, M.P., Panfilov, A.V.: Electromechanical model of the excitable tissue to study reentrant cardiac arrhythmias. Progress in Biophys. Mol. Biol. 85, 501–510 (2004) 3. Clayton, R.H., Holden, A.V.: Dispersion of cardiac action potential duration and the initiation of re-entry: A computational study, Biomedical Eng. Online, pp. 4–11 (2005) 4. Aliev, R., Panfilov, A.V.: A simple two variables model of cardiac excitation. Chaos, Soliton and Fractals. 7(3), 293–301 (1996)
An Experimental Framework to Validate 3D Models
109
5. Aliev, R., Panfilov, A.V.: Modeling of heart excitation patterns caused by local inhomogeneity. Journal of Theoretical Biology 181, 33–40 (1996) 6. Kim, B.S., Kim, Y.H., Hwang, G.S., Pak, H.N., Lee, S.C., Shim, W.J., Oh, D.J., Ro, Y.M.: Action Potential duration restitution kinetics in human atrial fibrillation. Journal of the American College of Cardiology 39(8), 1329–1336 (2002) 7. Sermesant, M., Faris, O., Evans, F., McVeigh, E., Coudiere, Y., Delingette, H., Ayache, N.: Preliminary validation using in vivo measures of a macroscopic electrical model of the heart. In: Ayache, N., Delingette, H. (eds.) IS4TM 2003. LNCS, vol. 2673, pp. 230–243. Springer, Heidelberg (2003) 8. Efimov, I.R., Nikolski, V.P., Salama, G.: Optical imaging of the heart. Circulation Research. Jul. 9, 95(1), 21–33 (2004) 9. Kay, M.W., Amison, P.M., Rogers, J.M.: 3D surface reconstruction and panoramic optical mapping of large hearts. IEEE Trans. on Biomed. Eng. 51, 1219–1229 (2004) 10. Sung, D., Omens, J.H., McCulloch, A.D.: Model-based analysis of optically mapped epicardial patterns and conduction velocity. Ann. Biomed. Eng. 28, 1085–1092 (2000) 11. Chung, D., Pop, M., Sermesant, M., Wright, G.A.: Stereo reconstruction of the epicardium for optical fluorescence imaging. In: Esboll, BJ., Jorgensen, TM. (eds.) MICCAI Workshop on Biophotonics for diagnosis and treatment. IMM-Technical Report, pp. 33–40 (2006) 12. Horn, K.P.: Closed-form solution of absolute orientation using unit quaternions. Journal of the Optical Society of America A. 4, 629 (1987) 13. Helm, P., Tseng, H.J., Younes, L., McVeigh, E.R., Winslow, R.L.: Ex vivo 3D diffusion tensor imaging and quantification of cardiac laminar structure. Magnetic Resonance Medicine 54(4), 850–859 (2005) 14. Sermesant, M., Delingette, H., Ayache, N.: An Electromechanical model of the heart for image analysis and aimulation. IEEE Transactions on Medical Imaging 25(5), 612–625 (2006) 15. Elharrar, V., Surawicz, B.: Cycle length effect on restitution of action potential duration in dog cardiac fibers. Am. J. Physiology 244, H782–H792 (1983) 16. Moreau-Villeger, V., Delingette, H., Sermesant, M., Ashikaga, H., McVeigh, E.R., Ayache, N.: Building maps of local apparent conductivity of the epicardium with a 2-D electrophysiological model of the heart. IEEE Transactions on Biomedical Engineering 53(8), 1457–1466 (2006) 17. Bishop, M.J., Rodriguez, B., Eason, J., Whiteley, J.P., Trayanova, N., Gavaghan, D.J.: Synthesis of voltage-sensitive optical signals: Application to panoramic optical mapping. Biophysics J. 90, 2938–2945 (2006) 18. Hyatt, C.J., Mironov, S.F., Vetter, F.J., Zemlin, C.W., Pertsov, A.M.: Optical action potential upstroke morphology reveals near-surface transmural propagation direction. Circulation Research, 97, 277–284 (2005) 19. Vetter, F.J., Simons, S.B., Mironov, S., Hyatt, C.H., Pertsov, A.M.: Epicardial fiber organization in swine right ventricle and its impact on propagation. Circulation Research, 96, 244–251 (2005)