Abstract. One of the most important concerns in the geothermal industry in recent years is reservoir decline. Injection of condensate and waste water in ...
Geothermal Resources Council Transactions, Vol. 24, September 2000
An Experimental Method for Evaluating Water Injection into Geothermal Reservoirs Kewen Li and Roland N. Horne Stanford Geothermal Program, Stanford University
Keywords Water injection; Spontaneous water imbibition; Water saturation; Imbibition rate; The Geysers.
Abstract One of the most important concerns in the geothermal industry in recent years is reservoir decline. Injection of condensate and waste water in geothermal reservoirs is a substantial and practical solution. Is there any method to study the feasibility of water injection into geothermal reservoirs before implementing liquid injection? How can we identify the difference of water injectability between different reservoirs? Spontaneous water imbibition tests in rocks from The Geysers and in Berea sandstone have been designed to answer these questions. The maximum water saturation and the maximum imbibition rate by spontaneous water imbibition were used to evaluate the feasibility and the ability of water injection into geothermal reservoirs. Reservoirs with high imbibition rates and high maximum water saturation are good candidates for water injection. If there is no imbibition of water into the rocks at all, then the reservoir is not suitable for water injection. The relationships between imbibition rate and time for The Geysers rocks have been measured under countercurrent and cocurrent imbibition conditions, respectively. The measured maximum water saturation by the spontaneous water imbibition in The Geysers rock was about 87.9%, which was much greater than that in Berea although the imbibition rate was lower. Experimental results showed that The Geysers geothermal reservoir is appropriate for water injection, which has been confirmed by the practice of water injection in the field itself.
Introduction Injection of condensate or waste water in geothermal reservoirs is usually deployed in geothermal reservoirs to maintain reservoir pressure and protect the environment. Spontaneous water imbibition is a dominant process during injection into these reservoirs. It would be useful for geothermal reservoir engineers to have a method or some set of criteria to appraise the feasibility of water injection into geothermal reservoirs prior to the implementation. Few experimental approaches, unfortunately, are available in the literature. Therefore, spontaneous water imbibition tests in rocks from The Geysers have been designed and a model has been modified to assess water injection projects. The idea was the following. If we could model the spontaneous water imbibition process mathematically, then we could derive a formula to represent the relationship between the water imbibition rate (qw) and the imbibition time (t). It might be possible to up-scale the experimental results to field scale by using the mathematical model once the average fracture spacing was known. Therefore, we would be able to forecast the water injection performance in geothermal reservoirs.
1
Kewen Li and Roland N. Horne
The critical issue is how to model the spontaneous water imbibition process in geothermal rocks. There are a lot of papers in the literature regarding spontaneous water imbibition into oilsaturated sandstone samples but few in gas-saturated geothermal rocks. The study of spontaneous water imbibition is essential to predict the production performance in these reservoirs where the amount and rate of mass transfer between the matrix and the fracture influence the recovery and the production rate. Experimental data may be used to evaluate the feasibility of water injection into geothermal reservoirs. Since spontaneous imbibition is a capillary-pressure dominated process, the imbibition rate is significantly dependent on the properties of the porous media, fluids, and their interactions. These include permeability and relative permeability of the porous media, pore structure, matrix sizes, shapes and boundary conditions, fluid viscosities, initial water saturation, the wettability of the rock-fluid systems, and the interfacial tension between the imbibed phase and the resident phase. Aronofsky et al. (1958) suggested an empirical form of the function of time relative to production from the matrix volume:
η = 1 − e − λt
(1)
where η is the recovery in terms of recoverable resident fluid by spontaneous water imbibition, λ is a constant giving the rate of convergence, and t is the imbibition time. Schechter and Guo (1998) used a similar equation to fit the experimental data of spontaneous water imbibition in oilsaturated rocks by substituting t with the dimensionless time tD, which is defined as follows:
tD = t
k σ cos(θ ) φ µ m L2c
(2)
where k is the rock permeability, σ is the interfacial tension between oil and water, φ is the porosity, θ is the contact angle, µm is the geometric mean of water and oil viscosities and Lc is the characteristic length and defined as follows (Ma et al., 1995): Lc =
V A ∑ i i =1 X Ai
(3)
n
here V is the bulk volume of the matrix, Ai is the area open to imbibition at the ith direction, and XAi is the distance traveled by the imbibition front from the open surface to the no-flow boundary. Another method used to model the process of spontaneous water imbibition into gas-saturated rocks is the Handy equation (Handy, 1960): 2 N wt = A2
Pc k wφS wf
µw
(4)
t
2
Kewen Li and Roland N. Horne
where A and Nwt are the cross-section area of the core and the volume of water imbibed into the core, respectively; µw is the viscosity of water; Swf is the water saturation behind the imbibition front. kw is the effective permeability of water phase at a water saturation of Swf. Pc is the capillary pressure at Swf. As discussed by Schembre et al. (1998), PckwSwf might be referred as the imbibition potential. According to the Handy equation, the amount of water imbibed into porous media is infinite when imbibition time approaches infinity, which is physically impossible. Li and Horne (2000) developed a method to calculate the capillary pressure and relative permeability at Swf from spontaneous water imbibition data. This method was verified experimentally in sandstone with high permeability but not yet in very low permeability rocks. In Eq. 1, η is the recovery in terms of recoverable resident fluid by spontaneous water imbibition. It is necessary to obtain the value of the residual gas saturation (Sgr) or the maximum water saturation (Swmax) in order to calculate η. But the residual gas saturation may not be available in certain cases. Therefore, we modified Eq. 1 as follows:
η* =
1 − S wi − S gr 1 − S wi
(1 − e − λt D )
(5)
where η* is the gas recovery in terms of gas originally in place (GOIP). Swi and Sgr are the initial water saturation and the residual gas saturation in rocks. λ and Sgr can be obtained simultaneously using a history match technique with the experimental data from spontaneous water imbibition. In this study, Swi was equal to zero. As a preliminary study, spontaneous water imbibition tests in air-saturated rocks from The Geysers have been conducted under both countercurrent and cocurrent imbibition conditions. The amount of water imbibed as a function of time has been measured. The experimental data of water imbibition rate have been up-scaled using the modified model (Eq. 5), which may be applied to design water injection projects for geothermal reservoirs. The experimental results of spontaneous water imbibition in the rocks from The Geysers geothermal field are compared with those in Berea sandstone with much higher permeability.
Experiments Distilled water was used as the liquid phase in this study, air was used as the gas phase. The surface tension of water/air at 20oC is 72.75 dynes/cm. The Geysers rock sample from a depth of 1410.1m was obtained from the Energy and Geoscience Institute; its porosity was about 4.5%. The matrix permeability of the rock sample was not available yet. The permeability of a nearby sample measured by nitrogen injection was about 0.56 md (after calibration of gas slip effect), which is probably attributed mainly to the fracture permeability. The length and diameter of this rock sample were 3.52 cm and 8.25 cm. The permeability and porosity of the Berea sandstone sample were around 1200 md and 24.5%; its length and diameter were 43.5 cm and 5.06 cm.
3
Kewen Li and Roland N. Horne
The apparatus to conduct spontaneous water imbibition tests in air-saturated porous media is the same as that described in Li and Horne (2000). A schematic of the apparatus is shown in Fig. 1. The Geysers rock sample was hung under a Mettler balance (Model PE 1600) which had an accuracy of 0.01g and a range from 0 to 1600 g. The water imbibed into the core sample was recorded in time by the balance using an under-weighing method and the real-time data were measured continuously by a computer through an RS-232 interface. The purpose of using the under-weighing method is to reduce the experimental error caused by water evaporation. Since the Berea sandstone sample was longer and heavier than The Geysers rock, its weight was beyond the range of the Mettler balance so another balance (Sartorius, Model BP6100) with a larger capacity was used instead. This balance had an accuracy of 0.1g and a range from 0 to 6100 g. Scale RS-232
Rock
LabView Liquid
Computer
Figure 1. Schematic of apparatus for spontaneous water imbibition test. Rock samples were dried by heating at a temperature of around 105oC until their weight did not vary during eight hours. The core sample was wrapped from the side using a heat-shrink tubing after it was cooled down and then assembled in the apparatus as shown in Figure 1. Water started to imbibe into the core when its base touched the water surface in the cocurrent water imbibition tests. The weight change of the core sample was then recorded with time. Figure 1 represents the case for cocurrent water imbibition tests at room temperature. For countercurrent water imbibition tests, the whole rock was immersed in the water. The procedure of countercurrent water imbibition was similar to that of the cocurrent imbibition except that the water level was over the top surface of the rock.
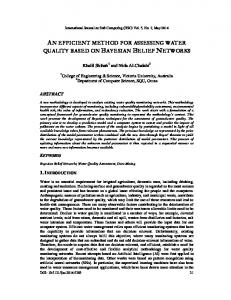
Results Spontaneous water imbibition tests in the air-saturated rock from The Geysers were conducted at room temperature under both cocurrent and countercurrent conditions. The experimental results and discussion are presented in this section. Fig. 2 plots the amount of water imbibition into the air-saturated Geysers rock as a function of time under both cocurrent and countercurrent conditions. The cumulative amount of water imbibed into the rock represented as the fraction of pore volume is equal to the water saturation in the rock or the gas recovery because the initial water saturation is equal to zero in this study. Fig. 2 shows that the values of the ultimate gas recovery were almost the same in both cocurrent and countercurrent imbibition cases. The value of the maximum water saturation in the rock from The Geysers by either cocurrent or countercurrent water imbibition is about 87.9% (see Fig. 2).
4
Kewen Li and Roland N. Horne
The maximum water saturation in a rock may be used as a parameter to evaluate the capacity of water injection into geothermal reservoirs. Evidently, the greater the maximum water saturation, the larger the capacity of water injection. Li and Horne (2000) found that maximum water saturation in sandstone was not affected by the initial water saturation and was about 66.5%. We can see that maximum water saturation changes significantly with rock properties according to the comparison of the value in Berea by Li and Horne (2000) to that in The Geysers rock here. This provides support to the use of maximum water saturation as a parameter to evaluate the capacity of water injection into geothermal reservoirs.
Water Imbibed (PV)
1.0 0.8 0.6
Cocurrent Countercurrent
0.4 0.2 0.0 0
2000
4000 6000 Time (minute)
8000
10000
Figure 2. Water imbibed vs. time under countercurrent and cocurrent conditions. The water imbibition rate vs. time is shown in Fig. 3. At early time, it was difficult to record water imbibition data accurately (Li and Horne, 2000), so the water imbibition rate data at early time is scattered. However, we can still see on Fig. 3 that the water imbibition rate under countercurrent conditions was higher than that under cocurrent condition at early time and lower at later time. Bourblaux and Kalaydjian (1990) reported that the oil recovery by countercurrent water imbibition was slower than that by cocurrent water imbibition in a sandstone core with a permeability of around 120 md and a porosity of 23 percent. Zhang et al (1996) observed a similar phenomenon in oil-water-Berea systems but they also found that the difference between countercurrent and cocurrent water imbibition was small in some cases. There may be differences in water imbibition between gas-water and oil-water systems. Unfortunately, few experimental data are available in the literature regarding the comparison of water imbibition behavior in the two different systems. On the other hand, the rock sample from The Geysers geothermal field had very low porosity and permeability. This might also influence the water imbibition behavior under cocurrent and countercurrent conditions. Further investigation is necessary in this area.
5
Water Imbibition Rate (g/min)
Kewen Li and Roland N. Horne
0.35 0.30
Cocurrent Countercurrent
0.25 0.20 0.15 0.10 0.05 0.00 0.1
1
10
100 1000 Time (minute)
10000 100000
Figure 3. Water imbibition rate vs. time under countercurrent and cocurrent conditions. Scaling up the experimental data of spontaneous water imbibition in gas-water systems is still a challenge. One possible approach is to deploy the scaling group as represented in Eq. 2, which is for oil-water systems. We substituted the average viscosity with the water viscosity here. Fig. 4 shows the relationship between the water imbibed and the dimensionless time represented by Eq. 2. Also shown in Fig. 4 is the history match to the experimental data using Eq. 5.
Water Imbibed (PV)
1.0 Cocurrent Cocurrent match Countercurrent Countercurrent match
0.8 0.6 0.4 0.2 0.0 0.1
1
10 100 1000 10000 100000 Time (dimensionless)
Figure 4. Water imbibition rate vs. dimensionless time. The value of Sgr obtained by the history match to cocurrent data is about 14.6%; λ is about 0.002177. From the countercurrent data, Sgr is about 17.1%; λ is about 0.000595. The match to the cocurrent data is a little better than to the countercurrent data. However, there are obvious differences between the cocurrent and countercurrent water imbibition by using the scaling group
6
Kewen Li and Roland N. Horne
represented by Eq. 2. Zhang et al. (1996) verified experimentally that cocurrent and countercurrent water imbibition data could be scaled up in oil-water systems. Fig. 4 shows that the scaling group represented by Eq. 2 may not be suitable to gas-water systems in a rock such as from The Geysers. Although Fig. 4 shows differences in the imbibition behavior between the cocurrent and countercurrent water imbibition, we speculate that the actual water imbibition at reservoir scale may be intermediate between the two. Therefore, we constituted an empirical model for the spontaneous water imbibition into the rock from The Geysers using the average values of Sgr and λ as follows:
η* =
1 − S wi − 0.1585 (1 − e − 0.00139t D ) 1 − S wi
(6)
The water imbibition rate at reservoir scale is obtained from Eq. 6 as follows: qw = 0.00139V p
1 − S wi − 0.1585 k σ cos θ − 0.00139t D e φ µ w L2c 1 − S wi
(7)
where Vp is the pore volume of the reservoir and qw is the water imbibition rate. The characteristic length for a matrix block in the reservoir is half the fracture spacing for countercurrent water imbibition. According to Eq. 7, we can calculate the water imbibition rate once porosity, permeability, surface tension and fracture spacing are known. The contact angle may be assumed zero in gas-water systems. The maximum water imbibition rate (qwmax) may be an important parameter to evaluate the feasibility of water injection into geothermal reservoirs. It can be calculated using Eq. 7 (tD=0). Note that the coefficient will be different if different units are used for the parameters in Eq. 7. For geothermal reservoirs with different rock properties, obviously, the reservoir that has large qwmax is a good candidate for water injection. The practical water injection rate in geothermal reservoirs is suggested to be less than the calculated qwmax. Otherwise most of the injected water may be produced very fast from the production wells through the highly distributed fractures in the reservoirs before the water imbibes into the matrix blocks, which is not what we expect. Fig. 5 shows the comparison of the relationship between the water imbibed and the dimensionless time in the rock from The Geysers to that in Berea sandstone under cocurrent conditions. Swmax by spontaneous water imbibition in Berea is much less than that in the rock from The Geysers. There is significant difference of water imbibition behavior between Berea and the rock from The Geysers. Fig. 5 also demonstrates the difficulty in scaling up spontaneous water imbibition data in gas-water systems for different rocks by using the scaling group of dimensionless time represented in Eq. 2.
7
Kewen Li and Roland N. Horne
Water Imbibed (PV)
1.0 Geysers Berea
0.8 0.6 0.4 0.2 0.0 0.01
0.1
1 10 100 1000 Time (dimensionless)
10000
Figure 5. Water imbibed vs. dimensionless time in Berea and The Geysers. The relationships between the water imbibition rate and the dimensionless time for both Berea and The Geysers rocks are shown in Fig. 6. As we observed experimentally, the water imbibition rate in Berea is much higher than that in The Geysers rock. Note that the unit of the water imbibition rate on Fig. 6 is pore volume per dimensionless time instead of per minute.
Imbibition Rate (pv/tD)
0.4 Geysers Berea
0.3 0.2 0.1 0.0 0.01
0.1
1 10 100 1000 Time (dimensionless)
10000
Figure 6. Water imbibition rate vs. dimensionless time in Berea and The Geysers. Is The Geysers field suitable for water injection according to the water imbibition data in comparison to that in Berea? The answer may be “yes”. The measured maximum water saturation in The Geysers was about 87.9%, which was much greater than that in Berea although the imbibition rate was lower. The large value of the measured maximum water saturation implies that the rock in The Geysers may be strongly water-wet (Li and Firoozabadi, 2000). Injected water can imbibe into the matrix rocks instead of bypassing directly from the injectors to the producers 8
Kewen Li and Roland N. Horne
through fractures. The successful practice of water injection into The Geysers to maintain reservoir pressure and protect the environment also demonstrates that water injection is appropriate for The Geysers geothermal field (Goyal, 1999). There may be a discrepancy between the use of maximum water saturation and imbibition rate to evaluate the feasibility of water injection. The measured maximum water saturation in The Geysers was much greater than that in Berea, which was positive for water imbibition in The Geysers; but the water imbibition rate was much lower, which was not positive for water imbibition in The Geysers. It may be necessary to find a solution to this problem. There may be some differences between water imbibition in air-water and steam-water systems. Therefore, we have embarked on a project to investigate spontaneous water imbibition in steamsaturated rocks at high temperatures using rocks from different geothermal fields. We are investigating the effect of rock properties such as porosity, permeability, and wettability on the maximum water saturation and water imbibition rate.
Conclusions The following conclusions may be drawn based on the present experimental results in both Berea and The Geysers rocks: An experimental technique, spontaneous water imbibition associated with the application of a modified model, has been developed to evaluate the feasibility of water injection into geothermal reservoirs. The maximum water saturation and the maximum water injection rate have been suggested as the parameters for the evaluation. The geothermal reservoirs with large values of maximum water saturation and maximum water imbibition rate are good candidates for water injection. The residual gas saturation by spontaneous water imbibition in the rock from The Geysers was about 12.1%, which was small. Little difference between cocurrent and countercurrent spontaneous water imbibition was observed; the ultimate recovery was almost the same in the rock from The Geysers. The maximum water saturation in The Geysers was much greater than that in Berea although the imbibition rate was lower. The experimental data demonstrate that The Geysers geothermal field is appropriate for water injection, which has been confirmed by the successful practice of water injection in the field.
Acknowledgments This research was conducted with financial support to the Stanford Geothermal Program from the US Department of Energy under grant DE-FG07-99ID13763.
References Aronofsky, J.S., Masse, L., and Natanson, S.G. (1958): “ A Model for the Mechanism of Oil Recovery from the Porous Matrix Due to Water Invasion in Fractured Reservoirs,” Trans. AIME 213, 17-19. Bourblaux, B.J. and Kalaydjian, F.J. (1990): “Experimental Study of Cocurrent and Countercurrent Flows in Natural Porous Media,” SPERE, 361-368.
9
Kewen Li and Roland N. Horne
Goyal, K.P.: “Injection Experience in The Geysers, California – A Summary,” paper presented at the 1999 GRC annual meeting held in Reno, NV, October 17-20, GRC Trans. 23. Handy, L.L. (1960): “Determination of Effective Capillary Pressures for Porous Media from Imbibition Data,” Trans. AIME, Vol. 219, 75-80. Li, K. and Firoozabadi, A. (2000): “Experimental Study of Wettability Alteration to Preferential Gas-Wetness in Porous Media and its Effect,” SPEREE, 139-149. Li, K. and Horne, R.N. (1999): “Accurate Measurement of Steam Flow Properties,” paper presented at the 1999 GRC annual meeting held in Reno, NV, October 17-20, GRC Trans. 23. Li, K. and Horne, R.N. (2000): “Characterization of Spontaneous Water Imbibition into GasSaturated Rocks,” SPE 62552, Proc. of the 2000 SPE/AAPG Western Regional Meeting held in Long Beach, California, June 19-23, 2000. Ma, S., Morrow, N.R., and Zhang, X. (1995): “Generalized Scaling of Spontaneous Imbibition Data for Strongly Water-Wet Systems,” paper 95-138, presented at the 6th Petroleum Conference of the South Saskatchewan Section, the Petroleum Society of CIM, held in Regina, Saskatchewan, Canada, October 16-18, 1995. Schembre, J.M., Akin, S., Castanier, L.M., and Kovscek, A.R. (1998): “Spontaneous Water Imbibition into Diatomite,” paper SPE 46211, presented at the 1998 Western Region Meeting, Bakersfield, California, May 10-13. Schechter, D.S. and Guo, B. (1998): “An Integrated Investigation for Design of a CO2 Pilot in the Naturally Fractured Spraberry Trend Area, West Texas,” paper SPE 39881, presented at the 1998 SPE International Petroleum Conference and Exhibition held in Villahermosa, Mexico, March 35, 1998. Zhang, X., Morrow, N.R., and Ma, S. (1996): “Experimental Verification of a Modified Scaling Group for Spontaneous Imbibition,” SPERE, November, 280-285.
10