30
JOURNAL OF SOFTWARE, VOL. 3, NO. 3, MARCH 2008
An Experimental Study of AJAX Application Performance Clinton W. Smullen III The University of Tennessee at Chattanooga, Chattanooga, TN, USA
[email protected]
Stephanie A. Smullen The University of Tennessee at Chattanooga, Chattanooga, TN, USA
[email protected] Abstract—An experimental study compared the performance of a real-life HTML application and an AJAX application that implemented the same user interface. A statistically significant number of trials were used to collect data on the performance of each when presented with the same tasks. Response size and service time performance measures were computed for the applications. AJAX provided significant performance increase in response size, thereby reducing bandwidth requirements. A typical user would see a performance increase in the response size of 55%. AJAX provided a mean service time improvement of approximately 16%. A typical user’s service time would improve by 21%. Index Terms—AJAX, performance, modeling, HTML
I. INTRODUCTION AJAX (Asynchronous JavaScript And XML) is a name applied to a set of technologies [1] designed to improve web application responsiveness. This set includes HTML, CSS, Dynamic HTML, client-side scripting (in either JavaScript/ECMAScript or Java), dynamic displays using the DOM model, data exchange using XML, and synchronous or asynchronous data retrieval using XMLHttpRequest. A good reference is Crane [2]. Mature commercial examples of the use of AJAX include Google Maps and Gmail; AjaxPatterns [3] now categorizes several hundred websites using mature AJAX applications.
In the typical web application, the browser presents an HTML page (with CSS and other components) to the user. When the user clicks on a link or submits a form, an HTTP request is made to the server (see Figure 1). The server returns one or more HTTP responses containing the new HTML page, along with CSS, graphics, etc. The current visible browser page is then entirely replaced by the new page. In an AJAX application, the AJAX code, in response to user actions, can perform behind-the-scenes server interactions unseen by the user while the client-side user interface remains active. The AJAX code sends an XMLHttpRequest to the server (see Figure 2), which returns XML data. The AJAX code then updates the visible page without replacing the entire page. The user does not move from page to page. Instead, the AJAX application responds dynamically to the user's actions, downloading updates in the background at the same time the user may be doing other things. The technical basics for AJAX are well understood. These basics (HTML, CSS, etc.) are covered in many typical web programming courses and training sessions. The use of AJAX in web programming is becoming more widespread as newer versions of browsers support XMLHttpRequest objects. The popularity of certain social networking websites that use AJAX has also increased the visibility of AJAX. However, very few studies have been published about the performance of actual AJAX applications. Using a “ridiculously simple” test application, Merrill [4] found a 61% improvement due to the use of AJAX. A commonly cited AJAX performance evaluation case study is White [5]. This AJAX application transferred on average 27% of the bytes that the traditional HTML application transferred. White defined the “performance increase” (PI) for a given measurement as (HTML value – AJAX value) / (HTML value) * 100
Fig 1. Classic web app
© 2008 ACADEMY PUBLISHER
Fig 2. AJAX web app
Using this, White reported a 73% performance increase for bytes transferred. Performance increases for the AJAX application were also observed in the task times taken by the users to accomplish the work. However, the effects of users’ skill levels and training (which could
JOURNAL OF SOFTWARE, VOL. 3, NO. 3, MARCH 2008
greatly affect the reported outcomes) were not assessed. This is especially relevant since the two applications did not implement the same user interface. Nevertheless, the AJAX application required fewer bytes to be transferred to carry out the tasks than did the HTML application and the users accomplished the assigned work in less time. These time savings can be directly translated into personnel cost savings. To gain insight into the performance effects of AJAX, this report studies an HTML application and an AJAX application which both implement the same user interface with the same “look and feel”. II. THE APPLICATION In [6], Smullen and Smullen compared the client-side performance of a real-life production HTML application and an AJAX application that implemented the same user interface. Experimental data was collected on the performance of each when presented with the same set of one-hundred ten tasks. Performance measures were computed for the HTML application and for the AJAX application. In [7], Smullen and Smullen initiated a study of the impact of AJAX on the server. The current study extends these works by collecting data on a statistically significant sample size, including server performance results. The application studied in this paper is an existing application that supplies real-time class information extracted from a university student information system (SIS). The user specifies one or more selection criteria (such as department, course/section, meeting days, start time/end time, location, instructor, open/closed) and the application returns a list of courses meeting the specified criteria and additional information about each of the courses (including the title and current enrollment). Figure 3 displays a typical query screen. The application uses a three tier model; the client communicates with the web server, which communicates with the database server. It is a production application, used daily by students and faculty, not a “test” application. The web
Fig 3. Typical application screen
© 2008 ACADEMY PUBLISHER
31
server is Apache, and the application uses PHP 5.05 and custom database code to connect with the legacy SIS database. All pages returned are validated XHTML 1.1. A. THE HTML APPLICATION The initial page loaded by a user contains the HTML form used to prepare a query. There is a significant amount of “branding” overhead on this page; all of the University’s pages use the same layout, navigation items, style sheet, and graphics. These common elements consist of two graphical images, a CSS style sheet, and JavaScript supporting the common page navigation links, and total 15573 bytes. These elements are linked to the HTML page and are static. For most browsers, they are downloaded once and cached, rather than being loaded with each query and response. A typical user would first load the HTML page containing the query form (27KB) and the common elements (15.2KB). The user prepares a query and submits the query to a server application. The server application queries the SIS. The data extracted from the SIS is formatted as XML. The server process then reads the XML data and applies an XSLT transform to produce XHTML. The web server returns the XHTML as the response to the client. The page returned as a response to a query links to the common elements described above, contains the HTML formatted list of courses in answer to the query (or a message if no results are produced), and also contains the HTML form needed to make another query. As a result, even a query that produces no results has a response page of about 27KB (plus the linked common elements). B. THE AJAX APPLICATION An AJAX version of the HTML application was coded. The AJAX version uses JavaScript to run the user interface and the XML handler. Care was taken to create the same “look and feel” for the AJAX version as is used in the HTML version. Both the AJAX and the HTML applications appear the same to the user at the presentation level, so the presentation page structure is the same, as are the graphics and common navigation elements. The Sarissa [8] libraries (version 0.9.6.1) were used to code the AJAX application. Sarissa is an open-source cross-browser set of libraries based on ECMAScript for developing AJAX applications. It is representative of the types of implementation libraries used for production AJAX. The code and libraries downloaded to the client to implement the AJAX interface for this application total 57KB. For this investigation, the AJAX application uses only synchronous AJAX XMLHttpRequest calls, for several reasons. Choosing courses is inherently a serial process. The next course selection often depends on the previous selections made. Work in progress will assess asynchronous AJAX performance, and this will appear in
32
JOURNAL OF SOFTWARE, VOL. 3, NO. 3, MARCH 2008
a future paper. Since the AJAX application reproduces the same “look and feel” as the HTML application, the use of asynchronous calls was not needed. This application does not exploit AJAX capabilities to enhance the user experience, preload data, or use eventtriggered processing. Hence this application represents in some sense a worst case for AJAX – all of the overhead but few of the advantages other than partial page refresh. The existing server application was used for the AJAX application. The central IT staff was extremely reluctant to modify a production system for this experiment. Since the query results from the server application are available in XML form, the existing production server application responds to an AJAX XMLHttpRequest with the existing XML output; it skips the XSLT transform and forwards the XML to the client. The AJAX application fetches the XML data produced by the production server process, which is then processed in the AJAX client for display. III. MODELING THE APPLICATIONS When a web application is contacted by a browser, an HTML page is loaded into the browser, including any graphical elements, stylesheets, or other linked elements. The client interacts with the user interface presented on the HTML page (such as by clicking a link or submitting a form) which sends an HTTP request message to the web server. The web server sends a new HTML page to the browser. This page replaces the previous page in the browser. When an AJAX application is contacted by a browser, an HTML page is loaded into the browser. This page contains the JavaScript needed to run the user interface and to issue XMLHttpRequest calls, the XML handler to format and present the results, and any other elements needed for the user interface, such as HTML code and stylesheets. The client interacts with the user interface presented on the browser page (such as by clicking a link, submitting a form, or triggering an event). The JavaScript code handles the user interface event, usually generating an XMLHttpRequest message to the web server. The web server sends XML data to the browser. This XML data is handled by the JavaScript code and presented to the user as HTML. Only the portion of the browser page needed to display the results is refreshed. Consider a task consisting of a sequence of operations carried out through an HTML web application. Accomplishing the task requires loading an initial page, and then successively loading pages 1 to n, where n is the number of steps needed to accomplish the task. For an AJAX application, accomplishing the task requires loading an initial page, and then successively handling responses 1 to m, where m is the number of steps needed to accomplish the task. For the two applications discussed in section II above, n=m since both implementations provide the same user interface. Define the following notation.
© 2008 ACADEMY PUBLISHER
H Pi Pa A Ui Ua
Size in bytes of the initial elements downloaded by the HTML web application Size in bytes of the ith HTML page loaded by the HTML web application Size in bytes of the average of the n Pi values Size in bytes of the initial elements downloaded by the AJAX web application Size in bytes of the ith AJAX response handled by the AJAX web application Size in bytes of the average of the n Ui values
The total bytes required to accomplish the task for each implementation is as follows. HTML: total bytes = H + (P1 + P2 + … + Pn ) = H + n*Pa AJAX: total bytes = A + (U1 + U2 + … + Un) = A + n*Ua For most AJAX applications, H < A, Pa > Ua, and it is likely that Pi > Ui for all i. If H > A and all Pi > Ui then the AJAX application has an initial download time better than the HTML application, and the download time for each response is better as well. The AJAX application is clearly preferred over the HTML application. If H = A and the Pi = Ui then the download times are equal. The greater effort and complexity required to code and maintain an AJAX application as compared to an HTML application would lead one to select the HTML application, unless the AJAX user interface presented advantages to the user. If H < A and the Pi < Ui then the HTML application is clearly preferred over the AJAX application based on download times and application issues, again unless the AJAX user interface presented significant advantages to the user. Since both of the applications discussed in section II implement the same user interface, the cognitive requirements on the user to view a page or response and to make a new request using the two interfaces are the same. If asynchronous XMLHttpRequest calls were supported, or if the AJAX user interface were significantly improved over the HTML user interface then for a particular application the user could process a response and make a new request using the AJAX interface faster than when using the HTML interface. The total time needed to accomplish the task is the sum of the time needed to download each of the pages or responses plus the cognitive time needed for the user to view the page or response and make a new request. When using a fast network connection such as a local area network, the download time is typically not readily visible to the user. For a moderate speed connection, it becomes visible only for large results, and for a dialup connection, the download time is always of concern. In these cases, the value of using asynchronous requests is diminished, since the slowness of the communications channel may serialize the responses. Downloading
JOURNAL OF SOFTWARE, VOL. 3, NO. 3, MARCH 2008
multiple responses concurrently over a slow link may actually cause the first of the responses to appear much more slowly than it would when using synchronous requests, thereby increasing the latency of the user interface. IV. DATA COLLECTION The initial load of the HTML application requires 42.2KB overhead (15.2KB for the common elements graphics, CSS, navigation JavaScript, and 27KB for the HTML page presenting the form). Thereafter, each response file is a complete XHTML page containing the results of the query, the HTML presentation, and the form. The common elements need to be loaded only once if the browser supports caching. The initial load of the AJAX application requires 99.2KB overhead (15.2KB common elements - graphics, CSS, navigation JavaScript, 27KB for the HTML presentation and form, and 57KB AJAX JavaScript code). All of these elements need to be loaded only once if the browser supports caching. This initial load could be made smaller if the AJAX application were not reproducing the graphics and look-and-feel of the existing HTML application. After loading the AJAX application, each response is an XML file containing the query result data and other information produced by the server application.
33
information. Thirteen-thousand two-hundred and sixty queries were posed using the production HTML form queries, and also posed using the AJAX form queries. The server logs produced by the Apache web server were also collected for the appropriate periods. The number of bytes returned for each query was recorded for the HTML query (quantity Pi above) and for the AJAX query (quantity Ui above). The size of each response does not include the common elements loaded from the client cache; the effects of caching common elements were studied in [6]. The HTML values ranged from 27KB, a query producing no courses, to 1.9MB, a query listing all courses for the fall semester. The AJAX response byte values ranged from 7.6KB to 1.1MB. A summary of these results is shown in Table I. TABLE I RESPONSE BYTES SUMMARY Response bytes N Min Max Mean Median Total
HTML Pi 13,260 27,650 2,017,914 129,828 63,996 1,721,523,273
AJAX Ui 13,260 7,746 1,196,618 68,234 28,996 904,776,578
PI 71.99 40.70 47.44 54.69 47.44
Using White’s definition of performance increase (PI), the performance increase for bytes transferred gives a percentage improvement when AJAX is used compared to HTML. A larger performance increase value is better, although any positive value represents a performance increase due to the use of AJAX. A performance increase of 47% means that the savings achieved by using AJAX as a percentage of the HTML size is 47%. The performance increase values for response bytes transferred are summarized in Table I. The mean performance increase was 47.44%, and the median was 54.69%. The maximum response size produced a performance increase of 41%, and the minimal response size produced a performance increase of 71%.
Fig 4. Data collection for the experiments
All data was collected by querying the production servers. Perl scripts were written to produce the exact queries generated by the HTML application and by the AJAX application (see Figure 4). Note that the server sees no differences from queries generated by the Perl scripts and by the two applications. The Perl scripts then collected the responses sent by the server, and recorded the size of each response and some client-side timing © 2008 ACADEMY PUBLISHER
Fig 5. Response size PI versus HTML response size (KB)
The performance increase for response size is nonlinear in nature, and varies with the size of the HTML
34
JOURNAL OF SOFTWARE, VOL. 3, NO. 3, MARCH 2008
response. Figure 5 shows a graph of the response size performance increase (in percent) versus HTML response size (in K bytes). The initial download size and the overhead are not accounted for in this calculation, only the response size. The smaller responses have greater performance increases than do the larger responses. The largest response sizes provide a performance increase of about 41%. A visual evaluation of the graph in Figure 5 indicates that it appears to exhibit exponential decrease. To test this observation, the quantity Byte Transfer Ratio is found by subtracting the performance increase percent from 100: Byte Transfer Ratio = 100 – performance increase. The Byte Transfer Ratio is thus Byte Transfer Ratio = (AJAX size/HTML size)*100 This represents the reduction achieved by using AJAX when compared to the HTML application. A Byte Transfer Ratio of 42% means that the size of the AJAX transfer is 42% of the size of the HTML transfer. A small Byte Transfer Ratio is better; it means the AJAX application is performing more efficiently than the HTML application. However any value less than 100% represents a reduction in bytes transferred when using AJAX.
41%. The predicted Byte Transfer Ratio values level off at about 55% under this model, giving a predicted performance increase of 45%. In a “real life” use of this application, a typical student presents about seven queries to build a semester schedule. Using the median response size values from Table I and totaling over seven queries produced the performance increase seen by a typical user, displayed in Table II. TABLE II TYPICAL USER’S IMPROVEMENT 7 queries HTML Σ Pi AJAX Σ Ui PI
Bytes 447,973 202,972 54.7%
H + Σ Pi A + Σ Ui PI
491,185 304,553 38.0%
A typical user would experience an improvement in response bytes transferred of almost 55%. If the initial download sizes (H and A) are added in, the actual improvement on total bytes transferred for the session, assuming no cached elements, becomes 38%. V. SERVER PERFORMANCE
Fig 6. Byte Transfer Ratio versus HTML response size (KB)
To determine if the Byte Transfer Ratio is distributed exponentially, the 13,260 values Ui/Pi for the application were used. Given Pi, an estimate of Ui/Pi is given by the function β(1- e-λPi). A nonlinear fit to the function β(1- eλPi ) was performed using the SAS 9.1 for Windows (SAS Institute, Cary, NC) NLIN procedure. The SAS NLIN procedure estimates for the parameters β and λ were β=55.68 and λ=0.0264. A Kolomogorov-Smirnov test revealed that the predicted distribution was a good fit for the observed distribution. Both the observed and the predicted Byte Transfer Ratio values (in percent) for the queries are shown in Figure 6, plotted against the HTML response size in K bytes. The actual Byte Transfer Ratio values level off at about 59%, so the performance increase is limited to © 2008 ACADEMY PUBLISHER
Additional performance gains result from the reduction in the load placed on the server. The server load reduction for the AJAX application is due to several factors. No XSLT processing is required for the AJAX application. For the HTML process, the number of bytes handled by the server process is proportional to the sum of the XML data and the HTML response page, since the process reads the XML data, processes the XSLT transform to produce the HTML response page, and the web server then sends the resulting HTML response page to the client. For the AJAX process, no XSLT processing is done; the XML data is simply forwarded to the client by the web server. This means the AJAX application results in significantly fewer bytes being handled by the server. Fewer bytes also means faster connection termination, which could increase the number of connections serviced. The number of bytes returned for a given query is deterministic, and does not vary with the load on the servers. To measure the effects of the use of AJAX on the servers (and hence the apparent responsiveness of the application to the user), the time to service each request was recorded from the Apache web server log. An examination of a small sample of these times collected by two clients showed that they had wide variations due to the exogenous load applied to the servers. To reduce the variance of the service times, repetitions of a set of 121 queries were performed for both the HTML and the AJAX applications. A summary of the response times in seconds for the total of 13,260 queries is presented in Table III.
JOURNAL OF SOFTWARE, VOL. 3, NO. 3, MARCH 2008
The service times summarized in Table III were statistically tested and determined to be not statistically linearly related to the size of the response in bytes. This means that additional processing is performed on the servers to prepare the responses to be sent to the client.
35
and there was no correlation between the size of the response and the reception of poor service.
TABLE III RESPONSE SECONDS SUMMARY Response seconds N Min Max Mean Median Std Dev Total
HTML 13,260 0.31 37.58 1.53 0.89 2.44 20,252.32
AJAX 13,260 0.25 34.42 1.29 0.73 2.26 17,090.15
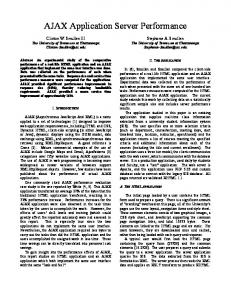
Some of the queries were presented to the server using HTTP/1.0, with one request and response per web server connection. Some of the queries were presented to the web server using HTTP/1.1 with “keep-alive”, which allowed several request/response pairs per web server connection. There were no statistically significant differences between the sets of data collected using these two methods. For this application, the service time required to generate the data for the response dominates the total request service time, and there was no significant savings to the user when maintaining an open server connection to service sequential requests, as proposed by Windley in [9] for “Comet” AJAX applications to provide low latency data to AJAX client applications. As previously mentioned, all data was collected by querying the production servers. The production HTML application averaged 180 page views per hour (3 per minute) over the months of October, November, and December of 2006; the peak day averaged 676 page views per hour (over 11 per minute). The queries for this study were performed sequentially, but response times suffered due to contention for server resources from the ongoing production demands on the servers, including the queries from other users. The set of queries reported represents a sample of “real life” responses. Figure 7 graphs the response time in seconds for 110 separate trials for the AJAX response to the “List all courses” request. This request returned 1,196,681 bytes. The mean response time for this query, shown as a dashed line in Figure 7, was 12.69 seconds, and had a standard deviation of 2.59 seconds. The minimum response time for this query was 10.62 seconds, and the maximum response time was 31.02 seconds. The peak value is truncated in Figure 7 for economy of presentation, otherwise the graph would need to be almost twice as high. The random nature of the poor response times is evident in this graph. While the large portion of requests received reasonable response service, a few of the requests received very bad response service, just as in “real life”. These poor response times were seemingly random - not predictable, not repeatable, there was no correlation between poor HTML service and poor AJAX service, © 2008 ACADEMY PUBLISHER
Fig 7. Response time for each of 110 trials of the same query
Table IV summarizes the response times for four groups of requests. The All group includes all queries. The 99% group includes 99% of the queries; it excludes queries with the longest 1% of response times. Correspondingly, the 95% group excludes the longest 5%, and the 90% group excludes the longest 10%. The service values for the “best” 95% of all requests are summarized in the 95% column in Table IV. Note the improvement of the coefficient of variation (CV) values when moving from the “all” group down to the 90% group. For HTML service, the CV decreases from 160 to TABLE IV RESPONSE TIMES IN SECONDS HTML
All
N
13,260
99%
95%
90%
13,129
12,597
11,935 0.31
Min
0.31
0.31
0.31
Max
37.58
15.38
4.36
2.65
Mean
1.53
1.34
1.10
0.98
Median
0.89
0.87
0.82
0.75
Std Dev
2.44
1.53
0.82
0.64
159.7
114.1
74.0
65.0
20,252
17,618
13,872
11,685
28.6%
53.7%
59.3%
All
99%
95%
90%
CV Total % CV Improvement AJAX
13,260
13,128
12,598
11,935
Min
0.25
0.25
0.25
0.25
Max
34.42
11.26
3.48
2.19
Mean
1.29
1.11
0.92
0.82
Median
0.73
0.71
0.65
0.60
Std Dev
2.26
1.24
0.67
0.59
N
CV Total % CV Improvement
175.2
111.6
73.4
65.9
17,090
14,541
11,545
9,775
36.3%
58.1%
62.4%
36
JOURNAL OF SOFTWARE, VOL. 3, NO. 3, MARCH 2008
65, an improvement of 59%. Similarly, the CV for AJAX service improves from 175 to 66, an improvement of 62%. Figure 8 illustrates the reduction in size of the range of the values as well as the reduction of the standard deviation for each of the samples shown in Table IV. The vertical scale has been made nonlinear to more clearly show the areas of interest in the plots. The size of each box represents the range of values from the minimum to +1 standard deviation above the mean. The median value is the horizontal line in each box, and the maximum value is indicated by the T line. Note the reduction in variation when moving from the All group to the 90% group for both the HTML and the AJAX data.
Calculating the performance increase from the means of the 95% groups in Table IV (that is, the improvement of the mean response times of the two 95% level groups) gives an improvement of 16.8%. Calculating the performance increase from the means in Table IV (that is, the improvement of the mean response times of all of the data) gives an improvement of 15.6%. TABLE V TYPICAL USER’S IMPROVEMENT 7 queries HTML AJAX PI 95% HTML 95% AJAX PI
Response bytes 447,973 202,972 54.7%
Response secs 6.209 5.117 17.6% 5.74 4.55 20.7%
In a “real life” use of this application, a typical student presents seven queries to build a semester schedule. Using the median values from Tables I, III and IV and totaling over seven queries produces Table V. A typical user would experience an improvement in response bytes transferred of about 55%, and an improvement in service time of almost 21%. VI. CONTENTION
Fig 8. Box plot of values from Table IV.
An example drawn from Table IV shows that 95% of HTML requests received service in 4.36 seconds or less. In the longest 5%, one unfortunate response received a service time nine times as large. For AJAX requests, 95% received service in 3.48 seconds or less, while the longest AJAX request received a service time ten times as large. The averages for the 95% group give better estimates of expected service times for typical users of the application than do the averages for the ALL group. Using White’s definition of performance increase, the mean of the performance increases for response size is 56%. This is found by computing the performance increase for each query (pairing the HTML and the AJAX responses for that query) and then calculating the mean of these values. Since the response size is deterministic, the performance increase for response size for a given query remains the same for every repeat of the query. Determining the performance increase for response time is more complicated due to the randomness in the data. Computing the performance increase for response time for each query and then calculating the mean of these values gives an improvement of 2.4%. However, for about 4% of these queries, the AJAX response time was larger than the HTML response time. Indeed, one query resulted in an AJAX performance “increase” of -7135%.
© 2008 ACADEMY PUBLISHER
An additional experimental procedure was developed to estimate the contention at the web server due to the time needed for the application to serialize the data base queries. The 13,260 queries (see Tables I-V) used the existing production application on the server. This application uses a process on the web server to serialize the data base queries from all users of the application to send over the application’s database connector to the data base server. All requests from the web application were serialized and transmitted over this connector to the data base server. The contention test web application was modified to use a separate database connector for the data base queries. This eliminated the contention for the connector from other users’ queries, and enabled the development of an estimate of the impact of the contention on the server’s response times. Note that the queries sent to the test application were serialized by the test software; no contention occurred due to test queries. The results from this test, however, do not apply to the responses seen by a typical user of this application, since access to the test system is not public. Table VI summarizes the response time results of 1968 queries, divided into four groups – HTML and AJAX combined, and HTML and AJAX separate. The combined queries used the production process while the separate queries used the test process and its separate database connector. The number of bytes returned was the same for corresponding HTML and AJAX queries regardless of which database connector was used, and is not shown in Table VI. Comparing the response times of the combined and the separate groups shows that the
JOURNAL OF SOFTWARE, VOL. 3, NO. 3, MARCH 2008
average server response time declined for this test for both the HTML and AJAX queries. The mean HTML response times declined by an average of 14.15%, and the AJAX times declined an average of 2.7%. TABLE VI RESPONSE TIMES FOR TEST SYSTEM Response secs N Min Max Mean Median Std CV Total
Combined HTML AJAX
492 0.38 40.42 2.12 1.04 4.40 207.57 1042.35
492 0.30 28.99 1.47 0.88 2.34 159.51 721.01
efficient database query process is more likely to reduce the wait time for the server query process for all users than would the use of the AJAX application. When the client-server bandwidth needs to be improved, AJAX can be effectively utilized. However, AJAX can have less impact on server utilization than on the client-server bandwidth.
Separate HTML AJAX
492 0.33 27.64 1.82 1.04 2.96 162.19 897.64
492 0.28 28.39 1.43 0.79 2.17 151.61 704.84
However, the variability in the response times remained large, as evidenced by the standard deviation and CV values in Table VI. Eliminating the web server’s query marshaling time confirms that the randomness in response times is primarily due to contention for the data base server. VII. CONCLUSIONS The savings in transmission time between the server and client are significant due to the average 56% reduction in the bytes making up a response. AJAX can significantly reduce the bandwidth required for the client to receive a response, or can improve the response of the application as perceived by the user by presenting a response faster than the traditional HTML application. However, the reduction in time that the server spends generating a query (16%) indicates that AJAX is less useful as a server productivity tool. While eliminating the query marshaling time does improve the average response time, it does not reduce the variability in the response times. In the case of this application, a more
© 2008 ACADEMY PUBLISHER
37
ACKNOWLEDGMENT Dan Chase assisted in the collection of data for this work. REFERENCES [1] [2] [3] [4] [5] [6]
[7]
[8] [9]
L. Paulson, “Building rich web applications with AJAX”, IEEE Computer, 38(10), 2005, 14-17. Crane, Pascarello, James, Ajax in Action, Manning Publishing Company, Greenwich, CT, 2005. AJAX Patterns, “Ajax Examples”, retrieved August, 2007, http://ajaxpatterns.org/Examples. C. Merrill, "Using AJAX to Improve the Bandwidth Performance of Web Applications", Web Performance.com, January 2006 A. White, “Measuring the Benefits of Ajax”, retrieved March, 2006, http://www.developer.com/xml/article.php/3554271. C. Smullen, S. Smullen, “Modelling AJAX Application Performance”, 524-074, Web Technologies, Applications, and Services 2006, ed. J.T. Yao, ACTA Press, Calgary, 2006. C. Smullen, S.Smullen, "AJAX Application Server Performance", Proceedings of the IEEE SoutheastCon 2007 (CH37882), March 22-25, 2007, Richmond, Virginia, pp. 154-158. Sarissa, http://sarissa.sourceforge.net/ retrieved March 2005. The Sarissa project page is found at http://sourceforge.net/projects/sarissa. P. Windley, “Comet: Beyond AJAX”, retrieved December, 2006, http://www.irishdev.com/NewsArticle.aspx?id=2173.