When porting an application to a parallel computer architecture, the program ... programming paradigms, but we will restrict our discussion on OpenMP [ 101.
An Expert Assistant for Computer Aided Parallelization Gabriele Jostl*, Robert Chun2, Haoqiang Tin1, Jesus Labarta3 and Judit Gimenez3 NAS Division, NASA Ames Research Center, Moffett Field, CA 94035-1000, USA
igjost,f?iinjBnas.nasa.gov Computer Science Department San Jose State University. San Jose. CA 95192, USA Robert.Chun @sjsu.edu European Center for Parallelism in Barcelona-Technical University of Catalonia (CEPBA-LPC), cr. JGi& Girona 1-3, Modul D6,08034 Barcelona, Spain Cjesusjudit} @ cepba.upc.es
Abstract. The prototype implementation of an expert system was developed to assist the user in the computer aided parallelization process. The system interfaces to tools for automatic parallelization and performance analysis. By fusing static program structure information and dynamic performance analysis data the expert system can help the user to filter, correlate, and interpret the data gathered by the existing tools. Sections of the code that show poor performance and require further attention are rapidly identified and suggestions for improvements are presented to the user. In this paper we describe the components of the expert system and discuss its interface to the existing tools. We present a case study to demonstrate the successful use in full scale scientific applications.
1 Introduction When porting an application to a parallel computer architecture, the program developer usually goes through several cycles of code transformations followed by performance analysis to check the efficiency of parallelization. A variety of software tools have been developed to aid the programmer in this challenging task. A paralIeIization tool will usually provide static source code analysis information to determine if and how parallelization is possible. A performance analysis tool provides dynamic runtime information in order to determine the efficiency of time consuming code fragments. The progammer must take an active role in driving the analysis tools and in interpreting and correlatin,a their results to make the proper code transformations to improve parallelism. For large scientific applications, the static and dynamic analysis results are typically veiy complex and their examination can pose a daunting task for the user. In this paper we describe the coupling of two mature analysis tools by an expert system. The tools *
The author is an employee of Computer Sciences Corporation
2
G. Jost. R. Chun, H. Jin. J. Labarta and J. Gimenez
under consideration are the CAPO [3] parallelization tool and the Paraver [ 121 performance analysis system. The techniques described in this paper are applicable to many parallel programming paradigms, but we will restrict our discussion on OpenMP [ 101 parallelization for shared memory computer architectures. OpenMP supports loop level parailelization in the form of compiler directives. The program developer has io insert the directives and specify the scope of the variables. The CAPO parallelization tool was developed to aid the programmer in this task. CAPO automates OpenMP directive insertion into existing Fortran codes and allows user interaction for an efficient placement of the directives. This is achieved by use of extensive interprocedural analysis - __ _. . . . _ _ . __. . . . iiii;.".cisitj:._ fIOiii CAf-' L2jjiio.w knowii as y&-a."-",isej .*nicn .*as Geveiopia at of Greenwich. Dependence analysis results and other static program structure information are stored in an application database. The Paraver performance analysis system is being developed and maintained at the European Center for Parallelism in Barcelona (CEPBA). Its major components are the tracing package OMPItrace [9],.a graphical user interface to examine the traces, and an analysis module for the computation performance statistics. Therest of the paper is structured as follows: In Section 2 we describe the prototype implementation of our expert system. In Section 3 we present a case study to show the usefulness of the system. In Section 4 we discuss some related work and draw our conclusions in Section 5. ~
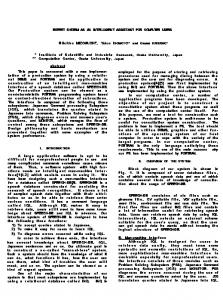
2 The Expert System Prototype Implementation An intelligent computerized parallelization advisor was developed using an expert system implemented in CLIPS ("C" Language Integrated Production System) [ 11. By performing data fusion on the static and dynamic analysis, the expert system can help the user to filter, correlate, and interpret the data. Relevant performance indices are automatically calculated and correlated with program structure information. The overall architecture of our program environment is depicted in Figure 1. In the following we describe its various components. Selective Soui-ce Code Instiumeiztatiorz:We use the Paraver OMPItrace package for instrumentation and tracing of the application. Compiler generated routines for parallelized code segments are dynamically traced. User level subroutines have to be manually instrumented in the source code. Instrumentation of all subroutines may introduce at lot of overhead. For critical code segments, on the other hand, it is often desirable to obtain information on a finer granularity than a subroutine call. We use the CAPO code transformation capability to automatically insert tracing library calls into the code. The program structure information from the application database is used to decide where to insert these calls. In our prototype system we only instrument routines that are not contained within a parallel region or a parallel loop and that contain at least one DOloop. Furthermore we instrument outermost serial loops. More details on the automatic selective instrumentation can be found in [4]. Automatic Retrieval of Perfonnurice lizdices: We have extended the Paraver SYStem by Paramedir, a non-graphical command line interface to the analysis module. The specification of Paraver trace file views and metric calculations can be saved to reusable
3
Fig. 1. Axhitecture of t!x expen system p r o - M n g envircnrnent. The Pard:eLizztion Assistant Expert System fuses progam structure knowledge and performance trace informarion to aid the user narrowing down performance problems. The user can SUU interact directly with the parallelization and performance analysis tools for fine tuning of the applications performance.
configuration files. Parsmedir accepts the same trace and configuration files as Paraver. This way the same information can be captured in both systems. Paramedir supports the programmability of performance analysis in the sense that complex performance metric,. determined by an expert user. can be automatically computed and processed. The detailed human driven analysis can thus be translated into rules suitable for processing by an expert system. Details on Parainedir can be found in [SI. Examples for memcs that are automatically calculated for the instiumented code sections are parallel ~ l l ~-^-. J e l sequential I~y. I'i-iictiofis. granularity- of the paraiielization. and \'xiation of time. instructions. and L2 cache misses beti3,ern the different threads. The automatically calculated performance metrics are then stored in a table. Inforrizarion Fusion: After calculating the perfomance indices. the expert system extracts program structure information from the application database. At this point the main interest is the optimal placement of OpenMP directil.es. The p r o t o t q e implementarion retrieves the type of tLe instrumented code segment. such as loop or subroutine. the loop identifier, and the type of the loop, such as being parallel or sequential. Rule Based Anal~sis:The expert system iises observations to infer reasons for poor performance. The obser\.ations are a list of facts about the calculated performance metrics for the calculated code segments. Examples of fact are: "the subroutine takes 50% of the execution time" or "the \,ariatior! of executed instructions among the threads is high". The metrics are compared to ernpincal!y determined threshold values in order IO determine what is hish and what is IOU-. Conclusions are inferred through a set of rules that interpret certain pat:erns as reasons for poor performance. A n exaiiipk aouid be a ruie of the farm: - If: The code segment takes a large amount of time and the parallel efficiency is low and t h e x are larze sequsnrial sections and the granularity of the para!le!izatior! is fine
G. Jost. R. Chun. €3. fin, J. Labarta and J. Gimenez
4
- Then: Try to move the parallelization to an outer level An illustration of tlle reasoning is given in Figure 2. The conclusions are presented to the user either as ASCII text or via the CAPO user interface. This will be discussed in the case study presented in Section 3.
Fig.2. Example of facts and conclusions within the expert system. A set o f rules is applied to observed facts to determine patterns of causes for poor performance.
3 A CaseStudy The parallelization assistant expert system was tested on several full scale scientific applications. In order to give a flavor of its usability we present the analysis of the PSAS Conjugate Gradient Solver. The code is a component of the Goddard EOS (Earth Observing Systems) Data Assimilation System. It contains a nested conjugate gradient solver implemented in Fortran 90. Figure 3 shows a Paraver timeline view of one of the time consuming portions of the code. The shaded areas display computation time spent in parallel loops. Visual inspection immediately shows an imbalance between the threads, with thread number 1 spending a lot more time in parallel computations. The reason for the imbalance is, that the amount ofcalculations per iteration differs greatly. By default. the iterations of a parallel loop are distributed block-wise among the threads, which is a good strategy if the amount of work per iteration is approximately the same. In the current case thread number 1 ended up with up with all of the computational intensive iterations, leaving the other threads idle for a large amount of time. The OpenMP directives provide clauses to schedule work dynamically. so that whenever a thread finished its chunk of work, it is assigned the next chunk. This strategy should only be used
An Expert Assistant for Computer Aided Parallelization
5
if the granu!arity of ttie work chunks is sufficiently coarse. The expeit system was able to detect the imbalance and its possible cause. The rule which fired for this particular case was:
Fig.3. Paraver umeime view of ome spent UI useful computauons witnin parue1 ~oopsay 4 threads. Useful computation time is shaded, non-useful time is white. The view shows an obvious imbalance, with the master thread spending more time in parallel computations.
- If: The code segment takes a large amount of time and the para!lel
efficiency is low and there is a large variation in the amount of useful computation time and there is a large variation in the number of instructions within the parallelized loops and
the granularity of the parallelization is sufficiently large
- Then: Try dynamic scheduling in order to achieve a better work load balance. The expert system analysis output is generated as an ASCII file. The user has the possibility to display the analysis results using the CAPO directives browser. This way the dynamic performance analysis data is integrated with program structure information. An example is shown in Figure 3. The user is presented with a list of time consuming loops and subroutines. Selecting an item from the list displays the corresponding expert system analysis and highlights the corresponding source in the directive browser window. For the current case it helps the user to identify loops which suffer from workload imbalance. The expert system analysis provides guidance through the extensive set of CAPO browsers.
4
Related Work
There are several research efforts on the way with the goal to automate performance analysis to integrate performance analysis and parallelization. We can only name a few of these projects. KOJAK [6] is a collaborative project of the University of Tennessee and the Research Centre Juelich foi the development of a generic automatic performance analysis environment for parallel progams aiming at t5e automatic detection of performance bottlenecks. The Paradyn Performance Consultant [8] automatically searches for a set of performance bottlenecks. The system dynamically instruments the application in order to collect performance traces. The URSA -MINOR project [111 at Purdue University uses program analysis information as well as performance trace data in order to guide the user through the program optimization process. The SUlF Explorer [7,13] Parallelization Guru developed at Stanford University uses profiling data to bring the user's attention to the most time consuming sections of the code. Our approach differs from the previous work in that we are integrating two mature tools. Our rule based approach takes advantaze of the high degree of flexibility in collecting and analyzing information provided by the underiring tools.
6
G. Jost, R. Chun, H. An, J. Labarta and J. Gimenez
Fig.4. The expert system analysis can be displayed in CAPO’S Dynamic Analysis Window. Selecting a particular routine or loop, the corresponding source code is highlighted in the Directives Browser window. The Why Window displays information about the status of the parallelization of the code, such as the scope of variables or dependences that prevent parallelization.
5
Conclusions
We have built the prototype of an expert assistant to integrate two mature tools for compurer aided paralIelization and performance analysis. The systez helps the riser in navigating and interpreting the static program structure information, as well as the accompanying dynamic run-time performance information so that more efficient optimization decisions can be made. It enables the user to focus his tuning efforts on the sections of code that will yield the largest performance gains with the least amount of recoding. Using the expert system approach in a case study has demonstrated how to fuse data from the static and dynamic analysis to provide automated correlation and filtering of this information before conveying it to the user. The &st conclusion we draw is that a number of relatively simple rules can capture the essence of the human expert’s heuristics needed to narrow down a parallelization related performance problem. Secondly, we found it to be very important to be able to switch to the direct-usage of the tools at any point during the analysis process. The expert system analysis rapidly guides the user to code se,gnents, views, and effects that require futher detailed analysis with either CAPO or Paraver. This detailed analysis will in turn often lead to the design of new rules which can then be included in the automated process.
An Expert Assistant for Computer Aided Parallelization
7
A4cknowIedpents This work was supported by NASA contract DTTS59-99-D-O0437/A61812Dwith Computer Sciences CorporatiodAMTI, by the NASA Faculty Fellowship Program, and by the Spanish Ministry of Science and Technology, by the European Union FEDER progam under contract TIC2001-0995-CO2-01,and by the European Center for Parallelism of Barcelona (CEPBA). We thank the CAPTools development team for many helpful discussions and the continued support of our work.
References 1. CLIPS: A Tool for Building Expert Systems, hnp:l/vrww.ghg.net/clips/CLIPS.hrml. 2. C.S. Ierotheou, S.P. Johnson, M. Cross and P. Leggett, ‘‘Computer Aided Parallelisation Tools (CAPTools), Conceptual Overview and Performance on the Pardlelisation of Structured Mesh Codes,” Parallel Computing, 22 (1996) 163-195. http://wuw.parallelsp.comlparawise.htm. 3. H. Jin, M. Fruml;in and J. Yan, ”Automatic Generation of OpenMP Directives and Its Application to Computational Fluid Dynamics Codes,” Proceedings of Third International Symposium on High Performance Computing (ISHPC2000),Tohyo, Japan, October 16-18,2000. 4. G. lost, H. Jin, J. Labarta and J. Gimenez, “Interfacing Computer Aided Parallelization and Performance Analysis,” Proceedings of the International Conference of Computational Science - ICCSO3, Melbourne, AustraIia, June 2003. 5. G. lost, J. Labarta and J. Gimenez, “Paramedir: A tool for programmable Performance Analysis”, Proceedingsof the InternationalConference of Computational Science - ICCSO4. Krakow, Poland, June 2004. 6. Kit for Objective Judgment and Knowledge based Detection of Performance Bottlenecks, http://www. fz-jueIich.de/zam/kojak/. 7. S. Liao, A. Diwan, R.P. Bosch, A. Ghuloum and M. Lam. “SULF Explorer: An interactive and Interprocedural Parallelizer,” 7th ACM SIGPLA!! Symposium on Principles & Practice of Parallel Programming,Atlanta, Georgia. (1999). 37-48. 2. 2.Y. Xiiicr, ;Vim. Laflaghan. J. M. Car@e, J. K. Hollingsworth, R. B. Inin, K.L. Karavanic, K. Kunchithhapdam and T.Newhall, ”The Paradyn Parallel Performance Measurement Tools,” IEEE Computer 28, 11, pp.3747 (1995). 9. OMPItrace User’s Guide, http://www.cepba.upc.es/paraver/manuali.htm. I 0. O p e M FortranlC Application Program Interface, http://www.openmp.org/. 11. I. Park, M. J. Voss. B. Armstrong and R. Eigenmann, “Supporting Users’ Reasoning in Performance Evaluation and Tuning of Parallel Applications,” Proceedings of PDCS’2000, Las Vegas, hV, 2000. 1 2 . Paraver. http://www.cepba.upc.es/paraver/. 13. SLJIF Compiler System http://suif.stanford.edu/.