An Extension of Iterative Closest Point Algorithm for 3D-2D Registration for Pre-treatment Validation in Radiotherapy Xin Chen, Martin R. Varley, Lik-Kwan Shark ADSIP Research Centre University of Central Lancashire,U.K.
[email protected],
[email protected],
[email protected]
Abstract The paper presents a novel feature-based 3D-2D registration method to align a pair of orthogonal X-ray images to the corresponding CT volumetric data with full 6 degrees of freedom by combining the Iterative Closest Point (ICP) and Z-buffer algorithms. The proposed method has been evaluated using simulated data as well as skull phantom data. For the latter, the alignment errors were found to vary from 0.04 mm to 3.3 mm with an average of 1.27 mm for translation, and from 0.02 to 1.64 with an average of 0.82 for rotation. With the accuracy comparing favourably against other feature-based registration methods and the computational load being much less than intensity-based registration methods, the proposed method provides a good basis for validation of patient and machine set-up in the pretreatment procedure in radiotherapy.
1. Introduction Radiotherapy is a major cancer treatment approach. In radiotherapy, undesirable side effects may be caused by healthy cells being exposed to radiation. In order to reduce the damage to healthy tissues as well as eradicate the tumour accurately, the accuracy of machine set-up and patient placement are crucial. Before treatment delivery, the patient’s pose (position and orientation) within the treatment device must be accurately determined according to the 3D CT planning data. A treatment simulation phase is therefore carried out to validate machine and patient set-up to improve the treatment accuracy, and involves matching a pair of orthogonal kilo-volts X-ray images (anterior-posterior and lateral views) taken from the patient with the corresponding digital reconstructed radiographs (DRRs) derived from the 3D CT planning data to determine the final machine and patient set-up for treatment delivery. At present,
Glyn S. Shentall, Mike C. Kirby Rosemere Cancer Centre Royal Preston Hospital, U.K.
[email protected],
[email protected]
clinicians are required to identify and match manually some rigid features from the kilo-volts X-ray image pair (known as the simulator images) and the corresponding DRR image pair in order to obtain the data for position modification in three dimensions. The main problems with this approach are (1) low resolution of the DRR images giving rise to errors in visual comparison; and (2) only translation errors are considered without taking out-of-plane rotations into account. In addition, the matching accuracy depends highly on the clinician’s experience which may directly affect the quality of the final treatment. Among the automatic methods proposed for 3D-2D registration, there are mainly two different approaches. The first approach is based on image features [3, 6] and requires feature extraction from both 2D X-ray and 3D CT images. Once the feature extraction is done, the registration process can be very fast, and the registration accuracy depends mainly on the extraction accuracy. The second approach is based on pixel and voxel intensity [8] and requires DRRs to be generated from the 3D CT data. The unknown pose of the CT volume is estimated by optimising the similarity measurement between DRRs and 2D X-ray images. As heavy computation load is the main problem for the intensity-based methods, many methods have been proposed to accelerate the speed of generating DRRs [5, 8]. For the proposed method, 3D treatment planning CT data and two orthogonal kilo-volts X-ray images (anterior and lateral views) are used to achieve 3D-2D registration, and it is a feature-based approach based on a combination of the ICP and Z-buffer algorithms. Section 2 presents the projection model used for the simulation machine (simulator) as well as estimation of its intrinsic parameters. This is followed by image pre-processing in section 3, the proposed 3D-2D registration method based on ICP in section 4, and some experimental results using both synthetic and phantom data in section 5. Finally, conclusions and further work are given in section 6.
Proceedings of the International Conference on Medical Information Visualisation─BioMedical Visualisation (MediVis'06) 0-7695-2603-9/06 $20.00 © 2006
IEEE
2. Projection Model
where
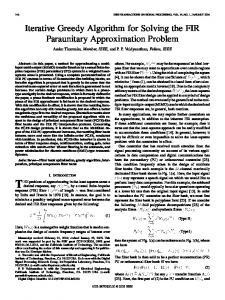
In order to match the 3D CT data of a patient with the corresponding 2D X-ray images, the exact projection geometry has to be known accurately. Figure 1 shows the projection model used for the simulator, where the isocentre is defined as a point in space about which the gantry rotates and towards which the beam points. In the simulator used, the isocentre is fixed at a distance of 100 cm from the X-ray source, whereas the distance of the X-ray image detector is variable. In addition, the simulator images are normally scaled to the isocentric plane (the plane orthogonal to the X-ray beam axes and containing the isocentre) based on the centimetre grid on the simulator image (see Figure 2), thereby enabling the displacement to be measured consistently in physical distance.
(2) where and denote and functions, subscripts , and denote the rotation angles around the three axes and are the translations in the three direcand , tions. Furthermore, in Eqn. (1) is the translation matrix from the machine coordinate system to the source coordinate system, and is the intrinsic parameter matrix given by
is the composite transformation matrix given by
(3) where is the focal length, and are the physical pixel sizes along the and axes. As the intrinsic parameters in vary from one patient to another or even for the same patient with different machine settings, they need to be accurately estimated along with the 6 extrinsic parameters in in order to find the optimum pose of the 3D CT data to yield an orthogonal projection that matches the orthogonal X-ray image pair. Figure 2 shows a simulator image of a skull phantom with a centimetre grid, where and , are deterthe coordinates of the optical centre, mined based on the crossover point of the horizontal and vertical centimetre grids in the image as it coincides with the isocentre.
Figure 1. Perspective projection geometry for simulator.
, and define In Figure 1, the coordinates axes the source coordinate system with the origin at the radia, and define the machine tion source, whilst coordinate system with the origin at the isocentre. Addiand define the optical centre that is normal tionally, to the imaging plane in the direction of the radiation beam. With the position of the X-ray source fixed, different patient placements or different poses of 3D CT data will produce different 3D projections on the 2D image plane. The relationship between the coordinates of a 2D image pixel, , and its corresponding 3D object point , in the machine coordinate system, can be expressed as (1)
Figure 2. Simulator image with centimetre grid.
With the simulator image scaled to the isocentric plane according to the attached centimetre grid, the remaining two
Proceedings of the International Conference on Medical Information Visualisation─BioMedical Visualisation (MediVis'06) 0-7695-2603-9/06 $20.00 © 2006
IEEE
intrinsic parameters can be estimated as follows. From the geometry shown in Figure 1, the coordinates of a pixel in , can be related to the coordinates of the image plane, the 3D object in the source coordinate system by
no constraints on data organisation and complexity. The simplest form of implementation is on a polygon by polygon basis. To generate a 2D projection using the Z-buffer algorithm based on triangles, the following steps need to be followed:
(4)
Define an image plane with all the initial values set to infinity.
By selecting two pixels along the horizontal and vertical and as shown in centimetre grid, such as Figure 2, and substituting them into Eqn. (4), the remaining two intrinsic parameters can be determined as
Calculate the 2D image coordinates corresponding to all the vertices in the 3D triangular mesh model, according to the projection model presented in the previous section. Scan all the projected triangles on the image plane, calculate the z value for each point, and keep the smallest depth value as the image pixel.
(5)
where cm (the distance between the X-ray source and the isocentre), cm (the horizontal and vertical distances between the two and selected pixel and the optical centre), are the corresponding numbers of pixels in the horizontal and vertical directions. Figure 3. Mesh model extracted from CT data.
3. Image Pre-processing The proposed 3D-2D registration method is designed to match two sets of data points. One is a set of 2D points extracted from the orthogonal X-ray image pair, and the other is a set of 3D points extracted from the treatment planning CT data. mm For the CT data used with voxel size of mm mm, trilinear interpolation is applied to increase the resolution along the z-axis to yield a uniform volumetric data set. Subsequently, the iso-surface of the bony structures is extracted from the interpolated CT data and represented as a triangle mesh model using the Marching Cube algorithm [7]. Figure 3 shows an example of the mesh model generated. In order to match the 3D CT data with the orthogonal 2D image pair, the authors chose to generate 2D projections from the mesh model. However, when a 2D projection image is generated from 3D, there is an inherent loss of information. To minimise the information loss, the Z-buffer algorithm [9] is chosen to produce the 2D projections as depth maps. An important advantage of the Z-buffer algorithm is that the z value associated with each pixel can be retained, which enables the depth information to be used for the subsequent registration procedure. The Z-buffer algorithm has
Figure 4 shows a pair of orthogonal depth maps produced by 2D projection, where the grey level values represent the z value in the source coordinate system. The darker the pixel, the closer the point is to the X-ray source. The 2D projection can also be used to generate a binary image pair and a simple gradient operator can be used to extract the contours from the binary images as shown in Figure 5. It is noteworthy that the extracted contours are associated with their depth maps, which can be back projected to the 3D machine coordinate system as shown in Figure 6, by the inverse operation of Eqn. (1).
Figure 4. Depth map of 2D projections.
Proceedings of the International Conference on Medical Information Visualisation─BioMedical Visualisation (MediVis'06) 0-7695-2603-9/06 $20.00 © 2006
IEEE
Figure 5. Contours extracted from binary 2D projections.
matching algorithm in medical applications. To apply it to 3D-2D registration, the following steps are proposed. (1) Initial pose and alignment: In this step, the initial 3D pose of the constructed mesh model is projected onto the image plane to produce a pair of orthogonal contours with in the source projected points denoted as coordinate system. This is illustrated in Figure 8, where the projected points are superimposed on the contours consisting of 2D points extracted from the corresponding orthogo. For each nal X-ray images and denoted as contour, the centroid is then calculated and used to align with each other to provide an initial contour alignment.
Figure 6. 3D mesh model with back projected contours. Figure 8. Initial pose of mesh model. For the orthogonal X-ray image pairs taken from the simulator, the contours of the bony structures need to be extracted also. This is illustrated in Figure 7 and can be achieved either manually or automatically.
(2) Correspondence search: For each contour point extracted from the X-ray image, this step finds the closest point in the projected points as illustrated in Figure 9.
Figure 7. Contours extracted from X-ray images.
After the pre-processing procedure, an orthogonal set of 2D points as shown in Figure 7 and a set of 3D points as shown in Figure 6 are obtained for subsequent 3D-2D registration.
4. 3D-2D Registration by ICP ICP was proposed by Besl and McKay [2] for registration of 3D shapes, and is the most widely used surface
Figure 9. Search of correspondence points. (3) Back projection: By using the correspondence established between a 2D point and its associated 3D point 1 , each 2D point is back projected to the 1 Superscripts and represent the source and machine coordinates respectively, whilst subscripts and represent mesh model and X-ray images respectively. , where is the number of correspondence points.
Proceedings of the International Conference on Medical Information Visualisation─BioMedical Visualisation (MediVis'06) 0-7695-2603-9/06 $20.00 © 2006
IEEE
source coordinate system with the 3D coordinates given by
(6)
By translating the back projected points from the source coordinate system to the machine coordinate system using the inverse matrix of , Figure 10 shows the back projected 3D points and their 3D correspondence points in the mesh model.
(5) Generation of new 3D pose and iteration: Using the new composite transformation matrix, a new 3D pose is generated with a new projected pair of orthogonal contours as shown in Figure 11, and the whole process is repeated from step 2 until the alignment error is below a threshold . When the registration process is tervalue or minated, the coordinates of the final pose of the mesh model is related to the initial pose by (9) where is the final composite transformation matrix. By using the pseudo-inverse of , can be calculated as , and the rotation angles as well as the translation parameters in can be calculated using (10) (11) (12) (13) (14)
Figure 10. 3D visualisation of correspondence points.
(15) where column of
denotes the element in the
row and
.
(4) Computation and minimisation of alignment error: With the back projected 3D points denoted by and their 3D correspondence points denoted by , the alignment error is given by (7) where is the number of correspondence points, and denotes the composite transformation matrix at the iteration. To minimise the alignment error in the least square manner, the new composite transformation matrix for the next iteration is given by (8) Since there are no constraints in the above optimisation process, it is not guaranteed to maintain the orthogonal property of the rotation matrix. Hence, at each iteration, polar decomposition [4] is used to calculate a pure rotation matrix that is the closest orthogonal matrix to the top left 3 by 3 matrix in the composite transformation matrix. The new rotation matrix as well as the translation parameters (in the last column of the composite transformation matrix) are used to form a new composite transformation matrix.
Figure 11. New pose of the mesh model.
5. Evaluation In this section, the accuracy and robustness of the proposed method are presented using simulated 2D images and skull phantom data. The evaluation was performed using a Pentium 4 2.2 GHz computer. Additionally, the main program is written using Matlab with some of the sub-functions written in C, such as generation of 2D projections using the Z-buffer algorithm and correspondence search. For simulated 2D images, 100 pairs of two orthogonal 2D images were generated from known poses which were
Proceedings of the International Conference on Medical Information Visualisation─BioMedical Visualisation (MediVis'06) 0-7695-2603-9/06 $20.00 © 2006
IEEE
randomly selected and uniformly distributed in the range of for rotation angles and pixels for translations. The number of iterations was set to 30 with the alignment found to be achieved within 15 iterations for most cases. The total root-mean-square (rms) error is 0.77 pixels for translation and 1.19 for rotation. For skull phantom data, there are 3 pairs and the 3D-2D registration algorithm was performed 3 times for each pair using the contours extracted from the orthogonal X-ray image pair by different people. The number of iterations was set to 20 with alignment found to be achieved again within 15 iterations. The registration results are shown in Figure 12 with alignment errors and computation times listed in Table 1.
In Table 1, the alignment results of each registration are listed below the expected phantom pose. It can be seen from Table 1 that the proposed method can achieve good registration results as shown by the translation errors which vary from 0.04 mm to 3.3 mm with an average of 1.27 mm and the rotation errors which vary from 0.02 to 1.64 with an average of 0.82 .
6. Conclusions and Further Work The main objective of the work is to develop an automatic 3D-2D registration algorithm to match the 3D treatment planning CT data to a pair of orthogonal X-ray images taken from the simulator. The clinical motivation behind the work is to improve the speed and accuracy of patient positioning and machine set-up in pre-treatment validation, thereby enabling high quality treatment delivery. The main contribution of the work is a novel feature-based registration method which extends the ICP algorithm and combines the Z-buffer algorithm to achieve 3D-2D alignment. The method provides a strong basis for further development, as it can be used as an efficient coarse registration method to reduce the searching range for subsequent fine registration. Furthermore, due to the recent development of the treatment machine (Elekta Synergy ) to enable generation of diagnostic quality X-ray images during treatment [1], there is a potential for the proposed method to be used for rapid patient and machine set-up for treatment delivery.
References
Figure 12. Registration of phantom data.
Table 1. Registration results. Phantom
Tx (mm) Phantom1 20.00 (Ideal) 23.30 Test1 Test2 22.79 Test3 22.50 Phantom2 0.00 (Ideal) 1.59 Test1 Test2 0.40 Test3 1.01 Phantom3 -30.00 (Ideal) -31.02 Test1 -30.05 Test2 Test3 -30.10
Ty (mm) 30.00
Tz (mm) 90.00
Rx (deg) 0.00
Ry (deg) 0.00
Rz (deg) 0.00
Time (sec) –
28.09 28.56 28.92 0.00
88.26 88.72 88.75 0.00
-0.02 -0.03 -0.50 0.00
0.34 -0.34 -0.21 0.00
0.51 1.64 1.51 0.00
31.36 29.78 30.30 –
-0.04 -0.59 -0.44 -20.00
0.78 -0.55 0.50 -30.00
-0.88 -1.49 -0.62 0.00
0.15 0.17 -0.15 0.00
-0.78 -0.91 -0.93 0.00
30.32 32.33 31.44 –
-20.80 -21.12 -20.60
-29.30 -29.51 -29.53
-1.26 -1.18 -1.19
0.33 0.33 0.35
-1.25 -1.60 -1.55
27.32 29.32 28.25
[1] http://www.elekta.com/healthcareinternational.nsf. [2] P. J. Besl and N. D. McKay. A method for registration of 3-d shapes. IEEE Trans. Pattern Anal. Machine Intell., 14, 1992. [3] J. Feldmar, N. Ayache, and F. Betting. 3d-2d projective registration of free-form curves and surfaces. Computer Vision and Image Understanding, 65(3), 1997. [4] S. Ken and D. Tom. Matrix animation and polar decomposition. Graphics Interface 92, Vancouver, British Columbia, Canada, 1992. [5] D. A. LaRose. Iterative x-ray/ct registration using accelerated volume rendering. PhD thesis, Carnegie Mellon University, 2001. [6] S. Lavallee and R. Szeliski. Recovering the position and orientation of free-form objects from image contours using 3-d distance maps. IEEE Trans. Pattern Anal. Machine Intell. [7] W. Lorensen and H. E. Cline. Marching cubes: A high resolution 3-d surface construction algorithm. Proc. SIGGRAPH: Computer Graphics, 21, 1987. [8] D. B. Russakoff, T. Rohlfing, and C. R. M. Jr. Fast intensitybased 2d-3d image registration of clinical data using light fields. Proceedings of the Ninth IEEE International Conference on Computer Vision (ICCV 2003), 1, 2003. [9] A. Watt. 3D Computer Graphics (3rd ed). Harlow: Addisonwesley, 2000.
Proceedings of the International Conference on Medical Information Visualisation─BioMedical Visualisation (MediVis'06) 0-7695-2603-9/06 $20.00 © 2006
IEEE