Journal of Education and Training Studies Vol. 1, No. 1; April 2013 ISSN 2324-805X E-ISSN 2324-8068 Published by Redfame Publishing
An Implementation Strategy to Improve the Guideline Adherence of Insurance Physicians: a Process Evaluation alongside an Experiment in a Controlled Setting Feico Zwerver1,2,3, Karin Bonefaas-Groenewoud1,2, Antonius JM Schellart1,2,3, Johannes R Anema1,2 & Allard J van der Beek1,2 1
Department of Public and Occupational Health, EMGO Institute for Health and Care Research, VU University Medical Center, Amsterdam, The Netherlands 2
Research Center for Insurance Medicine, collaboration between AMC-UMCG-UWV-VUmc, Amsterdam, The Netherlands 3
Dutch National Institute for Employee Benefits Schemes, Amsterdam, The Netherlands
Correspondence: Feico Zwerver, Department of Public and Occupational Health, EMGO Institute for Health and Care Research, VU University Medical Center, Amsterdam, The Netherlands. E-mail:
[email protected] Received: December 14, 2012
Accepted: January 5, 2013
doi:10.11114/jets.v1i1.23
Available online: March 26, 2013
URL: http://dx.doi.org/10.11114/jets.v1i1.23
Abstract Background We developed an implementation strategy for the insurance medicine guidelines for depression, which we implemented via a post-graduate course for insurance physicians (IPs). In this study we evaluate the physicians’ experiences of the implementation strategy by measuring the following aspects: recruitment and reach, dose delivered and dose received, satisfaction and expectations, and perceived barriers. Methods Insurance physicians conducting client disability assessments for the Dutch Institute for Employee Benefits Schemes were invited to attend a post-graduate course in implementation of the guidelines for depression in which a controlled experiment was embedded. Data were collected from the participating insurance physicians using questionnaires applied directly after the intervention and at three-month follow-up. Results Of the 797 insurance physicians invited, 42 participated. Reach was 4.7%. The response to the questionnaires was 100%. The participants appraised the implementation strategy with a total score of 7.7 out of 10, and 81% expected to see improvement in their assessments of clients with depression. Physicians were still satisfied with the implementation strategy after three months. Changes in work routines and the time needed to apply the guidelines were perceived as barriers to use of the implementation strategy. Conclusions The reach of the newly developed implementation strategy for the guidelines for depression was poor: only 42 IPs out of 900 invited actually attended the post-graduate course. However, the results show that the implementation strategy worked well in a controlled setting for all participants. They were satisfied with the course and with the tools provided, both immediately after the training program and after three months. Trial registration Netherlands Trial Register NTR1863 Keywords: insurance medicine, guidelines, depression, post-graduate education 1. Introduction Depression contributes increasingly to work disability worldwide (Bijl, Ravelli & Van Zessen, 1998; Murray & Lopez, 1997; Lagerveld et al., 2010). Assessing disability of workers with depression is – and will continue to be 235
www.redfame.com/jets
Journal of Education and Training Studies
Vol. 1, No. 1; 2013
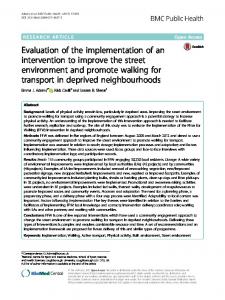
– a common and challenging task for insurance physicians (IPs). Guidelines should support physicians by providing them with evidence-based medicine (EBM) and with recommendations on how to use that EBM in practice. However, possible barriers to the implementation of guidelines are varied and exist at different levels, such as the level of the individual behaviour of the physician, the organizational/contextual level, the level of the guidelines themselves and the implementation strategy level (Cabana et al., 1999). Sometimes guidelines can be hard to translate into practice and sometimes a patient (or client) seems not to fit into a specific guideline. In the case of depression, assessing the diagnosis might be difficult because symptoms of depression can occur in many different ways or may be hidden. And how should a physician deal with the frequently occurring phenomenon of co-morbidity? Furthermore, once the diagnosis has been assessed, judgement of the severity of the disorder and the assessment of the client’s functional limitations can easily lead to a wide inter-rater variability between physicians (Spanjer, Krol, Brouwer & Groothoff, 2010). These examples illustrate how difficult it can be to implement EBM properly. According to the guidelines, IPs are expected to conduct disability assessments uniformly, transparently, and based on evidence (Health Council, 2005; Health Council, 2006). Therefore, an effective implementation strategy for insurance medicine guidelines is needed that pays attention to translation of the guidelines into the practice of IPs. We previously developed a new implementation strategy for the insurance medicine guidelines for depression and subsequently evaluated this strategy in a controlled experiment (Zwerver, Schellart, Knol, Anema & Van der Beek, 2011). The strategy consisted of training IPs by providing them with tools that help them learn to apply the guidelines. However, the implementation of guidelines for physicians has been described in the literature as a complex and difficult process, influenced by many factors and often with disappointing results (Cabana et al., 1999; Grol, 2001; Grol & Grimshaw, 2003). Therefore, in order to evaluate and to improve the process of implementation, we need knowledge of the factors that either hamper or advance this implementation strategy. This study evaluates the process of our newly developed implementation strategy, namely an educational training program and tools for applying the guidelines for depression. Such a process evaluation carried out alongside an experiment could nuance the interpretation of the quantitative results. (Hulscher, Laurant & Grol, 2003; Oakley, Strange, Bonell, Allen & Stephenson, 2006). In the current process evaluation we were only able to examine the characteristics of the IPs as users and of the researchers as observers, and could not examine other elements such as the organization where the IPs worked. The aims of this study were to describe: (1) the recruitment and reach of the implementation strategy; (2) the dose delivered and dose received, in order to evaluate whether the implementation strategy was carried out as planned and how it was received; (3) the satisfaction and expectations of the IPs with regard to the strategy; and (4) the perceived barriers to application of the implementation strategy. 2. Methods 2.1 Participants and Design This process evaluation was carried out alongside an experiment in a controlled setting, which investigated the efficacy of a newly developed implementation strategy for insurance physicians when assessing and reporting on a client’s work disability in accordance with the guidelines for depression. The Medical Ethics Committee of the VU University Medical Center approved the study design. IPs conducting work disability assessments of clients for the Dutch Institute for Employee Benefit Schemes (the Institute) were invited to attend a post-graduate course in which they learned to apply the guidelines for depression. Inclusion criteria were that participants were either registered as an IP or in the process of becoming registered as an IP, and conducting disability assessments at the Institute. The recruited IPs participated on voluntary basis. The design of the study is presented in Figure 1, which shows the design of the controlled experiment. Participants in both groups filled in either a questionnaire or an evaluation form on all four days they attended. The control group, as a waiting list group, received the intervention after the post-test. To avoid the risk of contamination, the two groups attended the course on separate days. Whereas the original study looked at the differences between the two groups as a result of the intervention, the current process evaluation focused on the participants’ perception of and experiences with the implementation strategy. For this evaluation, some data could be collected from both groups (n=42), e.g. on the experiences with the intervention (Tables 4 and 5), but since the study design included a waiting list control group, other data (Table 6) could only be gathered from the intervention group (n=23). It should also be noted that since two of the participants originally allocated to the control group were not available on the dates for that group, they subsequently participated in the intervention group. The intervention group therefore consisted of 23 participants, while the control group had 19 participants. The two participants who changed group were excluded from the experiment, but could still be included in the current process evaluation. 236
www.redfame.com/jets
Intervention group
Randomization n=43
Control group
Journal of Education and Training Studies
Pre-test baseline questionnaire, n=23
Intervention programme, evaluation form 1, n=23
Post-test
Control programme,
Post-test n=19
n=23
Vol. 1, No. 1; 2013
Control programme, evaluation form 2, n=23
1 drop out
Pre-test baseline questionnaire, n=19
Baseline Baseline questionnaire, n=42
n=19
Training programme Evaluation form 1, n=23
Intervention programme, evaluation form 1, n=19
Three-month follow-up Evaluation form 1, n=19 Evaluation form 2, n=23
Figure 1. Design of the controlled experiment with the process evaluation measurements. Each square represents a day in the course 2.2 Intervention The overall aims of the newly developed implementation strategy were to increase guideline adherence and to improve the disability assessments and reports of IPs. The implementation strategy was planned as a one-day training course in the guidelines for depression. The training day consisted of various components. At the start of the day, a psychiatrist explained a number of important aspects of depression assessment using a recent case of interest concerning an employee with atypical presentation of depressive symptoms. Focus points in this presentation were diagnostics; the distinction between behaviour and disease; symptoms; the relationships between symptoms and disabilities; estimating the severity of depression, including use of the Hamilton Rating Scale for Depression (HRSD) (Hamilton, 1960); treatment; progression of the condition; and co-morbidity. Following this presentation, an IP trainer introduced the program’s four evidence-based tools: an easy-to-follow plastic card summarizing the most essential information on the guidelines, i.e. diagnostics (DSM-IV), co-morbidity, therapy and treatment, and the ICF model (World Health Organization [WHO], 2001); a checklist of the main items of the guidelines; a checklist of disabilities connected to depression severity based on a Delphi study (Slebus, Kuijer, Willems, Frings-Dresen & Sluiter, 2008); and the HRSD. The participants were then separated into subgroups, with each group focusing on one of the main items of the guidelines. With the help of the four tools, each subgroup was asked to make an assessment of a client with depression presented on video. The IP trainer then explained to participants how to write down their findings and assessment conclusions using the essential elements of reasoning. The participants were also given feedback on their performance by the IP trainer. The training program was characterized by self-activation, interactivity and feedback. A research assistant was present on all days of the post-graduate course; this person not only took care of logistics but also made observational reports on the execution of the planned actions. More detailed information about the intervention can be found elsewhere (Zwerver et al., 2011). 2.3 Process Measures and Data Collection Based on the Linnan and Steckler framework for process evaluation in public health, we addressed the following elements: recruitment; reach; dose delivered by the implementation providers; dose received by the participants; and barriers to using the implementation strategy as perceived by the participants (Linnan & Steckler, 2002). Fidelity and implementation could not be measured because the design of this study was an experiment in a controlled setting. The data for this process evaluation were collected from the participating IPs using a baseline questionnaire, two evaluation forms, and checklists. Data at baseline and directly after the course were collected 237
www.redfame.com/jets
Journal of Education and Training Studies
Vol. 1, No. 1; 2013
from all IPs. Furthermore, data at three-month follow-up were collected from a subgroup of IPs (n=23). The data collection and process measures are presented in Table 1. Table 1. Process measures and data collection Outcomes
Definition
Data collection
Recruitment
- Sources and procedures used to recruit potential participants - Number of initially recruited IPs - Reasons for non-participation - Number and characteristics of participating IPs - Representativeness of the IPs - Number of components of the implementation strategy delivered - The extent to which training was provided as intended - Number of IPs who actually attended the training program
- Checklist
Reach
Dose delivered
Dose received Participant satisfaction and expectations
- Overall satisfaction with the training day
- Checklist - Checklist - IP registration forms - 11 items from baseline questionnaire - Additional data from the Institute - Checklist - Written reports by the research assistant and IP trainer - Checklist Evaluation form 1: - 1 item on a 1-10 scale (very unsatisfied to very satisfied) - 2 items per component on 1-5 Likert scale (very unsatisfied to very satisfied) - 2 items on 1-5 Likert scale (no improvement to much improvement)
- Satisfaction with the different components of the training program - Expectations about improvement in disability assessments and reports using the evidence-based tools - Expectations about usefulness of the - 6 items on 1-5 Likert scale (not useful to evidence-based tools in different very useful) components of applying GD - Intention to use the different - 2 items per tool on 1-5 Likert scale (no evidence-based tools intention to use to intention to use) - Usefulness of training program after three - 1 item on 1-5 Likert scale (not useful to very months useful) - Needs for further training after three - 3 items on 1-5 Likert scale (need training to months do not need training) - Satisfaction with the evidence-based tools - 7 items per tool on 1-5 Likert scale (very after three months unsatisfied to very satisfied) - Satisfaction about GD with the - 2 items on 1-5 Likert scale (very unsatisfied evidence-based tools in daily practice after to very satisfied) three months Barriers - Barriers to implementation GD directly - 22 items on 1-5 Likert scale (no barrier after the training program and at perceived to perceived as barrier) from three-month follow-up evaluation form 2 IPs: insurance physicians; GD: guidelines for depression; Institute: Dutch Institute for Employee Benefits Schemes 2.4 Recruitment and Reach Recruitment refers to the sources and the procedures used to attract potential participants and the number of initially recruited IPs; the most common reasons for non-participation were registered. Reach was defined as the number of IPs participating in the post-graduate course compared with the number invited. The representativeness of the participating IPs was determined by comparing these IPs with the total group of IPs conducting disability assessments at the Institute. 238
www.redfame.com/jets
Journal of Education and Training Studies
Vol. 1, No. 1; 2013
2.5 Dose Delivered and Dose Received Dose delivered was the number of components of the implementation strategy provided to the participants by the IP trainers. This takes into account the extent to which the training was carried out in accordance with the planned program for the implementation strategy. The number of participants actually attending the course (dose received) was recorded by the research assistant using the attendance list. In addition, the research assistant and one of the IP trainers both wrote an evaluation report directly after the training day describing the participants’ engagement with the program. 2.6 Participant Satisfaction and Expectations Levels of overall satisfaction with the training course and its different components, as well as participants’ expectations about any improvement in skills resulting from it, were assessed in a evaluation form directly after the course. Expectations regarding the usefulness of the evidence-based tools and intentions to use the different tools were based on the experiences of the IPs as assessed directly after the course. Experiences three months after the course were collected from a subgroup of the IPs. This three-month follow-up evaluation form assessed the usefulness of the course, needs for further training and satisfaction with the tools in the IPs’ daily practice. 2.7 Perceived Barriers The perceived barriers to working with the evidence-based tools were also assessed immediately after the training day and at three-month follow-up. Questions were based on the validated questionnaire entitled ‘Barriers and facilitators assessment instrument’ from the Centre for Quality of Care Research (WOK) (Peters, Harmsen, Laurant & Wensing, 2002). The questionnaire included 22 items concerning the professional (IP) and the innovation (evidence-based tools). 2.8 Data Analysis The data were analysed using descriptive statistics such as frequencies and means. SPSS 15.0 and Excel 2003 were used for the descriptive and statistical analyses. Cronbach’s alphas were calculated for scales of items that were used for the outcome measures. Differences between measurements directly after training and measurements at three-month follow-up were calculated with a paired-samples T-test. 3. Results 3.1 Recruitment and Reach Between May 2008 and December 2008, IPs were invited to attend a post-graduate course where they would learn to apply the guidelines for depression. We aimed for a minimum of 40 and a maximum of 50 participants, to form two manageable groups. For the purposes of randomization and allocation, participating IPs had to be available on four different dates per group, which created difficulties. We used various strategies to recruit IPs to participate in our study. We started at the Institute by giving oral presentations at five of the 23 branch offices (Utrecht, The Hague, Rotterdam, Venlo and Heerlen); we invited all IPs (circa 900) by mail at their Institute addresses; and we advertised on the internal website of the Institute. We also asked the general staff, the staff IPs and the local managers of the Institute to support participation in the study. During this period of recruitment, the following reasons for non-participation were noted: no need for this course, no permission from the manager, too busy with practising and no time left for training courses, not interested, limited budget for attending courses, preference for other courses, too much travelling time, and unknown. By January 2009, we had 21 IPs interested in participation. However, when the planned dates for the course were announced, only seven IPs remained − a number insufficient for the study to continue. We then collaborated with the Netherlands School of Public and Occupational Health (NSPOH) and our study was included in a post-graduate course for IPs located at the NSPOH. A newsletter promoting participation was then sent out to all registered and trainee IPs on the NSPOH mailing list (797 altogether). The post-graduate course was accredited by the NSPOH as a further incentive. In March 2009, just before the planned start of the course, another 36 IPs signed up, reaching a final total of 43. Seven out of approximately 900 and 36 out of 797 (the mailing lists of the Institute and the NSPOH largely coincide with each other) resulted in a reach of 0.8% for the Institute and 4.7% for the NSPOH. These 43 IPs were randomized by the research assistant using a random-sequence table and allocated to the intervention or to the control group of the experiment. Forty-two participants (one drop out) completed the baseline questionnaire, providing demographic information, work-related characteristics and characteristics related to the guidelines for depression. The baseline characteristics of the participating IPs are shown in Table 2. Data from the Institute demonstrated that the group of participating IPs was representative of the total population 239
www.redfame.com/jets
Journal of Education and Training Studies
Vol. 1, No. 1; 2013
of IPs working at the Institute in terms of age, gender, registration as an IP and number of working hours per week. The mean age of the total population of IPs (N = approximately 900) was 49 years, 58.3% were male, 85.0% were registered and they worked for on average 32 hours per week (Steenbeek et al., 2011). Table 2. Baseline characteristics of participating IPs (n=42) IP characteristics Age (mean ±SD years)
50.5 (5.8)
Male (%)
52.4
Work-related characteristics Registered as IP (%)
85.7
Years working as IP (mean ±SD)
15.4 (7.8)
Working hours/ week (mean ±SD)
31.7 (9.3)
Number of clients with depression assessed per month (mean ± 7.0 (5.0) SD) GD-related characteristics In possession of GD (%)
92.9
IP has read GD (%) Most of it
28.6
Whole
69.0
IP has used GD in practice (%)
85.7
Number of GD consultations (%) 0
4.8
1–5
57.1
6 – 10
26.2
< 10
11.9
IP: insurance physician; GD: guidelines for depression 3.2 Dose Delivered and Dose Received The training day consisted of four main components. Various educational strategies − such as interactive presentations, self-activation, feedback, subgroup presentations and individual coaching − were used in order to engage the participating IPs in applying the guidelines. They were thoroughly and individually coached by a trainer on how to use the evidence-based tools to assess a client with depression. They practised their skills in assessing work disability with help of a realistic videotape of a client with depression, played by an actor, and received immediate feedback on their performance. The training day was planned according to a strict time schedule. The research assistant was responsible for the schedule and reported via a checklist that the training program was delivered exactly as was planned in the implementation program (see Table 3). Between randomization and baseline measurement one of the 43 IPs withdrew because of lack of availability; 42 (98%) completed the course. The questionnaires for the process evaluation were filled out during the course, so the response rate was also 98%. The evaluation report made by the research assistant immediately after the training day mentioned that, in general, participants showed engagement with the training program, participated actively, used the tools and responded well to feedback.
240
www.redfame.com/jets
Journal of Education and Training Studies
Vol. 1, No. 1; 2013
Table 3. The implementation strategy: different components of the training day and the evidence-based tools Components of the training day - educational strategy - time needed Introduction - plenary - 15 minutes Presentation by a psychiatrist - interactive presentation with the complete group - 1 hour Trainer providing instruction on tools and on video of client played by an actor - 6 subgroups, interactive, coaching 30 minutes IPs filling in checklists 1 and 2 while watching the video of client played by an actor - self-activity - 1 hour Trainer translating GD into physician’s practice - 6 subgroups, interactive - 30 minutes. IPs in subgroups assessing disability of the client played by an actor using the tools and presenting their findings to the complete group - self-activity, feedback by trainer - 1 hour IPs in subgroups write down their considerations of the assessment report using the essential elements of reasoning self-activity, feedback, coaching - 1 hour Evidence-based tools Plastic summary card: diagnostics, co-morbidity, therapy, treatment, ICF model Checklist 1: main items of the GD Checklist 2: disabilities connected to depression severity Hamilton Rating Scale for Depression (HRSD) (Hamilton, 1960) GD: guidelines for depression 3.3 Participant Satisfaction and Expectations Overall, the IPs were satisfied with the training day, rating it with an average score of 7.7 (SD = 0.6; median = 8.0) on a 1-10 scale. The different components of the training program were rated highly, between 4.2 and 4.7 on a 1-5 scale (see Table 4). Table 4. Satisfaction with the different components of the training program (n=42) Components of the training day Mean score† (SD), median Presentation by a psychiatrist 4.7 (0.5), 5.0 Translation by trainer of GD into physician’s practice 4.3 (0.6), 4.5 Interactive assessment in subgroups of disability of a client 4.2 (0.5), 4.3 presented on video and training in the use of evidence-based tools Practise in writing an assessment report using the essential 4.2 (0.9), 4.5 elements of reasoning † 1-5 scale, 5 indicating maximum; GD: guidelines for depression; Cronbach’s Alpha = 0.788 Directly after the training day, 81.0% of the IPs (n=42) expected to see improvement in their disability assessments and 85.8% expected to see improvement in their disability assessment reports when using the tools made available during the course. Of all tools, IPs were most likely to use the plastic summary card (4.8 on a 1-5 scale), followed by the checklists 1 and 2 (rated 4.3 and 4.2), with the HRSD (Hamilton, 1960) rated lowest (3.3). IPs expected the evidence-based tools to be the most useful for making decisions about diagnosis, giving this category a 4.6 on a 1-5 scale; followed by estimating the severity of depression (4.5); assessing the client’s history, risk factors and progress (4.1); co-morbidity (4.1); treatment and convalescence (4.1); and determining work limitations (4.1). Only from the intervention group (n=23) data were collected at three months after the intervention. 95.7% of the IPs still considered the training program as having been useful. Despite this, 17.4% wanted more training in using and applying the guidelines for depression. After three months they were still the most satisfied with the plastic summary card (4.7 on a 1-5 scale) and the least satisfied with the HRSD (Hamilton, 1960) (3.0). Checklist 1 was rated as 4.1 and checklist 2 as 3.9; three months after having receiving the training program, satisfaction with the guidelines was 4.3 on a 1-5 scale. 3.4 Perceived Barriers Barriers to use of the guidelines together with the tools were explored at the level of the professional (IPs) and at the level of the innovation (evidence-based tools). Table 5 gives an overview of the most important barriers perceived by the IPs directly after the training day. The higher the score, the more an aspect was perceived as a barrier. At the level of the professional, the perceived barrier with the highest rating (2.6 on a 1-5 scale) was the 241
www.redfame.com/jets
Journal of Education and Training Studies
Vol. 1, No. 1; 2013
work style of the IP (difficulties in changing routines). At the level of the tools, the perceived barrier with the highest rating (2.5 on a 1-5 scale) was the time required for using the tools when applying the guidelines. Other aspects of the tools, such as educational benefit, applicability, appeal and transparency, were not perceived as barriers. These aspects demonstrated that the tools themselves appeared to suit the needs of the IPs. Table 5. Perceived barriers to the use of evidence-based tools after the training day (n=42) Factor Mean score† (SD), median Expertise 2.2 (1.1), 2.0 Work style 2.6 (1.2), 2.0 Attitude 1.8 (1.0), 2.0 Doubts about innovation 2.2 (1.0), 2.0 Innovation (evidence-based Perceived advantage 1.8 (0.7), 1.8 tools) Time investment 2.5 (1.0), 2.3 Compatibility 2.1 (0.7), 2.0 Scientific basis 2.1 (0.8), 2.0 Validity 1.7 (0.7), 2.0 Feasibility 1.6 (0.7), 2.0 Flexibility 2.1 (0.6), 2.0 Transparency 1.7 (0.6), 2.0 Didactic benefit 1.5 (0.6), 1.5 Appeal 1.5 (0.7), 1.0 Applicability 1.6 (0.8), 1.0 Complexity 2.1 (1.1), 2.0 † Scale ranged from no barrier perceived (1) to barrier perceived (5); IP: insurance physician; Cronbach’s Alpha Professional = 0.704; Cronbach’s Alpha Innovation = 0.743 Aspect Professional (IPs)
Compared with their rating directly after the training program, there were two items that IPs rated significantly differently after three months: their attitudes to both the innovation and the validity of the tools changed in a positive way (Table 6). Perception of work style and time investment remained a barrier (mean score greater than 2.5 on a 1-5 scale). Table 6. Perceived barriers to the use of the tools after the training day and at three-month follow-up (n=23) Aspect Professional (IPs)
Factor
Mean score† (SD), median Directly after training At three-month follow-up 2.4 (1.2), 3.0 2.0 (1.0), 2.0 2.7 (1.2), 3.0 2.8 (1.3), 3.0 1.7 (0.7), 2.0 1.7 (1.1), 1.0 2.1 (1.2), 2.0 1.7 (0.9), 1.0*
Expertise Work style Attitude Doubts about innovation Innovation Perceived advantage 1.7 (0.7), 1.5 1.7 (0.6), 2.0 (evidence-based Time investment 2.7 (1.1), 3.0 2.8 (1.2), 3.0 tools) Compatibility 2.0 (0.7), 2.0 2.1 (1.0), 2.0 Scientific basis 2.2 (0.7), 2.0 2.0 (0.8), 2.0 Validity 1.8 (0.7), 2,0 1.6 (0.7), 2.0** Feasibility 1.6 (0.7), 1.0 1.8 (1.0), 2.0 Flexibility 2.0 (0.6), 2.0 2.0 (0.6), 2.0 Transparency 1.7 (0.6), 2.0 1.7 (0.8), 2.0 Didactic benefit 1.4 (0.5), 1.0 1.5 (0.6), 1.0 AppealAttractiveness 1.6 (0.8), 1.0 1.6 (0.8), 1.0 Applicability 1.9 (0.9), 2.0 2.0 (1.1), 2.0 Complexity 2.0 (1.0), 2.0 1.7 (1.0), 1.0 † Scale ranged from no barrier perceived (1) to barrier perceived (5); IP: insurance physician; Cronbach’s Alpha Professional, after training = 0.689, at three-month follow-up = 0.620; Cronbach’s Alpha Innovation, after training = 0.773, at three-month follow-up = 0.850; doubts about innovation n = 21, applicability n = 22, complexity n = 21; * p = 0.021; ** p = 0.043 242
www.redfame.com/jets
Journal of Education and Training Studies
Vol. 1, No. 1; 2013
4. Discussion 4.1 Main Findings The aim of this study was to evaluate the newly developed implementation strategy for the guidelines for depression. The results of this process evaluation show that despite intensive recruitment efforts only a small group of 43 IPs were reached. However, 42 of this group received all components of the implementation strategy as planned. Although changing their work routine and finding the time to apply the guidelines were found to be barriers to the implementation strategy, most IPs expected the course to improve their assessments of clients with depression. Implementation of and fidelity to the implementation strategy in practice could not be measured because the design of this study was an experiment in a controlled setting. 4.2 Comparison with Other Studies The low reach of this study was similar to that seen in other public health studies involving the recruitment of physicians (Rebergen, Bruinvels, Bezemer, Van der Beek & Van Mechelen, 2009; Sinnema et al., 2011; Verweij, Proper, Hulshof & Van Mechelen, 2011). However, the fact that the participants had to be available on eight separate dates was likely a serious barrier to participation. It should also be noted that the IPs who did participate were self-selective and therefore motivated to learn to apply the guidelines for depression. In the experiment in a controlled setting, the IPs who had been trained in the implementation strategy performed significantly better on implementing the guidelines for depression than did the control group (Zwerver et al., 2011). This process evaluation assesses various aspects of the implementation strategy and shows that IPs were satisfied with the training program and with the tools and that the majority of them had positive expectations about the use of the guidelines in practice. Satisfaction should be regarded as an important process measure because it has been shown to be closely associated with the acceptance of and participation in the service provided, in this case adherence to the guidelines for depression (Guidotti, Cowell & Jamieson, 1989). A systematic review evaluating the effect of clinical guidelines concluded that, in the context of rigorous evaluations, explicit guidelines do improve clinical practice (Grimshaw & Russell, 1993). However, another review by the same authors states that the successful introduction of clinical guidelines is dependent on many factors, including the clinical context as well as the methods of developing, disseminating and implementing the guidelines (Russell & Grimshaw, 1992). Indeed, poor implementation often hampers the impact of practice guidelines on quality of care (Grilli & Lomas, 1994). The various barriers to guideline adherence have been classified by Cabana et al. (2000) into internal barriers (i.e. lack of awareness, lack of familiarity, lack of agreement, lack of self-efficacy, lack of outcome expectancy and the inability to overcome the inertia of previous practice) and external barriers (i.e. patient, environmental and guideline factors). Previous studies have shown that, in general, IPs have a positive attitude towards EBM guidelines (Heselmans, Donceel, Aertgeerts, Van de Velde & Ramaekers, 2009; Heselmans, Donceel, Aertgeerts, Van de Velde & Ramaekers, 2010; Kok et al., 2008). Despite this, their use of guidelines in practice is rather poor. Our implementation strategy was developed to diminish this gap between attitude and performance by supporting the IPs with training and tools, making it easier for them to conform to the guidelines. The only internal barrier to guideline adherence mentioned by the IPs in our study was their perceived problems with changing their routines, implied by use of the guidelines. However, the fact that they mention a change in routine as a problem is actually encouraging, since this is closer to actual guideline adherence than a rejection due to a lack of agreement, for example, or because they consider guidelines to be ‘cookbook medicine’. One perceived external barrier to the use of the guidelines was the time factor, a finding supported by a study showing that guideline recommendations that require extra time investment are less well adhered to than those that can save time (Van den Berg et al., 2009). Lack of time is also known to be one of the main barriers to applying evidence-based guidelines for occupational physicians and general practitioners (Hugenholtz, Nieuwenhuijsen, Sluiter & Van Dijk, 2009; Karbach et al., 2011). The IPs’ concerns about extra time investment needed to use the guidelines should have been addressed in the training program. Although the tools had actually been developed to facilitate guideline implementation by improving efficiency, our implementation strategy unfortunately did not eliminate the idea that guideline use involves extra time. The fact that our study found no indication of barriers to the translation and transfer of knowledge from the guidelines to the IPs indicates that this implementation strategy covers the knowledge infrastructure needed for evidence-based decision making in insurance medicine (Van Dijk, Verbeek, Hoving & Hulshof, 2010). Training sessions alone are not likely to be effective in changing complex behaviours such as a physicians’ guideline adherence. However, the effectiveness of training sessions can be increased by applying strategies to 243
www.redfame.com/jets
Journal of Education and Training Studies
Vol. 1, No. 1; 2013
increase attendance at such sessions, by using a mix of interactive and didactic formats and by placing the focus on outcomes perceived as serious (Forsetlund et al., 2009) – three aspects that were also included in our program. 4.3 Strengths and Limitations of the Study No other study has evaluated the implementation of insurance medicine guidelines in an experimental setting. In the controlled setting of the post-graduate course we delivered the strategy as planned. The process evaluation in this study contains extensive data on the implementation strategy as delivered and perceived. The translation of evidence-based guidelines into the IPs’ practice was enhanced by the use of IP trainers who had broad experience of the work in practice. Feedback from the trainers on applying the guidelines to realistic case histories presented on video also helped to make the connection between evidence-based medicine and practice. Dose received was measured directly at the training session. A further strength is the 98% response rate on the WOK questionnaire used to collect data to measure perceived barriers (Peters et al., 2002). It should also be noted that this process evaluation was considered an essential part of the design of the experiment and was developed early on in the planning (Bartholomew et al., 2009). There are a number of limitations to our study. Firstly, we reached only 5% of the total group of IPs, which might have introduced selection bias. Secondly, the component ‘implementation’ mentioned in the Linnan and Steckler framework (Linnan & Steckler, 2002) is missing from our results because the implementation strategy in this study has only been executed in a specific controlled setting and not yet in actual practice. Such application in practice could be the next step in further research on this subject. The element ‘fidelity’ was also not objectively measured in this study, although we do have subjective impressions and reports on fidelity. Thirdly, while reports written by the IP trainers immediately after the training program suggested that participants were engaged with the implementation strategy, proof of such engagement is lacking. Finally, we should be aware that our data were obtained in a controlled setting with motivated IPs, which means that not all results and conclusions can be generalized to the entire group of IPs working in practice. There may well be as yet unknown barriers to the implementation strategy at the organizational or client level. 4.4 Implications for Practice It is possible for the implementation strategy that we have developed to be distributed and evaluated on a wider scale than the limited reach of this experiment. For instance, the Institute where most of the IPs in the Netherlands work could support this implementation strategy by including the one-day training program in their internal education program. 5. Conclusions This process evaluation shows that the developed implementation strategy can be successful in a controlled setting. Reach was low but dose delivered, dose received and satisfaction with the implementation strategy itself were good, even after three months. Most of the IPs expected to improve their disability assessments of clients with depression. In this implementation strategy two perceived barriers were identified: changes to work routines and the time required for using the guidelines. Competing interests The authors declare that they have no competing interests. Authors' contributions The authors declare that they participated in the study and that they have seen and approved the final version. The authors made the following contributions to the study: FZ, AJMS, JRA, and AJvdB contributed to the conception and design of this study; KBG and FZ contributed to the analysis; FZ and KBG wrote the manuscript; AJMS, JRA, and AJvdB revised and commented on the manuscript. AJMS, JRA and AJvdB will act as guarantors of this study. Acknowledgements and funding Funding sources: FZ, JRA and AJMS are partially funded by the Dutch Institute for Employee Benefit Schemes (UWV). The study sponsor had no decisive role in the study design, in the collection, analysis, or interpretation of the data, or in the decision to submit the paper for publication. References Bartholomew, L. K., Cushman, W. C., Cutler, J. A., Davis, B. R., Dawson, G., Einhorn, P. T. et al. (2009). Getting clinical trial results into practice: design, implementation, and process evaluation of the ALLHAT 244
www.redfame.com/jets
Journal of Education and Training Studies
Vol. 1, No. 1; 2013
Dissemination Project. Clin. Trials, 6, 329-343. http://dx.doi.org/10.1177/1740774509338234 Bijl, R. V., Ravelli, A., & Van Zessen. G. (1998). Prevalence of psychiatric disorder in the general population: results of The Netherlands Mental Health Survey and Incidence Study (NEMESIS). Soc. Psychiatry Psychiatr. Epidemiol., 33, 587-595. Cabana, M. D., Ebel, B. E., Cooper-Patrick, L., Powe, N. R., Rubin, H. R., & Rand, C. S. (2000). Barriers pediatricians face when using asthma practice guidelines. Arch. Pediatr. Adolesc. Med., 154, 685-693. Cabana, M. D., Rand, C. S., Powe, N. R., Wu, A. W., Wilson, M. H., Abboud, P. A. et al. (1999). Why don't physicians follow clinical practice guidelines? A framework for improvement. JAMA, 282, 1458-1465. Forsetlund, L., Bjorndal, A., Rashidian, A., Jamtvedt, G., O'Brien, M. A., Wolf, F. et al. (2009). Continuing education meetings and workshops: effects on professional practice and health care outcomes. Cochrane. Database. Syst. Rev., CD003030. http://dx.doi.org/10.1002/14651858 Grilli, R., & Lomas, J. (1994). Evaluating the message: the relationship between compliance rate and the subject of a practice guideline. Med. Care, 32, 202-213. Grimshaw, J. M., & Russell, I. T. (1993). Effect of clinical guidelines on medical practice: a systematic review of rigorous evaluations. Lancet, 342, 1317-1322. Grol, R. (2001). Successes and failures in the implementation of evidence-based guidelines for clinical practice. Med. Care, 39, II46-II54. Grol, R., & Grimshaw, J. (2003). From best evidence to best practice: effective implementation of change in patients' care. Lancet, 362, 1225-1230. Guidotti, T., Cowell, J., & Jamieson, C. (1989). Program evaluation. In American Medical Association. Occupational health services, a practical approach. Chicago: AMA. Hamilton, M. (1960). A rating scale for depression. J. Neurol. Neurosurg. Psychiatry, 23, 56-62. Health Council. (2005). Assessment, treatment and counselling. Medical responses to sickness absenteeism and occupational disability. The Hague, The Netherlands: Health Council. Health Council. (2006). Insurance Medicine Guidelines for Depression. The Hague, The Netherlands: Health Council. Heselmans, A., Donceel, P., Aertgeerts, B., Van de Velde, S., & Ramaekers, D. (2009). The attitude of Belgian social insurance physicians towards evidence-based practice and clinical practice guidelines. BMC. Fam. Pract., 10, 64. http://dx.doi.org/10.1186/1471-2296-10-64 Heselmans, A., Donceel, P., Aertgeerts, B., Van de Velde, S., & Ramaekers, D. (2010). The attitude of Flemish occupational health physicians toward evidence-based occupational health and clinical practice guidelines. Int. Arch. Occup. Environ. Health, 83, 201-208. http://dx.doi.org/10.1007/s00420-009-0449-y Hugenholtz, N. I., Nieuwenhuijsen, K., Sluiter, J. K., & Van Dijk, F. J. (2009). Do knowledge infrastructure facilities support evidence-based practice in occupational health? An exploratory study across countries among occupational physicians enrolled on Evidence-Based Medicine courses. BMC. Health Serv. Res., 9, 18. http://dx.doi.org/10.1186/1472-6963-9-18 Hulscher, M. E., Laurant, M. G., & Grol, R. P. (2003). Process evaluation on quality improvement interventions. Qual. Saf Health Care, 12, 40-46. Karbach, U., Schubert, I., Hagemeister, J., Ernstmann, N., Pfaff, H., & Hopp, H. W. (2011). Physicians' knowledge of and compliance with guidelines: an exploratory study in cardiovascular diseases. Dtsch. Arztebl. Int., 108, 61-69. http://dx.doi.org/10.3238/arztebl.2011.0061 Kok, R., Hoving, J. L., Verbeek, J. H., Schaafsma, F. G., Smits, P. B., & Van Dijk, F. J. (2008). Evaluation of a workshop on evidence-based medicine for social insurance physicians. Occup. Med. (Lond), 58, 83-87. http://dx.doi.org/10.1093/occmed/kqm151 Lagerveld, S. E., Bultmann, U., Franche, R. L., Van Dijk, F. J., Vlasveld, M. C., Van der Feltz-Cornelis CM et al. (2010). Factors associated with work participation and work functioning in depressed workers: a systematic review. J. Occup. Rehabil., 20, 275-292. http://dx.doi.org/10.1007/s10926-009-9224-x Linnan, L., & Steckler, A. (2002). Process evaluation for public health interventions and research: an overview. In: Process evaluations for Public Health Interventions and Research, San Francisco, CA. Jossey-Bass, 1-23. 245
www.redfame.com/jets
Journal of Education and Training Studies
Vol. 1, No. 1; 2013
Murray, C. J., & Lopez, A. D. (1997). Alternative projections of mortality and disability by cause 1990-2020: Global Burden of Disease Study. Lancet, 349, 1498-1504. Oakley, A., Strange, V., Bonell, C., Allen, E., & Stephenson, J. (2006). Process evaluation in randomised controlled trials of complex interventions. BMJ, 332, 413-416. Peters, M., Harmsen, M., Laurant, M., & Wensing, M. (2002). Room for improvement? Barriers to and facilitators for improvement of patient care. Nijmegen: Centre for Quality of Care Research (WOK), Radboud University Nijmegen Medical Centre. Rebergen, D. S., Bruinvels, D. J., Bezemer, P. D., Van der Beek, A. J., & Van Mechelen, W. (2009). Guideline-based care of common mental disorders by occupational physicians (CO-OP study): a randomized controlled trial. J. Occup. Environ. Med., 51, 305-312. http://dx.doi.org/10.1097/JOM.0b013e3181990d32 Russell, I. T., & Grimshaw, J. M. (1992). The effectiveness of referral guidelines: a review of the methods and findings of published evaluations. In Roland M, Coulter A, eds. Hospital referrals. Oxford: Oxford University press, 1992: 179-211. Sinnema, H., Franx, G., Volker, D., Majo, C., Terluin, B., Wensing, M. et al. (2011). Randomised controlled trial of tailored interventions to improve the management of anxiety and depressive disorders in primary care. Implement. Sci., 6, 75. http://dx.doi.org/10.1186/1748-5908-6-75 Slebus, F. G., Kuijer, P. P., Willems, J. H., Frings-Dresen, M. H., & Sluiter, J. K. (2008). Work ability in sick-listed patients with major depressive disorder. Occup. Med. (Lond), 58, 475-479. http://dx.doi.org/10.1093/occmed/kqn091 Spanjer, J., Krol, B., Brouwer, S., & Groothoff, J. W. (2010). Sources of variation in work disability assessment. Work, 37, 405-411. http://dx.doi.org/10.3233/WOR-2010-1094 Steenbeek, R., Schellart, A. J., Mulders, H., Anema, J. R., Kroneman, H., & Besseling, J. (2011). The development of instruments to measure the work disability assessment behaviour of insurance physicians. BMC. Public Health, 11, 1. http://dx.doi.org/10.1186/1471-2458-11-1 Van den Berg, M. J., de Bakker, D. H., Spreeuwenberg, P., Westert, G. P., Braspenning, J. C., Van der Zee, J. et al. (2009). Labour intensity of guidelines may have a greater effect on adherence than GPs' workload. BMC. Fam. Pract., 10, 74. http://dx.doi.org/10.1186/1471-2296-10-74 Van Dijk, F. J., Verbeek, J. H., Hoving, J. L., & Hulshof, C. T. (2010). A knowledge infrastructure for occupational safety and health. J. Occup. Environ. Med., 52, 1262-1268. http://dx.doi.org/10.1097/JOM.0b013e318202f2c5 Verweij, L. M., Proper, K. I., Hulshof, C. T., & Van Mechelen, W. (2011). Process evaluation of an occupational health guideline aimed at preventing weight gain among employees. J. Occup. Environ. Med., 53, 722-729. http://dx.doi.org/10.1097/JOM.0b013e318222af9b World Health Oranisation. (2001). ICF: International Classification of Functioning, Disability and Health. Geneva: World Health Oranisation. Zwerver, F., Schellart, A. J., Knol, D., Anema, J. R., & Van der Beek, A. J. (2011, December 21). An implementation strategy to improve the guideline adherence: an experiment in a controlled setting. BMC Imp. Science., 6, 131. http://dx.doi.org/10.1186/1748-5908-6-131
This work is licensed under a Creative Commons Attribution 3.0 License.
246