AN INTERACTIVE DYNAMIC SIMULATION MODEL OF A UNIVERSITY MANAGEMENT SYSTEM Yaman Barlas and Vedat G. Diker Bo~azi¢i University
Bebek, Istanbul, Turkey e-mail:
[email protected] [email protected]
Keywords: Interactive Simulation, System Dynamics, Education, University Modeling
strategic university management problems. I. I N T R O D U C T I O N
ABSTRACT Administrators of contemporary universities face the challenge of maintaining the quality of the fundamental functions of a university, namely teaching, research, academic and professional service, while tying to serve the students, under the pressure of limited resources in terms of faculty, facilities and income [4, 9, 16, 18].
The main objective of this research is to construct an interactive simulation model, on which a range of problems concerning the academic aspects of a university management system can be analyzed and certain policies for overcoming these problems can be tested. More specifically, the model focuses on long-term, strategic university problems that are dynamic and persistent in nature, such as growing student-faculty ratios, poor teaching quality, low research productivity. The model generates numerous performance measures about the three fundamental activities of a university, namely, teaching, research and professional projects. To construct such a game, a system dynamics model of the major academic aspects of a university system is built. The "model is validated and verified by standard tests, using data from Bogaziqi University. After these tests, some scenario experiments are done to test and demonstrate the analysis capabilities of the model. Next, the necessary changes are made on the model to construct the interactive gaming version and the gaming interface is programmed. The game has been played and tested by a group of faculty members, teaching assistants and students. Finally, the game results of these players are compared. Differences in performances reveal that players with different orientations focus on different performance measures in making decisions. This paper reports results of ongoing research. At this stage, we can state that the interactive simulation model has proven to be a useful laboratory to support not only practical debate, but also theoretical research on how to cope with
The problems that contemporary university administrations face and possible solutions have been studied both on macro and micro levels by many researchers. Some of these studies were based on certain quantitative research (for instance, [10, 14, 15, 17]; yet, a great portion of literature on university problems and their solutions do not have quantitative foundations, mostly because such systems involve qualitative (human) elements that are difficult to quantify and model. The link between the qualitative and the quantitative aspects of the problem is important and therefore deserves more research. A possible approach, in order to model and explore this link, is System Dynamics modeling/simulation methodology which employs a set of techniques that allows quantitative and realistic representation of variables that are typically perceived to be qualitative. This study intends to construct a simulation model, a computerized platform, on which a range of problems concerning a university administration system can be analyzed and certain policies for overcoming these problems can be tested and compared. In particular, the model focuses on those university problems that are dynamic and persistent in nature and as such must be addressed by high level, strategic policymaking mechanisms within the university. These strategic policy making mechanisms are typically the president, the deans, and the major policy-making councils at the university and divisional levels. The final
"Permission to make digital/hard copy of all or part of this material without fee is granted provided that copies are not made or distributed for profit or commercial advantage, the ACM copyright/server notice, the title of the publication and its date appear, and notice is given that copying is by permission of the Association for Computing Machinery, Inc.(ACM). To copy otherwise, to republish, to post on servers or to redistribute to lists, requires prior specific permission and/or a fee." © 1996 ACM 0-89791-820-7 96 0002 3.50
120
After this grouping, main activity areas of the faculty members are determined. Graduate and under-graduate instructions are the first two. These instruction activities are further d~tvided into two within each one as (a) inclass instruction and 0a) instruction overhead, which includes all out-of-class activities related to instruction. Another main group is research activities. Research activities are divided into two as (a) unsponsored research activities, which are not sponsored financially except for the university's own resources and (b) sponsored research activities, which are supported by governmental or private organizations.
goal of the research is constructing an interactive gaming version of the simulation model that can be played by such policy makers. II. R E S E A R C H M E T H O D O L O G Y The tool used to analyze the problem and build the model, is System Dynamics methodology. System Dynamics methodology was introduced in 1960s by a group of scientists at Sloan School of Management at MIT [7, 13]. At the beginning, it was applied to industrial systems. During 1970s and 1980s it has become extremely popular and has been applied to a wide range of systems, including ecological, economic, sociological and even psychological systems. System Dynamics methodology typically consists of the following steps: (1) problem description, (2) model conceptualization, (3) model construction (simulation model), (4) verification and validation of the model, (5) simulation experiments.
The last activity group is project (consulting) activities, which are divided into two: (a) income generating projects, which are activities like seminars, courses or consulting realized through university channels and generate income to the university and (b) unofficial projects, which are activities like seminars or consulting realized through non-university channels and do not generate any income to the university.
Once the System Dynamics model is complete, it can be converted into an interactive simulation game. The two aspects of designing an interactive simulation are i) proper selection of interactive decision variables and modification of the simulation model accordingly, ii) programming of the interactive user interface ("screen design"). Issues involved in these two aspects, conceptual and technical difficulties, design principles, etc. have been discussed in literature, (See, for instance, [ 1, 8, 11, 12l.
Based on the grouping above, the activities of a graduate faculty member are determined as: (a) graduate instruction, (b) under-graduate instruction, (c) graduate instruction overhead, (d) under-graduate instruction overhead, (e) unsponsored research, (f) sponsored research, (g) income generating projects, (h) unofficial projects. Similarly, the activities of an under-graduate faculty member are determined as: (a) under-graduate instruction, (b) under-graduate instruction overhead, (c) unsponsored research, (d) sponsored research, (e) income generating projects, (t) unofficial projects. The sectors of the model are determined so as to represent the dynamics of these major activity groups. Each of the sectors that form the model consists of tens of variables and as many equations. It is impossible to discuss the equations of the model within the context of this article. We therefore provide brief overviews of each sector. Also, because of lack of space, we are able to provide the structure diagram for only one sector as illustration. (See [5] for complete list of equations and structure diagrams).
HI. M O D E L O V E R V I E W The model presented in this study focuses on the academic aspects of university management system. The main concerns while modeling the system were faculty -members' time allocation among main activity groups, the factors that determine this allocation, allocation of certain facilities (such as laboratories) and the performance indicators realized as a result of these allocations. The basic time step used in the simulation is a semester. The model is constructed using Vensim software [6]. The model is constructed on sector basis. The main sectors are determined according to the major academic activity groups of the faculty members. Before determining their activities, faculty members are grouped into two: (a) Graduate Faculty Members, who are primarily involved in graduate instruction and research, (these faculty members are also involved in undergraduate instruction.); (b)'Under-graduate Faculty Members', who are involved only in under-graduate instruction and have little interest in research; (still, they are involved in research to a certain exten0.
The sector diagram illustrated in Figure 1 is called a 'stock-flow' diagram. R consists of four symbols: Stock variables (denoted by rectangular box) represent the fundamental accumulations over time. (Such as 'Number of Graduate Faculty' or 'Number of Graduate Students' in Figure 1.) Flow variables (denoted by a double arrow through a valve symbol) represent the rate of change of stock variables. (Such as 'New Graduate Faculty' or 'Graduate Student Admission'.) Single arrows mean "the variable at the root of the arrow has an effect on the variable at the tip of the arrow". (For instance, 'Number of Graduate Programs' has an effect on 'Total Graduate
121
; :.
Instruction Hours Needed'.) Variables whose names do not appear in any symbolic shape, are intermediate variables (called Auxiliary or Converter) that represent how variables influence each other, beyond the fundamental stock-flow relationship. (For example, we see in Figure 1, that 'Graduate Faculty Hiring Decision' is influenced by canceled lecture hours, number of existing graduate faculty, operating maximum instruction hours per graduate faculty, and actual instruction load per graduate faculty. Thus, the mathematical formulation of 'Graduate Faculty Hiring Decision' would be a function of these four variables.)
among research and project activities, according to the relative research and project motivations of the graduate faculty members.
HI. 1. Graduate Instruction Sector
HI. 6. Graduate Faculty Research Sector
In this sector, the graduate faculty workforce that can be assigned to instruction and the need for graduate instruction are calculated and the faculty workforce is assigned to graduate instruction (Figure 1). If the workforce is not enough to meet all the need, the discrepancy is tried to be eliminated with some other strategies, like hiring part-time faculty, increasing the class sizes, etc. On the other hand, if the graduate faculty workforce for instruction is more than the need for graduate instruction, the surplus is transferred to 'Undergraduate Instruction Sector'.
In 'Graduate Faculty Research Sector' the sponsored and unsponsored research motivations are first determined. The total graduate faculty workforce for research is then divided among unsponsored and sponsored research activities, according to the relative strengths of the respective motivations. The outcomes of research activities, (research papers, funds and grants), are determined and the main research performance indicators are calculated.
IlL 2. Under-graduate Instruction Sector
In this sector under-graduate faculty workforce for research is divided among sponsored and unsponsored research according to respective motivations; then, research outcomes and research performance indicators are calculated.
IlL 5. Under-graduate Faculty Instruction Overhead Sector In this sector the instruction overhead loads for undergraduate faculty members are calculated. The remaining under-graduate faculty workforce is divided among research and project activities, according to respective motivations.
HI. 7. Under-graduate Faculty Research Sector
In 'Under-graduate Instruction Sector' the need for under-graduate instruction is determined and compensated with the under-graduate faculty workforce that can be assigned to instruction and the surplus graduate faculty workforce for instruction, if any, from 'Graduate Instruction Sector'. If the need is more than the available workforce, some other strategies like hiring part-time faculty and increasing class sizes, are used to eliminate the discrepancy. IIL 3. Graduate and Under-graduate Quality Sectors
HI. 8. Graduate Faculty Projects Sector In 'Graduate Faculty Projects Sector' the incomegenerating-projects and unofficial-projects motivations are first calculated. The total graduate faculty workforce for projects is then divided among income generating projects and unofficial projects according to strengths of the respective motivations. The funds obtained from income generating projects and the share of the faculty are also determined in this sector.
Instruction
In 'Graduate Instruction Quality Sector' and 'Undergraduate Instruction Quality Sector', graduate and undergraduate instruction quality indicators are calculated. These indicators consist of student-faculty ratios, average class sizes, instruction overhead per student and facilities allocated for instruction.
ElL 9. Under-graduate Faculty Projects Sector In 'Under-graduate Faculty Projects Sector' faculty motivations, workforce divisions and outcomes are calculated for projects activities done by under-graduate faculty members.
HI. 4. Graduate Faculty Instruction Overhead Sector In 'Graduate Faculty Instruction Overhead Sector' the instruction overhead load for graduate faculty members are determined and assigned to graduate faculty members and assistants. The surplus graduate faculty workforce that remains after the in-class instruction and instruction overhead loads are assigned, is calculated and divided
Ill. 10. Laboratory Facilities Sector In 'Laboratory Facilities Sector' the allocation of the laboratory facilities among instruction, research and project activities is made and the changes in laboratory facilities are calculated.
122
instruction loads. (See [5] for these and other experimental outputs.)
HI. 11. Assistants Sector
In 'Assistants Sector' the assistant workforce is calculated and the maximum available assistant hours for instruction overhead assignment is determined. These figures are used in graduate faculty instruction overhead and under-graduate faculty instruction overhead calculations. IV. V E R I F I C A T I O N OF THE MODEL
AND
VI. T H E U N I V E R S I T Y G A M E As the next step of the research, the model is converted into an interactive dynamic simulation game. Venapp feature of Vensim is used in building the game version [6]. In the game, the player plays the role of a university policy-maker, who is trying to seek a delicate balance among the main academic functions of the university, in order to get better output from these activities, both in terms of quality and quantity. The player does not have too many decision opportunities, because most of the factors are imposed by the environment the university exists in. The objective of the player is to make five decisions, so as to improve the indicators about the quality and quantity of the performance of the university, within the limitations imposed by outside factors. These decisions are New Graduate Students, Graduate Faculty Hiring Decision, Under-graduate Faculty Hiring Decision, Share on Income-generating-projects per Faculty Member and Weekly Release Time per Graduate Faculty Member (Figure 4). Sixty different performance indicators are displayed after each decision period. There is also detailed information option that the player can use in order to carry out more detailed causal analysis of the dynamics of the model (Figure 4).
VALIDATION
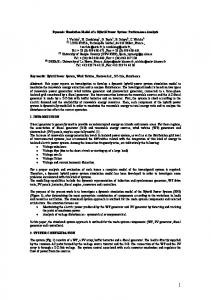
The model presented in this paper has been verified and validated by a series of tests. The first group of tests are verification tests. These tests are intended to determine whether the computer simulation works as it is expected to work. After the verification of the model, validation tests are done. Validation tests are grouped into two: (a) structure validation tests, which are done in order to determine whether the model has an adequate structure, by testing the behavior of the model under extreme conditions; (b) behavior validation tests, which are done in order to determine whether the behavior of the model resembles the behavior exhibited by the real system that was modeled. [2, 3]. To test the structural validation of the presented model, extreme condition and sensitivity tests have been applied. (It is impossible to present those results here due to lack of space, see [5]). Behavior validity was tested by comparing the behavior of the model with the data from Bogaziqi University-Istanbul. Some illustrative real system behavior patterns and model behavior patterns which were used for behavior validation are presented in Figure 2 and Figure 3. Observe that there is a reasonably good match between the real and the corresponding model generated behavior patterns. (See [5] for more extensive verification and validation results). V. E X P E R I M E N T S
After the game has been designed and validated, a group of players with different academic degrees and different orientations have played the game. Among the players are graduate students, teaching and research assistants, faculty members and administrators. The game results of these players are analyzed comparatively to explore the capabilities of the interactive gaming version of the model. The comparison of the game results of the players reveals that players with dJfferent orientations emphasize different performance measures. For example, a faculty member who believes that research is the most important function of a university plays the game quite differently than a faculty member who thinks it is crucial for the university to generate its own income from consulting projects. (We are unable to show these outputs, due to lack of space. See [5].)
WITH THE MODEL
After the verification and validation tests, some simulation experiments are carried out with the model in order to show its simulation capabilities. For example, simulation runs are made to compare the results of increasing and decreasing under-graduate students/graduate students ratios. The results of these simulation runs show that an important effect of higher graduate study orientation is higher research and projects productivity per faculty member. Another example of simulation experiments deals with the effects of different under-graduate class sizes. It is observed from the results of these simulation runs, that keeping class sizes extremely low, under the condition of high student body may cause serious problems in maintaining the faculty body, because of decreasing faculty supply and increasing number of faculty members leaving, as a result of heavy
i"
VH. CONCLUSIONS The main objective of this researc,h was to construct an interactive dynamic simulation.model on which a range of problems concerning a university management system can be analyzed and certain policies for overcoming these problems can be tested. In order to construct such a simulation game, a system dynamics model of the academic aspects of a university system was built.
123
The model was calibrated using data from Bogaziqi University-Istanbul and the dynamic behavior patterns of the model were found to be consistent with the major historical time patterns obtained from Bo~aziqi University. Observing the results of these tests, it was concluded that the model is structurally and behaviorally acceptable.
[3] Barlas, Y., 1994, "Model Validation in System Dynamics", Proceedings of the 1994 International System Dynamics Conference, Methodological Issues Vol., pp. 1-10, Stirling, Scotland. [4] Cheit, E.F., 1971, The New Depression in Higher Education, Mc-Graw Hill, New York. [5] Diker, V.G., 1995, An Interactive Dynamic Simulation Model of a University Management System, M.S. Thesis, Institute for Graduate Studies in Science and Engineering, Bogaziqi University. [6] Eberlein, R.L. and Peterson D.W., 1994, "Understanding Models with Vensim", Modeling for Learning Organizations, (Ed: Morecroft, J.D.W. and Sterman, J.D.), Productivity Press, Portland, OR. [7] Forrester, J.W., 1961, Industrial Dynamics, Productivity Press, Portland, OR. [8] Graham, A.K., Senge, P.M., 1990, "ComputerBased Case Studies and Learning Laboratory Projects", System DynamicsReview, Vol. 6, No. 1, pp. 100-106. [9] GOriiz, K., et al., 1994, Higher Education, Science and Technology in Turkey and Abroad (in Turkish), TOSIAD Publications, Istanbul. [10] Mahmoud, M., Genta, P., 1993, "Microworld of an Open University: A Strategic Management Learning Laboratory", Proceedings of the 1993 International System Dynamics Conference, Cancun-Mexico, pp. 318327. [11] Meadows, D., 1989, "Gaming to Implement System Dynamics Models", Computer-Based Management of Complex Systems, (Ed: Milling, P. and Zahn, E.O.K., Springer Verlag, Berlin. [12] Morecroft, J.D.W., 1989, "System Dynamics and Microwodds for Policymakers", European Journal of Operational Research, Vol. 35, No. l, pp. 301-320. [13] Richardson, G., Pugh, A.L., 1991, Introduction to System Dynamics Modeling, Productivity Press, Portland, OR. [14] Saeed, K., 1993, "The Dynamics of Collegial Systems in the Developing Countries", Proceedings of the 1993 International System Dynamics Conference, Cancun-Mexico, pp. 444-453. [15] Sinuany-Stern, Z., 1984, "A Financial Planning Model for a Multi-campus College", Socio Economic Planning Sciences, Vol. 18, No. 2, pp. 135-142. [16] Ulusoy, G. (ed.), 1994, ATAS-Bogazifi University Science Conference, Bogaziqi University Publications, Istanbul. [17] Vemuri, S.R., 1982, "A Simulation Based Methodology for Modeling a University Research Support Service System", Socio Economic Planning Sciences, Vol. 16, No. 3, pp. 107-120. [18] -, (OECD Report), 1990, Financing Higher Education, OECD, Paris.
Simulation experiments with graduate versus undergraduate study orientation showed that graduate study orientation has considerable positive effect on research output. In other experiments, assuming different desired under-graduate class sizes revealed that keeping class sizes extremely low, under the condition of high student body may cause serious problems in maintaining the faculty body, because of decreasing faculty supply and increasing number of faculty members as a result of heavy instruction loads. A group of players with different academic degrees and orientations played the game and their game results were compared to ex'plore the capabilities of the interactive gaming version of the model. The comparison of the game results of the players revealed that players with different orientations emphasized different performance measures. Results reported so far are part of an ongoing research project. At this stage, we can statethat the simulation model and the interactive game have proven to be a useful laboratory to support not only practical debate, but also theoretical research on how to best deal with strategic university management problems. We are currently in the process of identifying and initiating further research on the existing model and the gaming interface. The model can be extended to include more aspects of the university system, such as budget considerations, support staff and in general more detailed representations of variables such as facilities, infrastructure and projects. Also, the gaming interface can be enhanced to include various new features. Another research extension would be to build different versions of the game, each emphasizing different aspects of the university management system.
VIII, REFERENCES [1] Andersen, D.F., et al., 1990, "Issues In Designing Interactive Games Based on System Dynamics Models", Proceedings of the 1990 International System Dynamics Conference, Vol. 1,. pp. 31-45, Chestnut Hill-Massachusetts. [2] Barlas, Y., 1989, "Multiple Tests for Validation of System Dynamics Type of Simulation Models", European Journal of Operational Research, Vol. 42, No. 1, pp. 59-87.
124
N u m b e r o f Graduate and Undergraduate Students 8~00o
. f 1 I- 1.
1,400
t
4,000 700
~,~-~
I
""
~"
0
2
4
6
8
10 12 Time
14
16
18
20
Number of UG Students - BASE RUN Number of Grad Students - BASI~ RUN
The Dynamic Behavior of Number of Students in the Base Run Graph for Number of Faculty 400 f
v
...-- / 300
200
100
o
I 0
2
4
6
8
l0 Time
12
14
16
18
Number of Faculty - BASERUN
20 faculty
The Dynamic Behavior of Number of Faculty Members in the Base Run Graph for Research Papers per Faculty Member 1.6
1.2
"~
~
~
F
.8
.4
0 0
2
4
6
8
10
12
14
16
18
20
Time Research Papers per Faculty Member - BASE_RUN
The Dynamic Behavior o f Number of Research Papers per Faculty Member
in the
Figure 2. Output Behavior o f the Model in the Base Case.
126
Base Run
Number of Graduate and Undergraduate Students 8,000 1,400
4,000 700
"
1984
1986
1988 Ye~
1990
1992
Number of Undergraduate Students - REALDATA Number of Graduate Students - REALDATA
Number of Faculty Members 400
300
/
I
200
100
0 1984
1986
1988 Year
1990
1992
NumberofFaeultyMembers-REALDATA
Research Papers per Faculty Member 1.6
\ .8
J
~
J
f
\ \/ . /
.4
0 1984
1986
1988 Year
1990
1992
Research Papers per Faculty Member - REALDATA
Figure 3. Real System Behavior According to Data from Bo~azi~i University
127 .. ~: ~c . . ¸ ~ .,~; z~.~ ~.: )~. ~
....
I1
ii, ,iiTi i,,,, °...,
~.~ ~~"ii
~l. 1 ~!.-: .
1.1
o~
N l#~,g}i
128