An Interactive Web-Based Tool for Multi-Scale Physiological Data Visualization.
M Oefinger , W Zong , M Krieger , RG Mark. MIT Department of Electrical ...
An Interactive Web-Based Tool for Multi-Scale Physiological Data Visualization M Oefinger , W Zong , M Krieger , RG Mark MIT Department of Electrical Engineering & Computer Science, Cambridge MA, USA Beth Israel Deaconess Medical Center, Harvard Medical School Boston MA, USA MIT Department of Biology, Cambridge MA, USA Harvard-MIT Division of Health Sciences & Technology, Cambridge MA, USA 1.
Abstract
Pre-clinical cardiovascular studies at MIT’s Department of Biology require a thorough trend analysis of ECGderived parameters such as heart rate, ST-segment amplitude relative to the isoelectric point, arrhythmias, etc. Utilizing a system for high-throughput data acquisition as a platform [1], we devised a web-based visualization tool providing an interactive rapid data mining capability. This tool permits intuitive ’point-and-click’ usage to explore vast quantities of data with ease and speed. We use a multi-scale graphical data representation in which a top panel contains averaged data with each point representing approximately 10 minutes of averaged data; a middle panel contains the 10-minutes of instantaneous trend data comprising the point selected from the top panel; and a bottom panel contains the underlying ’raw waveform’ (ECG data, in this case). We currently utilize this tool in explorations of long-term heart rate trends in pre-clinical subjects, but the visualization paradigm is easily adapted to other derived parameters or signals of interest. An example screen shot of the visualization tool is shown in Figure 1.
Studies of cardiovascular pathophysiology require an understanding of long-term trends of disease development in monitored subjects, and ECG is the primary signal of interest in such studies. An effective analysis most often relies upon an iterative viewing of an interesting feature in a long-term derived trend (heart rate, for example) and subsequent location of the underlying ECG waveform for a finer-resolution visualization. Traditionally such an iterative process is time-consuming, labor-intensive, and inaccurate. We developed a novel ’point-and-click’ technology that allows extremely efficient isolation of raw physiological waveforms of interest based on long-term trend plots. The paradigm is as follows: a threepaned window shows, in the uppermost pane, a long-term ECG averaged feature trend (e.g. heart rate), which is automatically created by pre-processing software. Each data point in the top pane consists of approximately ten minutes of averaged data. By clicking on any given point in this uppermost plot, the middle pane fills with a timeseries plot of instantaneous data from which the above data point was derived. Clicking on any point in the middle pane (e.g. instantaneous heart rate) causes the bottom plot to show the signal waveform (e.g. ECG) corresponding to that moment in time. The technology we developed utilizes multiple open-source software packages, including SVG, CSS, and CGI with back-end C-compiled binaries and Perl scripts that generate the graphics dynamically. This interactive web-based software tool has turned a process of manually converting and charting data, which required weeks of work and extensive use of paper charts, into an entirely automated, paperless process that generates results in minutes, allowing the user to analyze long-term data with unprecedented efficiency. It can be extended to handle multiple feature trends, such as ST level, QRS width, etc. or correlation plots (e.g. QRS width vs. heart rate), where regions of interest need visual verification, and may also be adapted to other similar physiological signals.
0276−6547/04 $20.00 © 2004 IEEE
Introduction
2.
Methods
2.1.
XML-based web graphics: SVG
The need for web-based visualization tools has spawned many graphics technologies over the past decade, two of the most widely utilized being Flash and Java applets (with Swing or AWT). The closed-source nature of Flash precludes the design of a dynamic server graphics rendering engine driven by a web client using CGI (Common Gateway Interface). Though Java graphics can provide sufficient power and flexibility to support dynamic webbased graphics rendering (when properly integrated with CGI engines), such an architecture is somewhat “heavy” from a programming perspective. That is, one must import many specialized modules and write customized event handlers for point-and-click recognition in Java. We are currently in the process of porting our code to Java,
569
Computers in Cardiology 2004;31:569−571.
case the respective middle panels load with the appropriate ten minutes of instantaneous heart rate comprising the data point selected; the lower panels load with the respective first slices of ECG corresponding to the first several seconds associated with the ten-minute segment of interest. The ’previous’ and ’next’ buttons in the lower panel allow the user to peruse the ECG waveform in a forward or reverse sense from the selected point in time, or said another way the tool maintains state for each user. However, since multiple asynchronous users may be accessing records, the burden of tracking state can be a cumbersome task. If we require that the server perform state tracking, then it must maintain a database of the IP address, record, and currently active page number of each active user. Moreover, given that HTTP is a connectionless protocol the server cannot be aware of whether a client’s session is active any longer. Therefore if we were to require that the server perform state tracking, we would necessarily require either an explicit logout signal from the client, which is an inconvenience to the user - or we would require a ’garbage collection’ mechanism to clear database entries that had not been updated within a specified time window. As a simpler alternative to imposing state tracking on the server, we can utilize distributed state tracking by forcing the client to maintain state. Programmatically such an architecture involves wrapping the SVG code within HTML that has Java-Script variables initialized by the client’s browser. Therefore each subsequent request from the user will send to the server the Java-Script state variables via CGI to “remind” the server of that client’s state, from which the server can generate dynamically an appropriate SVGencoded graphic with new state variables.
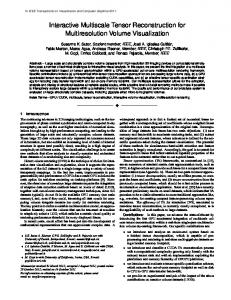
Figure 1. A sample multi-scale plot. The top panel shows long-term heart rate with light and dark cycles. Each data point represents 10 minutes of averaged heart rate. In the middle panel is the instantaneous heart rate comprising the 10-minute averaged data point most recently clicked in the top plot. The bottom plot shows the first segment of ECG corresponding to the time of interest. The user may browse the ECG chart with the previous and next buttons. as the language does have some distinct flexibilities and assets that will accommodate future software developments. Nonetheless, we built our prototype using SVG, as we found that it provided a solid foundation for our goals. Given SVG’s native point-and-click integration with HTML as well as its built-in zoom and pan functionality, we recognized it as a robust technology for fast prototyping of our web-based, point-and-click multi-scale visualization paradigm. SVG is a subset of XML and relies a client-side browser plug-in to perform the computationally intensive task of SVG parsing and graphics rendering using the client CPU rather than that of the server. Therefore the server must only generate XML graphics primitives such as coordinates of line segments and the corresponding URL to call when that segment is clicked upon; the client’s browser takes care of the graphics generation. The simplicity of XML-encoded graphics and the allocation of rendering to each client results in a maximally effective server that accommodates multiple users simultaneously.
2.2.
2.3.
Multiple simultaneous users: maintaining state
Consider the example in which two users are simultaneously browsing different records. One client clicks on the n data point of record A’s long-term heart rate plot (top panel) and another client clicks on the m point of record B. In each
570
Parallel computing environment for time-averaged chart generation
Each of the 16 channels in our pre-clinical mouse lab is sampled at an effective sampling rate of 2kHz. With this high data throughput and our need to perform ’on-thefly’ algorithmic analysis of the data comes an extraordinary burden on the server CPU and I/O controllers. As we have continued to add more algorithms the demand on the main server has exceeded its capabilities, and we therefore decided to provide additional servers operating in parallel with the main server. One of the parallel servers is constantly monitoring the main server for new 10-minute segments of data. Upon recognizing that new data is ready, this second server runs an algorithm to calculate the average heart rate of that 10-minute data segment and creates an SVG-encoded trend plot graphic with the averaged heart rate points. This plot is then placed in the proper location on the main server for access via the web.
3.
Results
impossibility of absolutely perfect automated detection while making a best effort to relieve the relieve the researcher of classifying the entire record manually.
In our original quest to visualize vast data sets in an intuitive manner, we utilized several software packages including Matlab and Microsoft Excel. These software packages permitted us to format data and create charts, but the memory limitations of these programs relegated our efforts to small data slices that we then printed and collated into large notebooks for visual data mining. Aside from wasting a substantial amount of paper, the logbooks were tedious to prepare, requiring a week or more of manual effort per record. Even with this effort invested we found that the resulting visual preparation was inadequate for our needs. We sought to take a “mile high” view of heart rate trends for a record, then zoom in on local instantaneous heart rate features at the corresponding time, and finally to view the underlying ECG waveform at the time point of interest. Such an approach was impractical, if not impossible, with our paper logbooks. (Our ECG data was collected at a rate of over 2kHz per subject and some subjects contain data collected for over 7 weeks continuously.) Moreover, reviewing data with remote collaborators was impossible without either having our collaborators go through the same laborious paper printing and collation effort we endured or printing multiple copies ourselves then mailing them. Upon completion of our prototype for interactive data mining, we could share results immediately and visually via the web with authorized collaborators. In our multi-scale architecture the top panel shows a 10-minute averaged trend plot; the middle shows the instantaneous 10-minute trend comprising the selected point from the top plot; and the lower panel shows the ECG waveform. Utilizing SVG we created an intuitive point-and-click environment in which clicking on a point of interest in the top panel generates the corresponding instantaneous heart rate and ECG plots in the middle and lower panels, respectively. Clicking on any point in the instantaneous heart rate plot (middle panel) forwards the ECG signal (lower panel) to the corresponding point in time. Utilizing this method we may quickly identify false positives, missed beats, arrhythmias and other ratebased cardiac phenomena of interest.
4.
5.
Conclusion
In Tufte’s description of graphical excellence [3], he says that graphical displays should: induce the viewer to think about the substance rather than about methodology, graphic design, the technology of graphic production or something else and ... reveal the data at several levels of detail, from a broad overview to a fine structure. With Tufte’s recommendations in mind we created with an architecture that is extremely intuitive, using the nowfamiliar point-and-click capabilities of modern software. The manner in which the graphics are generated is complex, utilizing a distributed state machine approach to handle multiple simultaneous users, dynamic generation of SVGencoded graphics through CGI, and a parallel computing environment to perform the computationally intensive task of generating ’high-level’ long-term trend plots. A user of the software, however, need not worry about the manner in which the graphics are generated; he may focus on his intended task of interpreting the graphics. Graphical presentation is a ubiquitous part of data analysis, and yet it is cumbersome and all too often occupies many hours and often ultimately yields unwieldy results. With our multi-resolution interactive web-based plots we have automated the requisite graphical presentation of vast amounts of data in a manner that presents the user with a consistent look and feel while empowering the user with tremendous interactive data mining capabilities.
References [1] Oefinger M, Moody G, Krieger M, Mark R. System for remote multi-channel real-time monitoring of ecg via the internet. Computers in Cardiology 2004;. [2] Dorn R, Jager F. Semia: semi-automatic interactive graphic editing tool to annotate ambulatory ecg records. Computer Methods and Programs in Biomedicine 2004;75,235–249. [3] Tufte E. The Visual Display of Quantitative Information. Graphics Press, 2001.
Discussion Address for correspondence:
With the ability to identify events of interest visually using our multi-scale plots comes the foundation for creating algorithms for semi-automated detection of such events. Existing Holter-like software, such as that created by Dorn et al [2] utilizes a similar paradigm to performs intelligent pre-processing of data to detect probable events of interest. The user may then annotate the events manually, providing the ultimate say as to how the pre-processing algorithm performed. Such a system accounts for the
Matthew Oefinger Laboratory for Computational Physiology MIT Department of Electrical Engineering & Computer Science Rm E25-505, 45 Carleton St., Cambridge MA 02142 USA
[email protected] This research was sponsored by NIH grant #PO1HL66105
571