An Object Placement Advisor for DB2 Using Solid State Storage Mustafa Canim
George A. Mihaila
University of Texas at Dallas Richardson, TX, USA
IBM Watson Research Center Hawthorne, NY, USA
[email protected]
[email protected]
Kenneth A. Ross
IBM Watson Research Center Hawthorne, NY 10598
[email protected] Christian A. Lang
Columbia University New York, NY, USA
IBM Watson Research Center Hawthorne, NY 10598
[email protected]
[email protected]
ABSTRACT Solid state disks (SSDs) provide much faster random access to data compared to conventional hard disk drives. Therefore, the response time of a database engine could be improved by moving the objects that are frequently accessed in a random fashion to the SSD. Considering the price and limited storage capacity of solid state disks, the database administrator needs to determine which objects (tables, indexes, materialized views, etc.), if placed on the SSD, would most improve the performance of the system. In this paper we propose a tool called “Object Placement Advisor” for making a wise decision for the object placement problem. By collecting profile inputs from workload runs, the advisor utility provides a list of objects to be placed on the SSD by applying heuristics like the greedy knapsack technique or dynamic programming. To show that the proposed approach is effective in conventional database management systems, we have conducted experiments on IBM DB2 with queries and schemas based on the TPC-H and TPC-C benchmarks. The results indicate that using a relatively small amount of SSD storage, the response time of the system can be reduced significantly by considering the recommendation of the advisor.
1.
Bishwaranjan Bhattacharjee
INTRODUCTION
Solid state disks (SSDs) have been introduced by a number of vendors in the last few years. SSDs provide persistent data storage using a form of solid-state flash memory. To the operating system, they appear just like a conventional disk device. Unlike hard disks, which have a mechanical latency associated with seeks and rotation, there is a very small overhead for random access to data relative to sequential access. As a result, a solid state disk can support one to Permission to copy without fee all or part of this material is granted provided that the copies are not made or distributed for direct commercial advantage, the VLDB copyright notice and the title of the publication and its date appear, and notice is given that copying is by permission of the Very Large Data Base Endowment. To copy otherwise, or to republish, to post on servers or to redistribute to lists, requires a fee and/or special permission from the publisher, ACM. VLDB ‘09, August 24-28, 2009, Lyon, France Copyright 2009 VLDB Endowment, ACM 000-0-00000-000-0/00/00.
two orders of magnitude more random I/O operations per second than a hard disk [8, 17]. Currently, SSDs are more expensive than traditional hard disks when measured in gigabytes per dollar, or in terms of sequential I/Os per second per dollar. However, SSDs provide better value than hard disks if one measures random I/Os per second per dollar [8]. Thus, SSDs provide an opportunity to improve the performance of a system if it typically incurs a lot of random I/O. At the same time, one does not typically want to put all of one’s data on SSDs, because the cost per gigabyte is higher than on a hard disk. Ideally, one should put “just enough” data on SSD storage so that a large fraction of the potential random I/O savings can be realized. Beyond a certain point, the marginal gains in random I/O saving may be small, and outweighed by the increased cost of the extra SSD devices. Consider Bob, the database administrator for a large corporation.1 Bob is likely to need answers to the following questions: • If I bought a single SSD device that can accommodate only part of my data, which data should be placed on it? • Given the answer to the previous question, how much better would my performance be? • Would it be worth the expense to purchase multiple SSD devices? • What aspects of SSD performance should I care most about when choosing an SSD product? If these questions are not adequately addressed, then Bob could easily make one of the following poor decisions: • Buying a reasonable amount of SSD storage, but using it suboptimally, so that the apparent benefits are smaller than what is possible. 1 The questions listed would also be appropriate for the administrator of any complex system with persistent storage, such an an operating system or file system, but our focus in this paper is on database systems.
• Not buying any SSD storage, because a trial-and-error approach to placing objects on SSDs did not yield significant savings, even when there were significant benefits available with an informed data placement choice. • Incurring the cost of buying too much SSD storage, when less SSD storage would have performed just as well. • Buying the wrong kind of SSD storage, with the aspects of SSD performance most critical to the application having not been the aspects on which the product choice is made. These are real concerns in today’s marketplace. Consider the following comment made by the editor of a market survey on the potential use of solid state disks in industry [13]: The fact that over half the responders cited performance guarantees as a gating factor to buying SSDs suggests that users have seen far too many unmet promises about performance in other aspects of their IT experience... One problem is that the application speedup in practise is going to vary according to the hardware environment and application. The pure performance of the product does not tell the whole story. Answering Bob’s questions in the context of a database system is challenging. • Current cost-based query optimizers can take account of disk characteristics in order to estimate execution times. However, until now, disk characteristics within a single installation have typically been relatively uniform. Thus there has been little need for a database utility to consider the various options for data placement. • Even if a query optimizer is intelligent enough to distinguish between sequential and random I/Os, there are numerous run-time issues that make these estimates extemely rough. For example, caching of data in the buffer pool can radically alter the profile of physical data accesses. • While a database administrator may have access to certain kinds of run-time performance data about queries, such data is relatively difficult to gather systematically without support from a database utility. Further, performance data typically does not associate I/O behavior with data objects within a query. Thus it is generally not possible to apportion the performance numbers of a query to the individual objects (tables, indices, materialized views, etc.) used by the query. Our goal in this paper is to overcome these difficulties so that a database administrator like Bob can make informed decisions about object placement, and make good use of limited SSD resources. We have designed and implemented a tool that gathers run-time statistics on I/O behavior from an operational database residing on hard disk(s). By creating a benchmark installation in which each object is in its own tablespace, we are able to gather information about the random I/O behavior of each object without modifying the database engine code.
We profile the application workload in this benchmark installation to gather statistics for each database object. We calibrate each SSD device off-line to determine its sequential and random I/O performance for reads and (separately) for writes. Based on the workload statistics and the device characteristics, we determine which objects would get the “best bang for the buck” by ranking them according to the expected performance improvement divided by the size of the object. We use a greedy heuristic to choose the highest-ranked objects one by one (in rank order) until no more objects fit within our SSD space budget. These chosen objects are our candidates for placement on the SSD device. We can create a variety of configurations with different space-time tradeoffs by varying the SSD budget. We also compare the greedy heuristic with a dynamic programming approach, which can generate better configurations for a larger variety of SSD space budgets at the expense of higher resource consumption (memory and CPU). To the best of our knowledge, ours is the first work that shows how to cost-effectively make efficient use of available SSD resources in an “industrial strength” database system, and to provide guidance to database administrators about the benefits to be expected from the purchase of SSD devices. We evaluate the performance of the placement advisor on TPC-C and TPC-H-like workloads. We construct the workloads to model a transactional database and an operational data store, respectively, that are expected to support both interactive queries and updates. The TPC-H queries are modified somewhat to query smaller fragments of the database, as might be more typical of an operational data store relative to a (read-mostly) data warehouse. When a relatively small amount of data is consulted for a query, random I/O performance becomes more important.2 In the evaluation, we use a database instance with access to both a hard disk and an SSD, and place the data according to one of several methods. We compare our method with three other options: 1. Place all data on the hard disk. 2. Place all indexes on the SSD, and all base tables on the hard disk. 3. Place all data on the SSD. The second option is based on the observation that index accesses often involve random I/O. This option is likely to be the one chosen by a database administrator (DBA) in the absence of any design advisor tool. Our results show that we can obtain significant speedups relative to the default strategy of placing all of the data on the hard disk. For example, on the TPC-H database, the hard-disk-based placement takes 139 minutes. We generate a set of configurations with various space-time trade-offs; 2 Our technique is not limited to operational data stores, or to workloads dominated by random I/O performance. Because our SSD device and hard disk happened to have very similar sequential read bandwidth, our specific SSD provided little improvement for scan-dominated workloads. However, SSDs with faster sequential I/O are available, and would (at a higher cost) provide speedups for sequential access too.
one of these recommended configurations takes just 68 minutes using 1.8 GB of SSD space. These results are much better than the naive strategy of placing just the indexes on the SSD, which for the TPC-H database takes 117 minutes, and uses 5.5 GB of SSD space. Placing all data on the SSD is fastest, taking 53 minutes. However, this configuration requires 39 GB of SSD space, an order of magnitude more than our recommended placement. The various space-time trade-offs allow a DBA to make choices about how much to invest in SSDs. If time is very important, then an organization might spend more on SSD devices in order to obtain even moderate marginal gains. Nevertheless, even a wealthy organization should not spend money on additional SSDs when the marginal gains are close to zero. It is common practice to use only a small fraction of a physical hard disk for database data (typically just the outer tracks) so that seek times are small, a technique known as “short-stroking” [23]. If additional space is needed, a performance-sensitive DBA might choose to buy an extra hard disk rather than use the remaining space on existing disks. That way, each disk still has shorter seek times, and multiple disk heads can be seeking in parallel.3 In this context, using an SSD for randomly accessed data can have secondary cost benefits. By moving the randomly accessed data to the SSD, the hard disks are left with data that tends to be accessed sequentially. As a result, it might be possible to use more tracks of each disk without incurring substantial extra seek time, and fewer disks would be needed. Additionally, by reducing the load on the disks, one might reduce overall power consumption because SSDs generally consume less power than hard disks. In modern databases, storage characteristics are specified while creating the tablespaces so as to help the query optimizer choose a better query execution plan [10]. For instance, a query could be executed with RID list fetch plan if the storage device has very small average latency whereas the same query could have been executed with a table scan plan on a device with a higher average latency. Since the placement advisor considers the estimates from the profiling phase where the objects are placed on the HDD, the total execution times may not exactly match the expected execution times after the objects are moved to the SSD. Due to the changes in the plans, the workload execution may take shorter or longer than what is expected.4 The placement advisor could also be used to estimate and compare the performance benefits if different SSD devices are being considered for purchase. There are many different SSD products on the market, with very different performance and cost characteristics. One major distinction between these products is the interface that is used to connect the devices to the servers. Some of these options are: Fibrechannel, parallel SCSI, Parallel ATA, Bus (includes PCI, PMC, SBus, VME etc), Serial Attached SCSI (SAS) [13]. Although it seems advantageous to have plenty of options, it may not be easy to determine which option is best suited for a specific system. This is because for each device, the 3
If the DBA does this, then the cost of an SSD might actually be competitive per “useful” gigabyte with the cost of a hard disk. 4 With a perfect optimizer, and an SSD having superior performance to a hard disk, one would only see an improvement as one moves to an SSD.
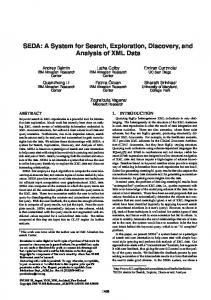
cost to provide data throughput for random and sequential reads and writes will vary. Consider the following hypothetical scenario in which the Object Placement Advisor would be helpful in comparing different SSD products. Suppose two alternative SSD devices with specifications given below are under consideration for improving the performance of a database management system. Product B provides 5 times faster sequential access compared to Product A, while the random access speed of Product A is twice that of Product B. As for the price per GB of storage, Product B is twice as expensive as Product A. Given these specifications, the Object Placement Advisor might yield the chart given in Figure 1 after collecting profiling results of a workload running in the DBMS. If the budget is less than $60,000, then purchasing Product A would be a cost effective decision since it provides more improvement per dollar relative to B. If we have an SSD budget of $100,000 or more, then Product B would be preferred since the total performance gain of purchasing more of Product A would be less. With the help of this chart, one can determine which product minimizes cost and thus provides a higher utility.
Figure 1: Performance comparison of different SSD products The remainder of the paper is organized as follows: first, we introduce the Object Placement Advisor in detail; then, in Section 3, we present the results of the experiments conducted on the IBM DB2 DBMS with queries and schemas based on the TPC-H and TPC-C benchmarks; we present an overview of the related work in Section 4; finally, we conclude in Section 5.
2.
OBJECT PLACEMENT ADVISOR
Similar to “REORG”, a built-in utility in DB2 [10], Object Placement Advisor is proposed as an off-line tool. The procedure of obtaining an optimal placement strategy consists of two phases: a “Profiling phase” and a “Decision phase”. Based on the collected run time statistics in the profiling phase, the estimated performance gain from moving each object from the HDD to the SSD is computed. Later on, these estimates are used in the decision phase to suggest an object placement plan. The proposed database environment is illustrated in Figure 2. Suppose that we have a database management system processing the incoming queries of a workload. The database includes hundreds of tables, materialized views and indexes
created on multiple tablespaces. Initially, these tablespaces are created on HDDs. On top of this storage system there is a database engine processing the queries and transactions coming from user applications. A monitoring tool attached to the database engine measures the time spent for both reading the pages from the storage device to the buffer pool and writing the dirty pages back to the disk. These measurements are sent to the placement advisor for evaluation. Having this profiling input, the Object Placement Advisor (OPA) outputs a Cost-Benefit graph showing different placement strategies and the corresponding performance gains for different capacity constraints. Based on these options, the database administrator determines the amount of SSD space to be purchased and moves the objects from the HDD to the SSD according to the suggested placement plan. In the following sections we will first discuss how profiling data is collected while running a query workload and then describe how to generate alternative placement strategies based on the estimated improvements.
Figure 2: Object Placement Advisor (OPA) illustration
2.1
Profiling Phase
The goal of the profiling phase is to collect profiling information about the disk access costs for each database object during the execution of a query workload. This information includes the number of physical disk accesses such as sequential and random reads and writes and average page access costs for all objects in a single tablespace. IBM DB2’s snapshot utility is used to collect the profiling data at the table space level [10]. Using this utility, one can monitor activities on all buffer pools, tablespaces, and locks etc. Some of the parameters included in a typical output of a buffer pool snapshot are given in Table 1. These parameters are used to measure the average sequential and random disk access costs of the pages pertaining to the objects as described below.
2.1.1
Average sequential access cost of a page
The parameters obtained from the snapshot report can be used to find the cost of sequential accesses. Whenever
Table 1: A sample buffer pool snapshot report for a tablespace. Bufferpool name = IBMDEFAULTBP Database name = TPCH Snapshot timestamp = 07/17/2008 12:19:14.265625 Buffer pool data logical reads = 98 Buffer pool data physical reads = 27 Buffer pool temporary data logical reads = 0 Buffer pool temporary data physical reads = 0 Buffer pool data writes = 2 Buffer pool index logical reads = 214 Buffer pool index physical reads = 91 Buffer pool temporary index logical reads = 0 Buffer pool temporary index physical reads = 0 Total buffer pool read time (ms) = 947 Total buffer pool write time (ms) = 3 Asynchronous pool data page reads = 0 Asynchronous pool data page writes = 0 Buffer pool index writes = 0 Asynchronous pool index page reads = 0 Asynchronous pool index page writes = 0 Total elapsed asynchronous read time = 0 Total elapsed asynchronous write time = 0 Asynchronous data read requests = 0 Asynchronous index read requests = 0
the pages of an object need to be read sequentially from the disk, DB2 uses prefetchers which issue asynchronous read requests. Agents of the application send these asynchronous requests to a common prefetch queue. As prefetchers become available, they fulfill these requests to fetch the requested pages from the disk into the buffer pool [10]. Therefore, asynchronous access parameters can be used to find the sequential read cost for the ith table space. Similarly, the sequential write cost is attributed to the asynchronous write cost. The Total elapsed asynchronous read time in Table 1 represents the total time spent for sequential read operations. The Asynchronous pool data page reads value, on the other hand, provides the number of pages of a data object read sequentially. Dividing the first parameter to the second yields the Average sequential access cost of a page for a data object. For index objects the same method is applied except that the Asynchronous pool data page reads is replaced with the Asynchronous pool index page reads. For write operations, a similar methodology is applied for both data and index objects.
2.1.2
Average random access cost of a page
DB2 does synchronous I/O requests wherever it is not able to make the requests asynchronously (e.g., the range of the pages to be retrieved is relatively small). Therefore, synchronous access costs can be used to measure the total random access cost for both data and index objects. The buffer pool snapshot report does not include the synchronous I/O costs and the number of synchronous page accesses. However, these parameters can be computed using other parameters listed in Table 1. The total random read cost of the pages of an object is computed by subtracting the Total elapsed asynchronous read time from the Total buffer pool read time. This is applicable to the index objects as well as the data objects. By subtracting the Asynchronous pool data page reads from the Buffer pool data physical reads, we obtain the Synchronous pool data page reads which is the number of pages read randomly from the disk for the data objects. To compute the same parameter for the index objects, the Asyn-
chronous pool index page reads is subtracted from the Buffer pool index physical reads. To obtain the Average random access cost of a page for a data object, the Total elapsed synchronous read time is divided by the Synchronous pool data page reads. The same procedure is repeated to compute the Average random access cost of a page for an index object. For all write related parameters, the same procedure is applied by replacing the read related parameters with write related parameters.
2.1.3
SSD Device Characteristics
Before making placement decisions, the advisor needs to know the performance characteristics of the candidate SSD device(s). We measure the read and write performance of each device using a small set of straightforward sequential and random I/O microbenchmarks. In these microbenchmarks, we use a page size equal to DB2’s page size. The sequential and random per-page costs will be used during the decision phase.
2.2
Decision Phase
Once the profiling phase is completed, the profiling results including the number of physical page accesses and the average page access costs are forwarded to the OPA to be used in the decision phase. By considering the profiling data, the estimated improvements (gains) for each object are computed. Using these estimations and the storage costs of the objects, the decision problem is first represented as an instance of 0-1 knapsack problem. Then, one of the well known heuristics, the dynamic programming technique or the greedy technique, is applied to obtain alternative placement strategies and the corresponding performance gains for different capacity (or budget) constraints. A detailed comparison of various aspects of these techniques is provided in Section 2.2.3.
2.2.1
v[i, c] =
0, v[i − 1, c],
if i = 0 or c = 0 if ci ≥ c
max{γi + v[i − 1, c − ci ], v[i − 1, c]},
Otherwise
(1) This recursive definition specifies that an optimal solution Si,C for κi,C either contains Oi (i.e. v[i, c] = γi + v[i − 1, c − ci ]) or does not contain Oi (i.e. v[i, c] = v[i − 1, c]). If the object Oi is picked to be moved to the SSD, the gain will be γi and then another object can be picked from {O1 , O2 , ..., Oi−1 } up to the storage limit c − ci to get the improvement v[i − 1, c − ci ]. If the object Oi is not picked, an object from {O1 , O2 , ..., Oi−1 } up to the weight limit c, can be picked to get the improvement v[i − 1, c]. The better of these two choices should be made. Based on the recursive definition described above, the dynamic programming solution can be implemented. Greedy solution The greedy solution requires computing a priority value for each object. The priority value of the ith object is computed as5 :
Computation of Gain For Each Object
Since we have placed each object in its own tablepsace, the statistics for that tablespace reflect the access pattern for that object alone. There are four types of measurements: sequential read (SR), sequential write (SW), random read (RR) and random write (RW). Let j be one of {SR, SW, RR, RW }. Then nj (i) denotes the number of observed events of type j, hj (i) denotes the observed time taken by the hard disk to perform a page of I/O of type j for object Oi , and sj denotes the time taken by the SSD to perform a page of I/O of type j. Then the gain γi that can be obtained by moving the database object Oi from the hard disk to the SSD is given by X γi = nj (i) × (hj (i) − sj ) j∈{SR,SW,RR,RW }
2.2.2
problem. Let a subset S of objects be optimal for κn,C and Oi be the highest numbered object in S. 0 Then S = S −{Oi } is an optimal solution for subproblem 0 κi−1,C−ci = {O1 , O2 , ..., Oi : C − ci } with v(S) = γi + v(S ) where v(∗) is the value of an optimal placement “∗” (i.e. the total improvement that can be obtained using that placement plan). Then a recursive definition for the value of optimal solution would be as follows: Define v{i, c} as the value of an optimal solution for κi,c = {O1 , O2 , ..., Oi : c}.
Provisioning Problem
Consider a database with n objects ϕ = {O1 , O2 , ..., On } all stored on an HDD initially. For a given workload, relocating object Oi from the HDD to an SSD provides γi units of estimated improvement in terms of disk access time. The storage cost of the ith object is ci . The objective is to maximize the total improvement by moving certain objects to the SSD under the constraint of C units of SSD space. This is an instance of the classical 0-1 knapsack problem [6]. Dynamic Programming solution Let κn,C = {O1 , O2 , ..., On : C} denote the 0-1 knapsack
Pi =
γi ci
(2)
After this computation, the objects are sorted by their priority values in descending order. In this sorted list, the ith object is the ith best candidate that is recommended to be placed on the SSD. If c1 units of SSD space are planned to be purchased, the first object in the sorted list would be the best object to be moved to the SSD. If c1 + c2 units of SSD space are purchased, the first and second objects in the list would be the most recommended objects to be moved to the SSD. Similarly, the ith object in the list should be placed on the SSD provided that there is enough space to move the objects with lower indices to the SSD. Considering the budget(the amount of SSD space) and estimated total improvement, a cut-off point in the list is determined. All of the objects falling above this cut-off point are moved to the SSD while the rest of the objects are kept on the HDD. Thus, because it needs to sort the objects by their priority values the greedy algorithm runs in O(n log n) time. Using this strategy, the database administrator can do a budget planning and determine how much space should be purchased. The details of this technique will be discussed in Section 3.3. 5 The priority value is the gain per unit of storage (i.e. seconds of saved I/O time per megabyte of SSD storage).
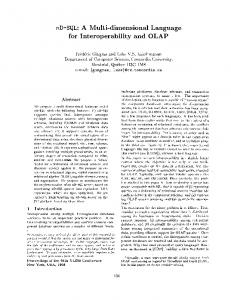
time. Once a placement plan is chosen, the suggested objects are moved to the SSD while the rest of the objects are kept on the HDD. Note that in Figure 4, the total gain is a non-decreasing concave function of the total budget. This is because in the greedy technique the objects are first sorted by their unit gains and then at each point less valuable objects are added to the placement plan. The DP solution, on the other hand, includes not only the placement plans suggested by the greedy technique but also the other plans that provide more overall utility but less per unit gain. The circled points in Figure 3 corresponds to the placement plans suggested by the greedy technique.
3. Figure 3: Cost - Benefit analysis using Dynamic Programming
EXPERIMENTS
To evaluate the effectiveness of the proposed technique, several experiments are conducted using TPC-H and TPCC benchmarks on the IBM DB2 database server. Before discussing the main experiment results, we will first describe the hardware and software specifications and present results from a preliminary experiment.
3.1
Hardware & Software Specifications
The system that is used to run all the experiments has an Intel(R) Core(TM)2 Quad CPU Q6600 @ 2.40GHz with 8MB L2 cache and 4GB memory. Hardware specifications are given in Table 2. Table 2: Hardware specifications Brand: Storage capacity: Interface: RPM: Cache size: Sequential Access Sequential Access Average latency Average latency -
Figure 4: Cost - Benefit analysis using Greedy Technique
2.2.3
Dynamic Programming vs. Greedy
The Object Placement Advisor can use either a dynamic programming technique (DP) or a greedy technique in the decision phase. The dynamic programming technique provides the DBA with more placement options and the corresponding performance gains for different capacity constraints. On the other hand, the greedy technique finds the placement strategies that maximize the per unit gain (e.g. second/dollar, second/MB). The trade-off between the two techniques is that the greedy technique is polynomial-time bounded in the number of objects while the execution time of the DP technique is proportional to the knapsack size. Also, the DP technique requires an amount of main memory proportional to the knapsack size multiplied by the number of objects, while the greedy technique’s memory requirements are proportional only to the number of objects. In Figure 3 and Figure 4, two cost-benefit graphs corresponding to the DP and Greedy Techniques respectively are given. These results were obtained by simulating an Operational Data Store environment described in Section 3.3. Each point in these graphs represents different object placement strategies. The X-axis represents the total cost of employing a particular placement strategy while the Y-axis represents the total improvement in the workload execution
- Read: - Write: Read: Write:
HDD Seagate 1 TB SATA 7200 32 MB 105MB/s 30MB/s