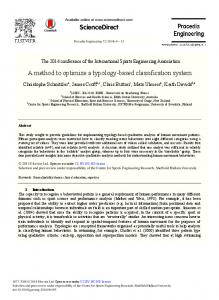
An Objective Method to Optimize the MR Sequence Set for Plaque Classification in Carotid Vessel Wall Images Using Automated Image Segmentation Ronald van ‘t Klooster1, Andrew J. Patterson2, Victoria E. Young2, Jonathan H. Gillard2, Johan H. C. Reiber1, Rob J. van der Geest1* 1 Division of Image Processing, Department of Radiology, Leiden University Medical Center, Leiden, The Netherlands, 2 University Department of Radiology, Cambridge University Hospitals NHS Foundation Trust, Cambridge, United Kingdom
Abstract A typical MR imaging protocol to study the status of atherosclerosis in the carotid artery consists of the application of multiple MR sequences. Since scanner time is limited, a balance has to be reached between the duration of the applied MR protocol and the quantity and quality of the resulting images which are needed to assess the disease. In this study an objective method to optimize the MR sequence set for classification of soft plaque in vessel wall images of the carotid artery using automated image segmentation was developed. The automated method employs statistical pattern recognition techniques and was developed based on an extensive set of MR contrast weightings and corresponding manual segmentations of the vessel wall and soft plaque components, which were validated by histological sections. Evaluation of the results from nine contrast weightings showed the tradeoff between scan duration and automated image segmentation performance. For our dataset the best segmentation performance was achieved by selecting five contrast weightings. Similar performance was achieved with a set of three contrast weightings, which resulted in a reduction of scan time by more than 60%. The presented approach can help others to optimize MR imaging protocols by investigating the tradeoff between scan duration and automated image segmentation performance possibly leading to shorter scanning times and better image interpretation. This approach can potentially also be applied to other research fields focusing on different diseases and anatomical regions. Citation: van ‘t Klooster R, Patterson AJ, Young VE, Gillard JH, Reiber JHC, et al. (2013) An Objective Method to Optimize the MR Sequence Set for Plaque Classification in Carotid Vessel Wall Images Using Automated Image Segmentation. PLoS ONE 8(10): e78492. doi:10.1371/journal.pone.0078492 Editor: Dewen Hu, College of Mechatronics and Automation, National University of Defense Technology, China Received May 27, 2013; Accepted September 12, 2013; Published October 23, 2013 Copyright: © 2013 van 't Klooster et al. This is an open-access article distributed under the terms of the Creative Commons Attribution License, which permits unrestricted use, distribution, and reproduction in any medium, provided the original author and source are credited. Funding: This study was funded by the Dutch Technology Foundation STW, which is the applied science division of NWO, and the Technology Programme of the Ministry of Economic Affairs. Project number LGT.6454. http://www.stw.nl. The funders had no role in study design, data collection and analysis, decision to publish, or preparation of the manuscript. Competing interests: The authors have read the journal's policy and have the following conflicts: JHCR is the CEO of Medis medical imaging systems bv. RJVDG received a consultancy fee from Medis medical imaging systems bv. AJP was supported by a Biomedical Research Centre grant. This does not alter their adherence to all the PLOS ONE policies on sharing data and materials. * E-mail:
[email protected]
Introduction
consists of the application of multiple MR sequences to obtain information about the lumen morphology and a detailed characterization of the vessel wall [4]. An optimal in-vivo MR imaging protocol should incorporate contrast weightings that can separate the tissue of interest from surrounding structures, have a sufficiently high spatial resolution and have a short acquisition time. Since scanner time is limited, a balance has to be reached between the number of applied MR sequences and how well different plaque components can be distinguished from each other on the resulting images. Latest developments in this field include the design of new MR pulse sequences, adaption of existing MR sequences to higher field strength, design of specialized carotid coils and development of 3D isotropic imaging [5]. Consequently, objective evaluation of the resulting images is
A multi-sequence MRI protocol is widely used to investigate the status of atherosclerosis in the carotid artery. Atherosclerosis is a progressive disease which, at an early stage, is characterized by vessel wall thickening causing outward remodeling, followed by narrowing of the lumen, and at a later stage by the formation of different plaque lesions inside the vessel wall [1]. Identification of vulnerable plaques, lesions with a high risk to rupture, before the development of cardiovascular events, is of high clinical relevance. These lesions are typically soft and contain a large lipid-rich necrotic core (LR/NC) or intraplaque hemorrhage (IPH) [2], which can both be identified by in-vivo MRI [3]. A typical MR imaging protocol for assessment of the carotid artery vessel wall
PLOS ONE | www.plosone.org
1
October 2013 | Volume 8 | Issue 10 | e78492
Objective Evaluation of MR Sequences
preserve the plaque components. Histological staining was performed with haematoxylin and eosin, elastic Van Gieson and nile red. The sections were digitized using a conventional microscope at 5X magnification (Leica DM LB2, Leica Microsystems, Wetzlar, Germany). The histological sections were visually matched with the MRI image data. For each patient at least one histological section was available which matched the imaging data. The matching sections served as ground truth for the manual image segmentation. MR imaging was performed on a 1.5T scanner (Signa HDx, GE Healthcare, Waukesha, WI) using a bilateral four-channel phased-array carotid coil (PACC, Machnet, Eelde, The Netherlands). The subject was positioned in the scanner with the carotid coils placed superficially over the anterior neck to cover the carotid artery centering on the carotid bifurcation. A vacuum constraining pillow system (Vac Lok Chushion, Oncology Systems Ltd, UK) was used to restrict head and neck movement. In total six MR sequences were acquired from which nine contrast weightings were extracted. A 2D time-of-flight (TOF) angiography sequences was employed to identify the diseased segment and the position of the bifurcation. High-resolution multi-contrast axial images were obtained through the diseaseaffected section of the artery. The protocol included fat suppressed T1-weighted (T1W), dual echo T2/proton densityweighted (T2W/PDW) and short-tau inversion recovery (STIR) fast spin echo sequences using cardiac gated double inversion recovery preparation for blood suppression. Direct Thrombus Imaging (MRDTI) was performed using an inversion recovery T1 weighting prepared 3D fast spoiled gradient echo sequence [9]. The MRDTI sequence was acquired in the coronal plane to negate blood flow effects. A single-shot diffusion-weighted echo-planar imaging sequence was used to obtain T2W (b = 0 s/mm2) and diffusion-weighted (DW) images (b = 500 s/mm2) [10]. T2W and DW images were subsequently used to compute apparent diffusion coefficient (ADC) maps. The three resulting images are further labeled as DWT2, DWI, and ADC throughout the text. The image slices had a minimum coverage of 21 mm of the disease-affected section of the artery. A full list of the imaging parameters is shown in Table 1. The MR imaging protocol and subsequent post processing resulted in nine contrast weightings (TOF, T1W, T2W, PDW, STIR, MRDTI, DWT2, DWI, and ADC) which were used for further analysis.
needed in order to determine the benefits of these continuous technological developments and the corresponding increase or decrease in scan time. In an earlier work, Zhao et al. [6], presented a method to minimize the number of MR sequences and its impact on manual quantification of plaque lesions in vessel wall MR imaging studies. However, the proposed method has several drawbacks as the method is subjective because sets of different MR sequences are evaluated by the same readers introducing bias of the readers to their previous segmentation result. Also, the number of combinations of sequences that could be evaluated was limited. Cappendijk et al. [7] used a logistic regression model to determine the optimal MR weighting combination for plaque assessment enabling objective assessment of different combinations of sequences. However, assessment was limited to plaque identification; plaque volume was not taken into account. In addition, no relation was shown between the selected combination of MR sequences and the total scan duration. In another study by Liu et al. [8] an automated segmentation algorithm using pattern recognition techniques was applied. In that study the training of the classifier was performed on the same data as for which it was tested rendering subsequent results unreliable. Again, no relation was shown between the selected combination of MR sequences and the total scan duration. Accordingly, the purpose of this study was to develop an objective method to optimize the MR sequence set for classification of soft plaque in vessel wall MR images of the carotid artery with respect to segmentation accuracy and total scan duration. Instead of using a human observer to investigate different sets of MR sequences and their impact on plaque classification, automated image segmentation was employed which is inherently exhaustive and objective. The method was developed based on an extensive set of MR contrast weightings and corresponding manual segmentations of the vessel wall and soft plaque components, which were validated by histological sections. The proposed method is generic and can also be applied to other fields of research in which multi-spectral image data, such as multi-sequence MRI, is acquired and automated segmentation algorithms are available.
Materials and Methods
Reference standard determined by manual image analysis
Ethics statement The study was approved by The Cambridgeshire Three Research Ethics Committee. Written forms of informed consent were obtained from all subjects before imaging. Sharing of image data into the public domain was not permitted in the approved study protocol.
Image data Fifteen patients (11 male, age range 50-89 years), scheduled for carotid endarterectomy, were pre-operatively scanned using MRI. Color Doppler ultrasound was used for surgical screening to confirm the presence of stenosis >70%. Carotid specimens were retrieved after carotid endarterectomy. The endarterectomy specimens were fixed and cryosectioned to
PLOS ONE | www.plosone.org
An experienced radiologist manually segmented the MR image data using the matching histological sections as ground truth to form the reference standard. The images from the nine contrast weightings were processed and manually segmented using the following steps: 1 2
T1W images were defined as reference images. The other contrast weightings were processed to match the reference images resolution and geometry using multiplanar reconstruction. 3 The histological sections were visually matched with the image data. For each patient at least one matching histology section was available.
2
October 2013 | Volume 8 | Issue 10 | e78492
Objective Evaluation of MR Sequences
Table 1. Carotid MR imaging pulse sequence parameters.
TOF
T1W
T2W/PDW
STIR
MRDTI
DWT2/DWI
Acquisition
2D TOF - Axial
2D FSE - Axial
2D FSE - Axial
2D FSE - Axial
3D FSPGR - Coronal
2D EPI - Axial
FOV (cm)
22x22
10x10
10x10
10x10
10x10
16x16
pFOV
1
1
1
1
1
0.5
Matrix
512x512
256x256
256x256
256x256
160x160
128x128
NEX
1
2
2
2
1
16
TR (ms)
16.6
1R-R
2R-R
2R-R
5.7
2200
TE (ms)
4.1
7.7
99.7/7.7
99.7
2.6
~75
TI (ms)
-
-
-
150
19.0
-
Slice thickness (mm)
2
3
3
3
1
3
ETL
-
12
16
24
1
-
Fat suppression
No
Yes
Yes
Yes
No
Yes
In-plane resolution (mm)
0.86
0.39
0.39
0.39
0.625
1.25
0:48
5:22
8:24
5:36
2:09
4:42
Scan Time (min:sec)
a
a. Scan times for either a 3D slab or multiple consecutive 2D slices compassing 21mm of carotid/plaque (assumes heart rate of 60bpm) doi: 10.1371/journal.pone.0078492.t001
A pattern recognition system consists of a sensor that gathers the observations to be classified, a feature extraction mechanism that computes numeric or symbolic information from these observations, and a classifier that, based on these features, can classify the observations into different classes. In this study, the observations included the image slices of the nine contrast weightings and the manually segmented vessel wall contours. For each vessel wall pixel a number of features were extracted. These features contained normalized MR signal intensities and image gradient information. Based on these features, each observation was classified as soft plaque, defined as being LR/NC and/or IPH, or not being soft plaque. Calcium was not identified since the calcium regions were relatively small and the number of examples in the available image data was low. Feature extraction. Prior to feature extraction, the vessel wall images were normalized by dividing the signal intensities by the median value of a 4 by 4 cm region of interest located at the lumen center [8]. This normalization step is required for comparing the different sequences of a single subject, as well as for inter-subject comparison. Subsequently, for each pixel inside the vessel wall the following features were extracted: the normalized signal intensity, zero-, first and second order derivatives at multiple scales (0.25, 0.5, 1.0 and 2.0 mm) from each of the vessel wall images. The zero-, first and second order derivative features were calculated using the RecursiveGaussianImageFilter of the open-source Insight Segmentation and Registration Toolkit (http://www.itk.org). The zero order derivatives are equivalent to blurred versions of the normalized signal intensities, the first and second order derivatives contain edge and texture information of the images. Training and testing a classifier. The features of each observation served as input for a classifier. The classifier used is a Mahalanobis distance classifier, which is a type of Bayes classifier. A similar segmentation algorithm with a Bayes classifier was presented by Hofman et al. [12]. This is a supervised classifier that needs example observations and its corresponding classes in order to train the classifier. During the
4
The lumen and outer contours were manually delineated on the T1W images by an experienced radiologist using CMRtools (Cardiovascular Imaging Solutions, London, UK). This software was also used, for subsequent steps 5 & 6, for the manual alignment of image slices and the delineation of plaque components. 5 The other MR sequences were manually aligned to the T1W image by translating the image slices in-plane to match the lumen and outer contours resulting in a set of aligned multicontrast images. 6 The segmentation of the plaque components was performed by evaluating the images in the aligned set assisted by the available histology data. The plaque component contours were defined on the image where they could be seen most clearly. The expert manually delineated IPH, LR/NC and calcium regions. Finally, the contours of IPH and LR/NC were combined and labeled as soft plaque. The manual image analysis resulted in an aligned set of vessel wall images including manual segmentations based on histology. The manual segmentation is further referred to as the reference standard in the remainder of the manuscript.
Automated image segmentation using statistical pattern recognition Several methods for segmentation of plaque components in the carotid artery have been described in literature, the majority employing statistical pattern recognition techniques [8,11–13]. Similarly, a pattern recognition system, developed using PRTools [14] and MATLAB (2009b, The MathWorks, Natick, MA, USA), was used to automatically classify the pixels within the vessel wall based on the different MR signal intensities. Vessel wall pixels were defined by the reference standard; the manually delineated contours of the lumen and outer wall. A standard PC was used to run the pattern recognition system software.
PLOS ONE | www.plosone.org
3
October 2013 | Volume 8 | Issue 10 | e78492
Objective Evaluation of MR Sequences
Figure 1. Scheme of the contrast weighting selection and the automatic image segmentation procedure. The procedure is started by the selection of a combination of contrast weightings. The automated image segmentation method is applied to that combination of contrast weightings and the reference standard which is based on the manual segmentation. The automated segmentation results are compared with the reference standard. This automated image segmentation procedure is then repeated for each contrast weighting selection and results of each combination are collected. doi: 10.1371/journal.pone.0078492.g001
Results
training phase, the features and the classes were used to learn statistics describing the example data. Once trained, the classifier can assign a class to unseen observations. Because of the relatively low number of patients, leave one out cross validation was used for training and testing the classifier. Data from one patient is used as the testing set, and the remaining patients are used as the training data. This is repeated such that each patient in the population is used once as the testing set.
Image data from 15 patients was analyzed by the manual observer and the automated image segmentation method. The presence and volumes of the plaque components in the patient population obtained by manual image analysis are given in Table 2. In total 75 vessel wall slices (five slices per patient) were analyzed using the automated image segmentation method. The automated segmentation method was repeated for each combination of contrast weightings. The number of combinations which were tested was 511 (29 - 1). The selected contrast weightings, correlations, CIs, p-values and corresponding scan durations are available in the Table S1. Figure 2 shows the correlation and total MR scan duration for the ten best contrast weighting combinations. In Table 3 the results are ordered based on the number of contrast weightings used. The highest correlation is achieved by selecting five weightings. However, while using the combination of TOF, MRDTI and ADC weightings, the correlation is almost similar to the highest correlation and the scan time is reduced by more than 60%. Figure 3 shows the difference in plaque segmentation result between using 3 and 5 weightings for one image slice of the dataset.
Evaluation of each combination of contrast weightings In this study nine contrast weightings from six different MR sequences were available. Each possible combination of contrast weightings was investigated by selecting a combination of weightings and applying the automated image segmentation method as shown in Figure 1. Besides the selection of the set of contrast weightings, no further feature selection was applied. For each combination of contrast weightings the automatically segmented soft plaque volume per patient was compared to the reference standard using Pearson’s correlation. The correlation coefficient, p-value and confidence interval (CI) were calculated for each combination of contrast weightings. In addition, the time needed to acquire the MR sequences corresponding to the set of contrast weightings, was calculated.
PLOS ONE | www.plosone.org
4
October 2013 | Volume 8 | Issue 10 | e78492
Objective Evaluation of MR Sequences
Table 2. Plaque composition of patient population (n=15).
Plaque component
Average volume ± SD (mm3)
Calcium (n=5)
26.5 (± 15.5)
Hemorrhage (n=4)
75.6 (± 48.3)
Lipid (n=14)
142.0 (± 115.8)
SD, Standard Deviation. doi: 10.1371/journal.pone.0078492.t002
Figure 2. Comparison between automated segmentation performance, contrast weighting combinations and scan duration. The ten best contrast weighting combinations ranked by the correlation between the automated image segmentation and the reference standard are shown using a bar plot. Each bar represents one set of contrast weightings (contrast weightings are tiled horizontally on the horizontal axis). The total MR scan duration of each set is superimposed using a line plot. doi: 10.1371/journal.pone.0078492.g002
Discussion
histology based manual segmentations in order to achieve a direct interpretation of the informational content of these images and the segmentation performance. While morphology was used to delineate the boundaries of the vessel wall, no morphological features were used in the automated image segmentation algorithm to ensure that the segmentation results are directly related to the image information of the contrast weightings. Also, no feature selection or post processing was used. The performance of the algorithm was in line with previous studies [8,12]. Furthermore, our approach is free of the constraints imposed by previous studies which sought to define a minimal number of sequences using manual
An objective method to optimize the MR imaging protocol for plaque classification in vessel wall images using an automated classifier was presented. Evaluation of the results from nine contrast weightings showed the tradeoff between scan duration and automated segmentation performance. The presented method has potential for application in a clinical setting, or may be of value when developing new imaging protocols for clinical research. The automated image segmentation method is based on pattern recognition and uses only the vessel wall images and
PLOS ONE | www.plosone.org
5
October 2013 | Volume 8 | Issue 10 | e78492
Objective Evaluation of MR Sequences
Table 3. Correlation between the automated image segmentation and the reference standard ranked by number of contrast weightings.
Contrast weightings
Number of weightings
Pearson Correlation [CI]
p-value
MR scan duration [min]
TOF
1
0.711 [0.312-0.897]
p = 0.003
0.8
TOF-MRDTI
2
0.860 [0.622-0.953]
p < 0.001
3.0
TOF-MRDTI-ADC
3
0.886 [0.683-0.962]
p < 0.001
7.7
TOF-MRDTI-ADC-T2W
4
0.885 [0.682-0.961]
p < 0.001
16.1
TOF-MRDTI-ADC-PDW-T1W
5
0.887 [0.688-0.962]
p < 0.001
21.4
TOF-MRDTI-ADC-PDW-T1W-T2W
6
0.877 [0.663-0.959]
p < 0.001
21.4
TOF-MRDTI-ADC-PDW-T1W-DWI- DWT2
7
0.878 [0.665-959]
p < 0.001
21.4
TOF-MRDTI-ADC-PDW-T1W-DWI-DWT2-T2W
8
0.855 [0.611-0.951]
p < 0.001
21.4
CI, Confidence Interval.min, minutes. doi: 10.1371/journal.pone.0078492.t003
Figure 3. Automated segmentation results for two sets of contrast weightings including MR images and histology. A) segmentation result for the contrast weighting set TOF-MRDTI-ADC showing the overlap between the automated segmentation method and the reference standard (green: true positive lesion, blue: false negative lesion, red: false positive lesion), B) TOF image, C) MRDTI image, D) ADC image, E) segmentation result for the set TOF-MRDTI-ADC-PDW-T1W, F) T1W image, G) PDW image, and H) the matching histological slice with elastic Van Gieson staining. The contours of the reference standard are overlaid on the different MR images (panels B,C,D,F,G). The lumen and vessel wall are depicted by the red and green contour, soft plaque is depicted by the yellow contour. The yellow colour in the histological slice in panel H is consistent with the presence of lipid. doi: 10.1371/journal.pone.0078492.g003
segmentation [6,8], specifically the number of combinations that could be evaluated, observer bias and the lack of an independent training set. Performance of the automated segmentation method increased by the number of selected contrast weightings with an optimum at five weightings. Selection of more than five weightings showed a decrease in performance. Such a behavior is typical for a pattern recognition system; adding information to the system by selecting more features increases the performance, but at a certain point the performance
PLOS ONE | www.plosone.org
stabilizes or decreases because the extra features do not contain relevant or contradicting information. The first selected contrast weighting was the TOF image. Both LR/NC and IPH can be identified from this weighting [2] explaining why this weighting was the first one to be selected by the presented method. Next, the MRDTI weighting was added to the set; the MRDTI weighting was reported to be sensitive for the detection of IPH [9]. The third selected weighting was the ADC image, which can be used to distinguish LR/NC [10] from other plaque components and fibrous tissue. Addition of the other contrast
6
October 2013 | Volume 8 | Issue 10 | e78492
Objective Evaluation of MR Sequences
wall images is significantly better than another set of images. However, the different correlations can still be compared and the scan duration should be considered in the interpretation of the results. In conclusion, a method was presented to objectively evaluate the MR sequence protocol for the detection of the soft plaque in MR vessel wall images of the carotid artery. The presented approach allows development and optimization of MR imaging protocols by investigating the tradeoff between scan duration and automated segmentation performance possibly leading to shorter scanning times and better image interpretation. This approach can potentially also be applied to other research fields focusing on different diseases and anatomical regions.
weightings provided only a small improvement which, in our opinion, was not relevant. This study is subject to a number of limitations. No distinction was made between IPH and LR/NC. However, if more image data is available, the method can be extended by either applying the method to each plaque component independently or by pooling the segmentation results for the different plaque components. In the first case, the optimal sequence set for a single plaque component can be investigated. In the second case, the set of sequences is evaluated with respect to all plaque components. The reference standard was acquired using manual segmentation by a radiologist and is therefore not completely objective. The manual segmentation process was assisted by histology reducing the effect of human variability in the reference standard. There were no matching histology sections for all image slices. In cases where no matching histology section was available, the nearest histology section was interpreted in order to perform the delineation of the vessel wall and plaque components combining the standard assumptions of the relative contrast weighting of plaque components [4]. Due to the limited size of the dataset, leave-one-out cross validation was used for the training and testing of the automated segmentation algorithm. This method provides an approximately unbiased estimate of the classification performance. A larger dataset, which can be split into a training set and an independent testing set, can provide a more reliable estimate of the classification performance. The presented soft plaque correlation measurements have wide confidence intervals. Because of these wide intervals it is not possible to indicate whether or not a particular set of vessel
Supporting Information Table S1. Contrast weightings combinations and corresponding correlations, CIs, p-values and scan durations. (XLS)
Author Contributions Conceived and designed the experiments: RVTK AJP VEY RJVDG. Performed the experiments: RVTK AJP VEY. Analyzed the data: RVTK AJP VEY. Contributed reagents/ materials/analysis tools: RVTK AJP VEY RJVDG. Wrote the manuscript: RVTK AJP VEY JHG JHCR RJVDG.
References 1. Pasterkamp C, Falk E (2000) Atherosclerotic plaque rupture: an overview. J Clin Basic Cardiol 3: 81–86. 2. Yuan C, Mitsumori LM, Ferguson MS, Polissar NL, Echelard D et al. (2001) In vivo accuracy of multispectral magnetic resonance imaging for identifying lipid-rich necrotic cores and intraplaque hemorrhage in advanced human carotid plaques. Circulation 104: 2051–2056. doi: 10.1161/hc4201.097839. PubMed: 11673345. 3. Takaya N, Yuan C, Chu B, Saam T, Underhill H et al. (2006) Association between carotid plaque characteristics and subsequent ischemic cerebrovascular events: a prospective assessment with MRI-initial results. Stroke 37: 818–823. doi:10.1161/01.STR. 0000204638.91099.91. PubMed: 16469957. 4. Yuan C, Oikawa M, Miller Z, Hatsukami T (2008) MRI of carotid atherosclerosis. J Nucl Cardiol 15: 266–275. doi:10.1016/j.nuclcard. 2008.02.001. PubMed: 18371599. 5. Balu N, Yarnykh VL, Chu B, Wang J, Hatsukami T et al. (2011) Carotid plaque assessment using fast 3D isotropic resolution black-blood MRI. Magn Reson Med 65: 627–637. doi:10.1002/mrm.22642. PubMed: 20941742. 6. Zhao X, Underhill HR, Yuan C, Oikawa M, Dong L et al. (2010) Minimization of MR contrast weightings for the comprehensive evaluation of carotid atherosclerotic disease. Invest Radiol 45: 36–41. doi:10.1097/RLI.0b013e3181beada7. PubMed: 19996759. 7. Cappendijk VC, Cleutjens KBJM, Kessels AGH, Heeneman S, Schurink GWH et al. (2005) Assessment of human atherosclerotic carotid plaque components with multisequence MR imaging: initial experience. Radiology 234: 487–492. doi:10.1148/radiol.2342032101. PubMed: 15671004. 8. Liu F, Xu D, Ferguson MS, Chu B, Saam T et al. (2006) Automated in vivo segmentation of carotid plaque MRI with Morphology-Enhanced
PLOS ONE | www.plosone.org
9.
10.
11.
12.
13.
14.
7
probability maps. Magn Reson Med 55: 659–668. doi:10.1002/mrm. 20814. PubMed: 16470594. Moody AR, Murphy RE, Morgan PS, Martel AL, Delay GS et al. (2003) Characterization of complicated carotid plaque with magnetic resonance direct thrombus imaging in patients with cerebral ischemia. Circulation 107: 3047–3052. doi:10.1161/01.CIR. 0000074222.61572.44. PubMed: 12796133. Young VE, Patterson AJ, Sadat U, Bowden DJ, Graves MJ et al. (2010) Diffusion-weighted magnetic resonance imaging for the detection of lipid-rich necrotic core in carotid atheroma in vivo. Neuroradiology 52: 929–936. doi:10.1007/s00234-010-0680-y. PubMed: 20358366. Karmonik C, Basto P, Vickers K, Martin K, Reardon MJ et al. (2009) Quantitative segmentation of principal carotid atherosclerotic lesion components by feature space analysis based on multicontrast MRI at 1.5 T. IEEE Trans Biomed Eng 56: 352–360. doi:10.1109/TBME. 2008.2003100. PubMed: 19272944. Hofman JMA, Branderhorst WJ, ten Eikelder HMM, Cappendijk VC, Heeneman S et al. (2006) Quantification of atherosclerotic plaque components using in vivo MRI and supervised classifiers. Magn Reson Med 55: 790–799. doi:10.1002/mrm.20828. PubMed: 16526020. Adame IM, van der Geest RJ, Wasserman BA, Mohamed MA, Reiber JHC et al. (2004) Automatic segmentation and plaque characterization in atherosclerotic carotid artery MR images. MAGMA 16: 227–234. doi: 10.1007/s10334-003-0030-8. PubMed: 15029508. Duin RP, Juszczak P, Paclik P, Pekalska E, de Ridder D et al. (2007) PRTools4.1, A Matlab Toolbox for Pattern Recognition. Delft University of Technology.
October 2013 | Volume 8 | Issue 10 | e78492