plant under the company which the slab allocation is not optimal. One can see ... (2012) developed an integrated optimization model for production planning to ...
Proceedings of the 2014 International Conference on Industrial Engineering and Operations Management Bali, Indonesia, January 7 – 9, 2014
An Optimization Model for Production Allocation in A Large Steel Manufacturing Company Cucuk Nur Rosyidi, Anandhyta Yunan Perdana and Yusuf Priyandari Industrial Engineering Department Sebelas Maret University Jalan Ir. Sutami 36 A Surakarta, 57126, Indonesia Abstract In a keen competition of steel market, steel manufacturing companies have to use their resources efficiently to maintain their profit level and competitiveness in the market. A large steel manufacturing in Indonesia has a problem in allocating slab product to produce several final products. The Hot Strip Mill (HSM) is one of the plant under the company which the slab allocation is not optimal. One can see the problem from the fact that some of the divisions in HSM often experience deficit materials while the others experience excessive materials. This problem arises because the current practice of such allocation was not based on a mathematical model to find the optimal alocation. The aim of this research is to develop an optimization model which can be used to optimally allocate slab product in HSM to several subdivisions in producing several final products. The objective function of the model is to maximize the achievement of production target by considering production capacities and defect rates. The optimal results of the model solved the problem and helped the company to optimally allocate the slab product.
1.
Introduction
Keen competition in steel market has forced steel manufacturing companies to use their resources in most efficient ways in order to maintain their profit level and competitiveness. They also have to keep their service level to satisfy their customers. Product mix and availibility are the main concern of many companies to satisfy the customers. Both decisions will depend on customer demand considering the capacity and capability of the company in producing the needed products. Hence, a steel manufacturing company has to manage the raw materials and intermediate products carefully to satisfy the customer demand. Commonly, a steel manufacturing company has several products line which each product line constitutes the product range of the company. The decisions about what products must be produced and in what quantity will dictate the production planning, mainly the allocations of the raw materials and intermediate products to produce the final products. There are several typical products of steel manufacturing company, such as hot rolled coils and plates, cold rolled coils and plates, and wire rods. Hot rolled coils and plates are widely used for ship buildings, pipes, general structures, and other applications. Cold rolled coils and plates are resulted from cold rolled process and generally used to manufacture car bodies, cans, cooking wares, and other applications. The wire rods are commonly used for piano wires, bolts and nuts, steel cords, springs, and other applications. PT. Krakatau Steel is the largest steel manufacturing company in Indonesia. It has six production plants: Direct Reduction Plant, Slab Steel Plant, Billet Steel Plant, Hot Strip Mill, Cold Rolling Mill, and Wire Rod Mill. The company has a problem with the allocation of its intermediate products which must be fed to the next processes. The problem is arises in the Hot Strip Mill (HSM) plant. The HSM began operating in 1983 and currently works at full production capacity of 2.4 million tons per year. HSM produces steels in the form of coils, plates, and sheets with the range of thickness between 1.8-25 mm. The HSM products are resulted from intermediate products produced by Slab Steel Plant (SSP). The slab steels are then reheated and rolled in the HSM becoming hot rolled coils and plates in five subdivisions under HSM: Cold Roll Mill (CRM), Shearing Line 1 (SL 1), Shearing Line 2 (SL 2), Skin Pass Mill (SPM), dan Coil Direct Reshipment (CDR). Each subdivision produces final products to satisfy customer demands. Hence, the allocation of coils from HSM is needed to be in the right quantity and at the right time. The current practice of such allocation is not optimal. It can be seen from the fact that sometimes the coil from HSM is not available when it is needed by its subdivisions. Hence the company will experience potential loss of profit. There are several researches in steel production management. Chen and Wang (1997) and Lim and Kim (1999) both developed single period linear programming model in an integrated production and distribution planning considering raw material purchasing. Li and Shang (2001) proposed an integrated model for production planning in a large iron and steel manufacturing environment. They used input-output model to solve the
2102
production planning problems in determining the amount of products that must be produced and its corresponding resources. Srinivasan et al. (2010) developed a multi-agent system in supply chain management of steel pipe manufacturing. In their proposed model, each agent performs a specific function of the organization and share the information with other agents. Hence the information sharing was achieved by the model. The agents represent three activities or functions: purchasing activity, processs planning, and scheduling activities. Nishioka et al. (2012) developed an integrated optimization model for production planning to simultaneously minimize manufacturing lead time and improve the efficiency. They derived three models in their research: efficiency model, manufacturing lead time model, and required time/in-process stock model.The efficiency model was based on the assumption that the Theory of Constraint (TOC) is applicable also to the solution of problems in complex and continued processes like rolling processes. Hence the efficiency model enables quantitative evaluation of the lowering efficiency attributable to the friction between individual rolling process. The manufacturing lead time was developed stochastically to determine the standard deviation of the lead time. The formula of the required time/in-process stock was developed using queueing theory. Tang et al. (2000) developed a mathematical programming for scheduling in steelmaking-continuous casting to determine the sequence, time, and the facilities used to produce the casting products. The aim of that research is to develop a computerized scheduling system for generating optimal schedules. The scheduling process consists of four steps: cast sequencing, individual charge sets sscheduling, rough scheduling to merge sub-schedules, and finally find the optimal schedules. Daash et al. (2007) also addressed the charge sequencing problem as one of concerned to find the optimal production design for plate products in the steel industry. Production design concerned with the detailed description of the production steps and related intermediate products, which yield a desireed set of final plate products. Sutherland et al. (2007) developed an optimization model to improve the environmental performance of steel manufacturing operations. The company must select materials and other process inputs to minimize energy, resource consumption, and process wastes. The model was based on electric arc furnace steelmaking. An electric arc furnace model was needed in the optimization model to predict resource and energy requirements ad associated wastes and emissions for different raw material inputs. We found one research concerned with capacity allocation. Li et al. (2009) developed a strategic capacity allocation model in a complex supply chain consists of several suppliers, factories and distributions centers. The model is used to solve the allocation problem in a complex networks without taking into consideration the allocation problem inside the company. In this research, we developed an optimization model for optimal allocation of intermediate product in PT. Krakatau Steel. The problem we attempt to solve is owned by HSM which must allocate its intermediate products to its five subdivisions. The objective function of the model is to maximize the achievement of production target in each subdivisions. The constraints of the model include production capacity, defect rates, and the allocation systems in the subdivisions. The rest of this paper is organized as follows. In the next section, we briefly explain the allocation system in HSM. The model development is explained in Section 3. In Section 4, we provide the results and discussions and the conclusions and direction for future research is drawn in Section 5.
2.
System Description
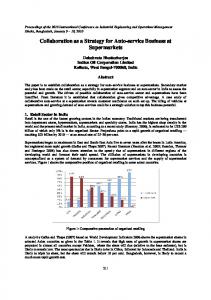
In PT. Krakatau Steel, the production process is started with the direct reduction process where iron ore pellets converted into irons using natural gas and water. The irons are then fed into electric arc furnaces in Slab Steel Plant (SSP) and Billet Steel Plant. In both plants, the irons are mixed with scrap, hot bricket iron, and other additional materials to produce slab and billet steels. The slab steels are then reheated and rolled in HSM to become hot rolled coils and plates. The coils are then allocated to the five divisions under HSM: Cold Rolling Mill (CRM), Shearing Line 1 (SL 1), Shearing Line 2 (SL 2), Skin Pass Mill (SPM), dan Coil Direct Reshipment (CDR). Figure 1 explains the allocation system in HSM. From the figure, it can be seen that some of the products of SPM are re-allocated to SL1, SL2, SPM, and CDR.
2103
Figure 1: The allocation system in HSM The amount of intermediate products which processed by CDR must consider maximum allocation quantity. The allocation should not exceed the upper limit of 30% from the total output of HSM. The allocation from HSM to SL1 and HSM to SPM which will be re-allocated to SL1 and SL2 has minimum amount of 160,000 tons/year. The allocation from HSM to SL2 should be at least 10,000 tons/year and considers the amount of coil re-allocated to SL2 from SPM. The amount of allocation from HSM to SPM must be at least 70% from the total capacity of HSM and considers the amount of coils which will be re-allocated to SPM from SL2.
3.
Model Development
3.1 The Objective Function The objective function of the model in this resaerch is to maximize the achievement of production target at each subdivision under HSM. The objective function of the model is expressed in Equation (1). In that equation, xijk denotes the amount of products allocation from unit i to unit j at period k. HSM, CDR, SL1, SL2, SPM, and CRM are given a number 1, 2, 3, 4, 5, and 6 respectively. For example, x121 denotes the amount of products allocation from HSM to CDR at the first period. Nik denotes the production target of subdivision i at period k.
∑
∑
∑
(1)
3.2 Set of Constraints The following constraints are considered in this research: 1. The allocated products from HSM to SPM and from SPM to SL1 must be greater than the coils from HSM to SPM and from SPM to SL2. The constraint is expressed in Equation (2). ,∀ (2) 2.
The amount of products HSM-SL1, HSM-SPM-SL1, and HSM-SPM-SL2 must be at least 10.67 % fom the total production of HSM. This constraint is expressed in Equation (3) in whch Ck denotes the total productions of HSM at period k.
0.1067 4.
The maximum allocation of products HSM-CDR is 30% from the total production of products in HSM. Equation (4) expresses this constraint.
0.3
(4)
2104
(3)
5.
The percentage of products allocation from HSM-SPM must be at least 70% from the total capcity of HSM as indicated in Equation (5).
6.
(5)
The sum of total products which processed by five subdivisions is equal to the total prducts of HSM. This constraint constitutes the products balance in the model as indicated in Equation (6).
∑ 7.
0.7
,∀
(6)
The processes in each subdivisions contain defect products which must be accounted in the model. The output products entering one subdivisions must have lower amount than the products processed in preceeding subdivisions. This constraint is expressed in Equation (7) in which Dik denotes the defect rates of products in subdivision i at period k. (7)
3.
Results and Discussions
Table 1 and 2 show the parameters of the model. The values of such parameters are resulted from the data collected from the company. Table 1 shows the production targets of HSM and its subdivisions in tons per year. The targets are derived from the customers demand. Table 2 contains the average defect rates at all subdivisions every months in a year. The average range is from 2% until 10% which occur in the month of April and November respectively.
No 1 2 3 4 5 6
Table 1: Production targets in each subdivisions Subdivisions Production Targets (tons/year) HSM 1,400,000 CDR 400,000 SL1 150,000 SL2 150,000 SPM 300,000 CRM 400,000 Table 2: Average defect rate in each period Periods Average Defect rate (%) January 3 February 3 March 3 April 2 May 3 June 3 July 3 August 3 September 3 October 4 November 10 December 6
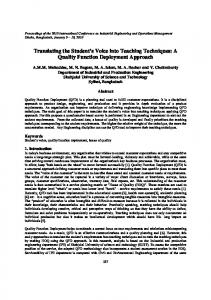
The results of the optimization can be seen in Table 3. The table shows the optimal allocation from HSM to its subdivisions. The optimal allocations resulted in a total of 93% achievement from the production target set by management. The details of target achievement and percentage of such achievement in each subdivision can be seen in Table 4. We also compare the results of optimizations with the monthly targets and the planned of allocation made by the management. For an example, we give comparisons of allocation HSM-SL1 as shown in Table 5. Figure 2 depicted the histogram for the comparisons of Table 5. The average of planned allocation, optimized allocation, and allocation target are 12,599, 12,609, and 12,747 tons respectively. It means that the average of optimization results is 9.8 tons lower than the planned allocation.
2105
No. 1 2 3 4 5 6 7 8 9
No 1 2 3 4 5
Periods January February March April May June July August September October November December
Table 3: Optimal product allocations From-To Optimal Allocation (Tons) HSM-CDR 390,370 HSM-SL1 119,552 HSM-SL2 125,766 HSM-SPM 215,097 HSM-CRM 377,341 HSM-SPM-SL1 26,214 HSM-SPM-SL2 14,234 HSM-SPM-CRM 22,659 HSM-SL2-SPM 10,000
Table 4: The achievement of target in each subdivisions Subdivisions Achievement (Tons) Target (Tons) CDR 390,370 400,000 SL1 145,766 150,000 SL2 150,000 150,000 SPM 288,204 300,000 CRM 400,000 400,000
Table 5: Comparison of optimization results, planned allocation, and target From To Optimization Result Planned allocation HSM-SL1 13,528 16,497 13,394 16,331 HSM-SPM-SL1 2,969 2,937 HSM-SL1 8,117 9,898 8,726 10,639 HSM-SPM-SL1 1,782 1,913 HSM-SL1 8,803 10,735 8,427 10,275 HSM-SPM-SL1 1,932 1,848 HSM-SL1 11,261 13,733 11,399 13,898 HSM-SPM-SL1 2,472 2,499 HSM-SL1 13,539 16,511 12,793 15,598 HSM-SPM-SL1 2,972 2,805 HSM-SL1 11,760 14,341 11,835 14,430 HSM-SPM-SL1 2,581 2,595 HSM-SL1 11,332 13,820 10,192 12,427 HSM-SPM-SL1 2,488 2,235 HSM-SL1 9,045 11,031 8,289 10,107 HSM-SPM-SL1 1,986 1,818 HSM-SL1 8,189 9,986 8,045 9,809 HSM-SPM-SL1 1,798 1,764 HSM-SL1 8,272 10,087 9,481 11,560 HSM-SPM-SL1 1,816 2,079 HSM-SL1 6,161 7,513 7,029 8,570 HSM-SPM-SL1 1,352 1,541 HSM-SL1 13,975 17,042 14,491 17,668 HSM-SPM-SL1 3,068 3,177
2106
Percentage 97.6 97.2 100 96.1 100
Target 15,497 10,998 10,998 13,747 16,497 14,297 13,747 10,998 10,998 10,998 7,699 16,497
Amount of Allocation
Comparison for HSM‐SL1 20000 18000 16000 14000 12000 10000 8000 6000 4000 2000 0
Optimization Results Planned Allocaation Target
1 2 3 4 5 6 7 8 9 10 11 12 Periods Figure 2: Histogram for HSM-SL1 Comparisons
5. Conclusions In this research, we develop a model to optimally allocate the intermediate products in a large steel manufacturing company. The model is applied to solve the problem in HSM plant of PT. Krakatau Steel, the largest steel manufacturing company in Indonesia. The HSM produces intermediate products which must be processed to produce the final product in its five subdivisions. The objective function of the model is to maximize the achievement of production target set by the management. Several constraints are considered in this research include the limits of allocation and defect rate in each subdivision. The results of the optimization shows that there is a difference of 9.8 tons between the average of optimization results and planned allocation for HSM-SL1 allocation. The optimal allocation resulted in the total of 93% achievement from the production target set by the company. The consideration of the stochastic characteristics in demand and other parameters can be accomodated for the future works.
References Chen, M. and Wang, W., A linear programming model for integrated steel production and distribution planning. Inter- national Journal of Production Management 17, 592–610, 1997. Dash, S., Kalagnanam, J., Reddy, C., and Song, S. H., Production Design for Plate Products in The Steel Industry, IBM Journal of Research and Development, Vol. 51 Issue 3.4, pp. 345-362, 2007. Li, H. and Shang, J., Integrated Model for Production Planning in A Large iron and steel manufacturing environment, International Journal of Production Research, 39:9, pp. 2037-2062, 2001. Li, H., Hendry, L., and Teunter, R., A Capacity Allocation Model for A Complex Supply Chain: Formulation and Solution Approach Comparison, International Journal of Production Economics, 121, pp. 505-518, 2009. Lim, S.K. and Kim, Y.D., An integrated Approach to Dynamic Plant Location and Capacity Allocation. Journal of Operational Research 50, 1205–1216, 1999. Nishioka, K., Mizutani, Y., Ueno, H., Kawasaki, H., and Baba, Y., Toward the integrated optimization of steel plate production process-A Proposal for Production Control by Multi-Scale Hierarchical Modeling, Synthesiology, Vol. 5, No. 2, pp. 98-112, 2012. Srinivasan, S., Kumar, D., and Jaglan, V., Multi-Agent System Supply Chain Management in Steel Pipe Manufacturing, International Journal of Computer Science Issue, Vol. 7 Issue 4, No. 4, 2010. Sutherland, J. W. and Haapala, K. R., Optimization of Steel Production to Improve Lifecycle Environmental Performance, CIRP Annals, Vol. 56, No. 1, pp. 5-8, 2007. Tang, L., Liu, J., Rong, A., and Yang, Z., A Mathematical Programming Model for Scheduling SteelmakingContinuous Casting Production, European Journal of Operational Research ,120, pp. 423-435, 2000.
Biography Cucuk Nur Rosyidi is a lecturer in Industrial Engineering Department at Sebelas Maret University Surakarta, Indonesia. He received Sarjana Teknik degree in Industrial Engineering from Sepuluh Nopember Institute of Teknology in 1996. His Master and Doctoral degrees in Industrial Engineering are earned from Bandung
2107
Institute of Technology in 2005 and 2010 respectively. His research interests include product design and development, quality engineering, manufacturing, and optimization modeling. Anandhyta Yunan Perdana is an alumni of Industrial Engineering Department Sebelas Maret University Surakarta, Indonesia. He received his Sarjana Teknik degree in Industrial Engineering in 2013. He currently works at a multinational milk company in Jakarta, Indonesia. His research interests include production planning and control and inventory management. Yusuf Priyandari is a lecturer in Industrial Engineering Department Sebelas Maret University Surakarta, Indonesia. He received his Sarjana Teknik degree in Industrial Engineering from Sebelas Maret University in 2002. He earned a Master in Industrial Engineering from Bandung Institute of Technology. He is currently head of Information and Communication Technology division in Engineering Faculty of Sebelas Maret University. He is also head of Optimization and Information System Planning Laboratory in Industrial Engineering Department at the ssame university. His research interests include decision support system, information and communication technology, and optimization modeling.
2108