POLICY
RESEARCH
WORKING
Income Inequality
and AggregateSaving
PAPER
156.1
No evidenceis found to support the notion that
incomeinequaltyaffects aggregate saving across
The Cross-CountryEvidence
countries- neitherin
developing nor inindustriat countries.
Klaus Schmidt-Hebbel Luis Serven
The World Bank Policy Research Department Macroeconomics and Growth Division January 1996
POLICY RESEARCH WORKING
PAPER
1561
Summary findings Schmidt-Hebbel and Serven empirically review and analyze the link between income distribution and aggregate savings. Recent research has focused on the impact of income inequality and growth. Less attention has been paid to the link between inequality and saving. Once the conventional representative-agent framework is abandoned, consumption theory brings out channels through which income inequality can affect aggregate saving.
Schmidt-Hebbel and Serven present new econometric evidence on the link between saving and inequality using new data on income distribution for a large crosscountry sample. The results provide no evidence that income inequality affects aggregate saving across countries. This conclusion holds for both industrial and developing countries and is robust to changes in measures of saving, in income distribution indicators, and in functional forms.
This paper-a product of the Macroeconomics and Growth Division,Policy Research Department-was prepared as part of ongoing research on the determinants of saving. Copies of the paper are available free from the World Bank, 1818 H Street NW, Washington, DC 20433. Please contact Emily Khine, room NI 1-061, telephone 202-473-7471, fax 202-5223518, Internet address
[email protected]. January 1996. (35 pages)
The PolicyPesearchWorkPng PaperSeriesdisseminatesthe findingsof workin progressto encourage the
exchangeof ideasabout
development issues. An objective of the series Is to get the findingsout quickly, even if the presentationsare less than fully polished. The papers carry the namnesof the authors and should be used and cited accordingly. The findings, interpretations, and conclusionsare the authors' own and should not be attributed to the World Bank,its Executive Board of Directors, or any of its member countries.
Produced by the Policy Research Dissemination Center
INCOME INEQUALITY AND AGGREGATE SAVING: THE CROSS-COUNTRY EVIDENCE
Klaus Schmidt-Hebbel Luis Serven
Policy Research Department The World Bank
Weare gratefulto KlausDeinmgerand Lyn Squireforkindlymakingavailableto us theirdatabaseon income WethankSteveMarglin,BrankoMilanovic,and Vito Tanzifor usefulcommentsand suggestions distribution. version. Excellentresearchassistanceby WanhongHu is gratefullyacknowledged. earlier on an
1.
Introduction If all individualswere identicalin regardto their saving behavior,then aggregatesavingwould be
triviallyrelatedto individualsaving -- it wouldjust equalthe savingof a representativeagentmultipliedby the population.Naturally,such a simplisticview of aggregatesavingwould be highlymisleading.It is hard to understandaggregateconsunptionand savingpatternswithoutconsideringthat theyreflectdissimilarbehavior by heterogeneousindividualswho differin preferences,resources,and/or institutionalconstraints.Indeed, consumptionand saving are amongthe few areasin macroeconomics where theoreticaldevelopmentshave occasionallyleft the safe -- but severelyrestrictive -- haven of representative-agent models' to venture into the wilderness of agentheterogeneity,collectingalongtheway valuableanalyticalandempiricalinsights-- suchas thosederived,for example,fromthe life-cycleconsumptionmodel. Oneparticulardimension of heterogeneity thathasreceivedincreasedattentionfromthemacroeconomic viewpointin recentyearsis thatof incomedistribution.Recentanalyticaland empiricalworkhas focusedon the 2 Less attentionhas beenpaid, however,to the relationshipbetweenincomeinequality,growthand investment.
linksbetweenincomedistributionand saving. Theselinks are the focusof this paper.Morespecifically,its objectiveis to ascertainthe impacton aggregatesavingof changesin thedistnbution of incomeamonggroupsof savers,aftertakingintoconsideration theeffectsof otherstandardvariablessuchas aggregateincomeand its growthrate. Thepaperconcentrateson thechannelsthroughwhichdistributionaffectssaving.Yet feedbackeffectsfromsavingto distributioncannot be ruledout a priori, and indeedtheyarecentralto someof the savinghypotheses(notablythoseemphasizing thefunctional distributionof income)thatwillbe reviewedbelow.Ofcourse,thepossibilityof two-waycausation is not exclusiveto incomedistribution;it appliesas wellto other standarddeterminantsof saving(income, interestrates,etc.)for whichthereis a strongpresumptionthat causalitymayrun in both directions.Whileour discussiontouchesupontheseissues,wedo not explorethemat lengthin this paper. Themainconclusionof thepaper - supportedby empiricalevidencebasedon newincomedistribution dataconstructed by DeiningerandSquire(1995)-- isthatcross-countrydata do not revealany strongassociation betweenincomedistributionandsavingratios.Aftercontrollingfor othersavingdeterminants,aggregatesaving ratiosdonot appearto be significantlyrelatedto standardincomedistributionindicators.Thisconclusionholds fora largecross-countrysample,as wellas for its industrialand developing-country subsamples,and is robust to alternativesavingmeasures,incomedistributionindicators,and functionalforms.
I SeeKirman(1992)fora recentsharpcriticism oftherepresentative-agent paradigm. 2 Seeforexample GalorandZeira(1993), Alesinaand Rodrik(1994),PerssonandTabellini (1994),Perotti (1995),andAlesinaandPerotti(1996).
2 Thepaperis organizedas follows.Section2 presentsthe stylizedfactson saving,income,growthand distributionusing data for a large numberof industrialand developingcountries,and relates the empirical regularitiespresentin our sampleto those reportedin the literature.Section3 providesa brief surveyof alternativeviews of saving determination,with emphasison the saving consequencesof differentincome profiles.Section4 reviewspreviousempiricalstudiesof the impactof incomedistributionon saving, distribution and Section5 presentsnewcross-coutryeconometricevidenceusingour data set. Finally,Section6 concludes. II.
Savingand Distribution: the StylizedFacts Webeginbyreviewingtheempiricalregularitieson saving,incomeand distribution.To do this, weuse
annual macroeconomicdata on 52 industrialand developingcountriesfrom the WorldBank databases,and datafroma newdatabaserecentlyconstructedby Deiningerand Squire(1995).In principle incomedistribution thedatacovertheyears 1965to 1994-- althoughfor somecountriessomeof thevariablesof interest(notably incomedistribution data)arenot availableeveryyearwithinthis time span. Thediscussionfocusesonthe crossof thedata,makinguse of the averagesof the relevantvariablesover thethree-decadeperiod countrydimension above.'Unlessotherwisenoted,hereandin therest ofthepaperwe use the term 'saving' ('savingratio') to refer to grossnationalsaving(respectively, its ratioto GNP).Wechoosenationalsavingand nationalproductdata as therelevantvariablesbecausetheyarecloserto the relevantunits (householdsor individuals)forwhichincome distribution datais availablethanthe domesticsavinganddomesticproductmeasures.In this respectwe differ frommostempiricalstudies,that are basedon the less adequatedomesticmeasures. Apreliminaryissuethatmeritscommentis thatof measurementerror.As is wellknown,this is a central problemin empiricalstudiesof saving,due not onlyto the inadequacyof the very savingconceptusedby the NationalAccounts(which,for example,excludecapitalgains fromthe definitionof income,and treat human capitalexpenditures asconsumption)but also to the unreliabilityof measuredsaving,whichstems largelyfrom the factthat savingis oftencomputedas the residualfromanotherresidual(consumption).Theupshotis that saving measuresmay containlarge errors,particularlyin poorer countries(see Schmidt-Hebbel,Serv6nand Solimano1996forfurtherdiscussion). Measurementerroris evena moreseriousproblemin the caseof income
3The samplecountries wereselectedonthebasisofavailability ofincomedistribution data(kindlymade available to usbyKlausDeiningerandLynSquire)andthefollowing criteria.The1965-94averageforeachcountryis is available. Toensurethelong-term natureoftheaverages,the computed overthoseyearsforwhichtheinformation observation in eachoftwoofthethree sampleincludesonlythosecountrieswithat leastoneincomedistribution outofthe20 decadesthatspanthe1965-94period.Thisleavesuswith20industrial and32 developing countries, developing countriesin thedatabaseofDeiningerandSquire.Moredetailsaregivenin industrial and66 non-transition thedataappendixinthispaper.
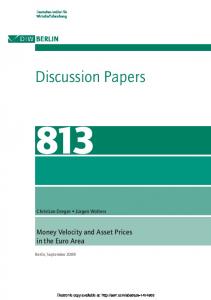
3 statistics.Thelatterareprimarilyderivedfromhouseholdsurveydata,whichtypicallyunderstatethe distribution As a result,incomeinequalityis likelyto be underestimated.Althoughno firm incomeofthericherhouseholds. evidenceis available,most observerswouldprobablyagreethat suchunderestimationagainis probablymore severein poorercoutries, becausethe statisticalapparatusinvolvedin the collectionof householddata is likely to be weaker. of theavailabledata,weturn to the reviewof the stylizedfacts. Since Keepingin mindtheselimitations our incomedistributioninformationis new,we first providesomesummarystatistics(a detaileddescriptionis givenin Deiningerand Squire 1995).Table 1 presentsmeansand standarddeviationsof threeconventional indicatorsof inequality:the Gini coefficient,theratiobetweenthe incomesharesof therichest20 percentand poorest40percentof thepopulation,andtheincomeshareof the 'middleclass', definedas the middle60 percent (whichis oftenused as an indicatorof equality).Thestatisticsarecomputedfor threecountry of thepopulation cntries, and,as a subsetof thelatter,the so-called'take-off' countries. developing groups:industrialcountries, Thelattergroupis definedas consistingof thosedevelopingcountriesthat duringthe sampleperiodsuccessfully shiftedfroma lowto a high savingand growthpath.4 As Table1 shows,developingcountriesare moreunequalthanindustrialcountriesby any of the three indicatorspresented.Take-offcountries,however,possessonaveragean incomedistributionmoreequitablethan the rest of developingcountries,also by allthree indicatorsconsidered. Thestylizedfads The first stylizedfact concernstherelationshipbetweensavingratiosand levelof development-- as measuredby real per capitaGNP. Figure I presentsthe scatterplot of the 1965-1994averagesof thesetwo variablesforthesamplecountries;usingper capitaincomeat the initialyearof the sampleinsteadof its average value yields a very similarpicture.In the figure,countriesappearclusteredin roughcorrespondenceto their level.Onaverage,savingratesarelowerfor developingcountriesthanfor industrialcountries.The development exceptionare the take-offeconomiesin our sample,whosesavingratios exceedeventhe industrial-country average. Thefigureshowsthatsavingratestendto risewithper capitaincome:thecorrelationcoefficientbetween thetwo variablesis .31, significantlydifferentfromzeroat the 5 percentlevel,andis evenhigher(.60)among developingcountries.(Seethematrixof correlationsbetweenthe savingrate and relatedvariablesin Table2). Korea, Indonesia, countries(Hong-Kong, East-Asian China,sevenmarket-economy 4 Thegroupincludes ThailandandTaiwan(China)),Chile,and Mauritius. Singapore, Malaysia,
4 A similarassociationhas beenfoundin a numberof empiricalstudiesof saving (e.g.,Collins1991;SchmidtHebbel,Webband Corsetti1992;Carrolland Weil 1994; Masson,Bayoumiand Samiel1995;Edwards1995). Thefigurealsosuggeststhat at high levelsof per capitaincomesavingratiosappearto leveloff -- i.e., is not linear,andpossiblynot evenmonotonic.As a moreformalcheckon this, the solid linein therelationship FigureI plotsthe fitted valuesfromregressingthe savingrate on a quadraticpolynomialin per capita income; the estimatedcoefficientsare significantat conventionallevels. The fitted curve shows that the positive association betweensavingand developmentappearsindeedto be confinedto theearlystagesof development, ceasesto hold at about$8,000per capitaGNP( in 1987US$), andturns intoa negativeassociationat higher incomelevels. A secondstylizedfactis thestrongpositiveassociationbetweensavingratiosand realper capitagrowth, 5 However,its structuralinterpretation which has been amplydocumentedin cross-countryempiricalstudies.
remains controversial,as it has beenviewedboth as proof that growthdrives saving(e.g., Modigliani1970, amongmanyotherstudies)and that savingdrivesgrowththroughthesaving-investment link(e.g., Levineand Renelt1992;Mankiw,Romerand Weil 1992).6 As Figure2 shows,ourdataconformto thesefindings.Aggregatesavingratiosandreal per capitaGNP growtharepositivelyassociated,and theircorrelationcoefficientequals.63, significantlydifferentfromzero at the5 percentlevel.However,thefigurealso suggeststhat this relationshipmightbe drivenby the fast-growing, high-saving take-offeconomies, mostof whichareclusteredat theupper-rightcornerof the graph.In fact, if these countriesareremovedfromthe sample,the correlationdropsto .40,but stillremainssignificant. Istheassociation betweensavingandincomedistributionasclear-cutas that betweensavingand income (orits growthrate)? Figure3, whichplotssavingratiosagainstGinicoefficientsof incomedistribution,shows a less clear-cutpattemthanthe precedingtwo figures.Nevertheless,the full-samplecorrelationbetweenboth variablesis -.28, just statisticallysignificantat the 5 percentlevel.Thecorrelationpattern is, however,rather differentin theindustrial(.10)and developing-country (-.26)subsamples;in neitheris it significantlydifferent thefigurealsorevealsa sharp distinctionbetweenboth sets of countriesfrom the point fromzer. Interestingly, ofviewof inequality: virtuallyallnon-take-offdevelopingcountriespossessa moreunequalincomedistribution (as measuredby the Ginicoefficient)thanthat of the most unequalOECDcountry. The above facts lead to the much-discussedrelationshipbetweenincome inequalityand level of
(1993)andCarrollandWeil(1994). (1970),Maddison(1992),Bosworth Modigliani 5 Seeforexample byCarrollandWeil(1994),Deaton(1995),and seetherecentoverviews causality 6 Onthe saving-growth Scbmidt-Hebbel, ServenandSolirnano (1996).
5 development - withthelattermeasuredas beforeby realper capitaGNP.Accordingto the well-knownfinding by Kuznets(1955),therelationshipbetweenthesevariablesfollowsan inverted-Ushape:inequalityrises in the earlystagesof development, andthendecreasesas percapitaincomecontinuesto rise.This stylizedfact has been replicatedto varyingextentsin a numberof cross-countrystudies(for recentexamplessee Bourguignonand Morrison1990,andClarke1991),but its interpretationis far fromclear (see .AdelmanandRobinson1989,for a discussion).' Figure4 showsthat our samplefits the Kuznetscurve.Keepingwith convention,the figureplots Gini coefficients againstthelogof per capitaincome(withbothvariablesmeasuredby their 1965-92averages).The curvedline in the graphdepictsthe fittedvaluesfromregressingthe Gini coefficienton the log of per capita incomeandits square;theestimatedcoefficients arehighlysignificant. As canbe seenfromthe figure,developing countriesaccountfor the upward-sloping portionof the empiricalcurve,and industrialcountriesclusteralong thedecliningportion. Onemethodological issuethatarisesis whetherthe abovefindingsare sensitiveto our choiceof the Gini coefficient as the relevantstatistic.A numberof altemativeindicatorsare foundin the literature-- e.g., Theil's index,thecoefficient of variationof incomeacrosshouseholds,the incomeshareof the poorest20 or 40 percent ofthepopulation,the ratioof the latterto the incomeshareof the richest20 percent,or theincomeshareof the middleclass.8 Amongall them,the Gini coefficient,Theil's indexor the coefficientof variationare generally preferablebecausetheyuse moreinformationthanthe commonly-encountered quintile-basedindicators.At the same time, the Gini index has the well-knowndrawbackthat it is not uniquelyrelatedto the shape of the underlyingdistribution,so that verydifferentredistributionschemescan be reflectedin thesamechangein the Ginicoefficient.Finally,incomeshares(in levels)and Ginicoefficientsmayposecross-countrycomparability problems,likelyto be minimizedby theuse of shareratios(Deiningerand Squire,1995). Inpractice,however,the informationalcontentof all theseindicatorsis usuallyverysimilar,as shown by the factthat theytypicallyareveryhighlycorrelated-- eventhoughtheymayyielddifferentorderingsfor a fewsampleobservations(seeforexampleClarke1991).Thisappliesalso in our case.Bywayof example,Figure 5 plotstheGinicoefficient againsttheratiooftheincomeshare of the richest20 percentof the populationto that of thepoorest40 percent,for thosecountriesin our samplefor whichboth kindsof data areavailable.Theplot revealsa strongpositiveassociationbetweenboth distributionmeasures;indeed,theircorrelationcoefficient
7
As iswellknown,Kuznets'explanation ofhisempiricalfindingwasbasedontheshiftofpopulation from traditional tomodernactivities. SeeAnandandKanbur(1993)for ananalytical reassessment ofthisview. Fora discussion ofthepropertiesoftheseindicesseeforexampleCowell(1971).
6 equals.95,so that theyarevirtuallyindistinguishable. To sunmarizethis section,ourdataconformto threestylizedfactsfoundin cross-countrystudies.First, saving rates appearto rise with development(as measuredby per capita GNP)-- at least at its earlystages. Second,savingratesand growthrates arepositivelycorrelatedacrosscountries.Third,incomeinequalityseems anddeclinebeyondcertainlevelsof per capitaincome,as predictedby the to riseat earlystagesof development, 'Kuznetscurve'. Fortheoverallsample,wealsofinda negativeassociationbetweenaggregatesavingratesand standard measuresof incomeinequality,althoughthe relationshipappearsweakerthanthe above'stylizedfacts', and is not robustacrosssubsamples.Moreimportantly,this refersonlyto the simplecorrelationbetweensavingand incomedistribution. Themoresubstantivequestionis whetherthe associationbetweenboth variablescontinues to holdonceotherstandardsavingdetenninantsaretakenintoconsideration.To answerthis question,weneed link,and placethe latterin a broaderframework of thesaving-inequality to examinethetheoreticalunderpinnings encompassingotherrelevantdeterminantsof saving.This task is undertakenin thenext section. III.
Saving and Income Distribution: A BriefSurvey Aggregatesaving is the outcomeof individualsavingeffortsby heterogeneousmembersof different
classesof savers. Heterogeneityamongsaversis a key featurethat helps understandhowaggregatesavingis affectedby changesin savingdeterminants,includingpolicies.Heterogeneitymay be relatedto the fact that differenttypesof individualsdeterminetheir consumption/saving plans accordingto differentobjectives(i.e., their preferencesare not identical).Altematively,even if all individualspossess identicalpreferences,their behaviormaydifferbecausetheyface differentinstitutionalconstraints(e.g., in theiraccessto borrowing),or behaviormay vary dependingon the valuesof exogenousvariablesrelevantfor their consumption/saving decisions(e.g.,no savingcanbe madebelowa certainthresholdof incomeneededfor subsistence). Heterogeneityis of courseimportantbecausewhenagentsaredissimilarthe aggregatelevelsof those variablesrelevantfor individualsavingdecisionsare not sufficientto determineaggregatesaving-- the latter also dependson the distributionof such variablesacrossindividualsavers. Evenif all agentshad identical preferences,distributionstill matters as long as their (common)decisionrule for savingis not linearin the relevantvariables.In suchcase,a givenchangeintheaggregatevalueof a savingdeterminant(suchas disposable incomeor wealth)can havevery differentconsequencesfor aggregatesavingdependingon how it impacts differenttypesof savers.Likewise,purelyredistributivepoliciescanhavean impacton aggregatesaving-- e.g., public transfers to the poor financedby taxeson therichmayreducetotal savingif the formerhave a higher propensityto spendthanthe latter.
7 and savingdetermination,with a focuson income Belowwereviewbrieflytheliteratureonconsumption in particular.Weadoptan aggregateperspective,althoughsome referenceis madeto the (orwealth)distribution distinctionbetweenprivateand publicsaving,or firmand householdsaving,whererelevant.Our approachis seectiveratherthanexstive. We first examinetherelationshipbetweensavingand threebasicdeterminants: 9 . Then we highlightdifferentchannelsthroughwhichdistribution income,the rate of retum,and uncertainty
affectsthe relationshipbetweenthesetwo basicvariablesand aggregatesaving.We concludewith somebrief remarkson the influenceof standardeconomicpolicieson saving,discussinghowtheir impactis affectedby distributivefactors. I1I.1 Basicsavingdeterminants Income Incomeor wealthis the maindrivingforcebehindconsumption(andhencesaving)and thereforehas attractedthe largestattentionamongall potentialsavingdeterminants.But beyondthis very generalstatement thereis verylittlein commonamongdifferentsavingtheories.Thedifferencesstart with the appropriatemeasure of income:currentincome(intheconventionalKeynesianhypothesis,henceforthKH),permanentincomenet of taxesoverthelife-cycle (thelife-cycle hypothesis,LCH),permanentincomenet of taxes over an infinitehorizon (the permanent-incomehypothesis,PIH) or, as a variant of the latter,pemanent incomenet of govenment hypothesis). spendingover an infinitehorizon(REH,the Ricardian-equivalence As a startingbenchmarkconsidereitherthePIH or its REHvariantfor a representativeconsumer.'°A riseinnetpermanentincomeleadsto a propoftionalincreasein consumptionlevelswithoutany effecton saving. Temporalyincomechangesaresmoothedoutthroughappropriatelevelsof saving.If both currentand permanent incomerise by the sameamount,consumptionand savingratiosto currentincomeremainunaltered;in turn, incomechangesresultin movementsof the saving(consumption)ratio in the same(opposite) purelytemnporary direction. Accordingto the PIH,incomegrowth -- i.e.,the increaseof futureincomerelativeto currentincome levels -- must reducesavingrates, as consumersraise currentconsumptionin anticipationof higherfuture income.This,however,is at oddswiththe positivesaving-growthcorrelationobservedin the dataand reviewed
ofincomeandtherateofreturn,andthereforeis reallynot a refersbasicallytothevariability 9Uncertainty betweentheeffectson savingof income thedistinction separatevariable.However,becausetheliteratureemphasizes levels,wetreatthemseparately. andthoseoftheirrespective (orrateofreturn)variability (1957),Hall(1978)andFlavin(I1981). 10SeeFriedman
8 in theprevioussection,andhaspromptedseverallinesof researchattemptingto explainwhyrationalconsumers mayfailto adjusttheirconsumptionlevelsin the face of risingincome.' Theexplanationsaremostlybasedon non-standard preferences incorporating consumption habits(wiuchpreventrapidchangesin consumptionlevels), subsistenceconsumption levels(belowwhichno savingwhatsoevertakesplace,so that the savingpropensityis effectivelyzero)or wealthas an argumentof theutilityfunction(theclassical"capitalistspirit" model).Under eachofthesefomlulations, higherincomecangenerateinceasesinsaving,at leasttransitorily.Onthe otherhand, as we shall see later, once the representative-agentframeworkis abandoned,some of these preference specificationsprovidepossiblechannelsthroughwhichincomedistributioncouldaffectoverallsaving. Attheotherendof thetheoreticalspectrumisthe LCHof ModiglianiandBrumberg(1954, 1979)-- the maincompetitorof thePIH-REHtheories.As opposedto the representative-agent frameworkof the latter,agent heterogeneityis the cornerstoneof the LCH.Aggregatesavingresultsfromthe additionof savingby different age-specific cdoorts.Eachcohortsmoothsconsumptionover a finitehorizon,givenlifetimeresourcesthat -- in thesimpleLCHhypothesis-- arenot transferredacrossgenerations.Overthe lifecycle,savingand consumption followhump-shapedpatterns,with dissavingat youngage, the peakof savingat workingage,and dissaving duing re=remut ashouseholds rundowntheiraccumulated assets.Hencesavingpropensitiesdependon ageand differsystematicallyacrosscohorts. Theimpactof growthon savingin theLCHframnework is ambiguous.On theone hand,the earningsand savingof theworking-agepopulationwillrise relativeto retirees' dissaving,thuspushingup aggregatesaving. On the other hand, however,workerswill anticipatehigherearningsduringtheir workingage, and this will depresstheirsavingjust like in the PIHframework.Theoveralleffectis thereforeindeterminate. As mentionedearlier,thereis of coursean altemativeinterpretationof whystandardmodelsof saving havesuch a hard time generatinga positivegrowth-savingassociation.Ratherthansavingbehavior,the latter couldjust reflectthe combinationof two well-establishedempiricalfacts: the positiveassociationbetween investmentand growth(Levine and Renelt 1992) and the equally positive saving-investmentcorrelation (FeldsteinandHorioka1980,Feldstein andBachetta1990),ofteninterpretedas evidenceof intemationalcapital immobility(see Schmidt-Hebbel, Servenand Solimano1996). T7he rate of return Thesecondkey factorgoverningthe intertemporalallocationof consumption,andhencesaving,is the rate of return.However,its impacton savingin the representative-agent frameworkof the PIH is ambiguous,
II SeeCarrollandWeil(1994)andDeaton(1995).
9 becausechangesin therateofreturnhaveboth incomeand substitutioneffects,whichrun in oppositedirections (exceptin particularcases, likewhenthe consumeris a net debtor).Thesituationis similarlyambiguousin the LCHfraewvrk Herechangesin interestratesentailtransfersamongcohorts,and the net impacton aggregate consumption andsavingdependsonthedifferentcohorts'savingpropensitiesas wellas on theirrelativesize(see Deaton 1992).In practice,empiricalstudiessupportthesetheoreticalambiguities,and typicallyfail to find significanteffectsof interestrate changeson saving. Recentworkby Ogaki,OstryandReinhart(1994)addsa newdimension to theeffectof the rate of return on saving.Theypresenta modelin whichtheelasticityof intertemporalsubstitution(andhencethe interestrate sensitivityof saving)rises withthe levelof income.Empiricalestimationof the modelon a cross-countrydata set providessomesupportfor this view. Uncertainty Recentworkon savinghas movedawayfromthe simpleversionsof the PIH and LCHmodelstoward broaderframeworks incaporatinguncertainty aboutfutureincome,therate of returnto savings,the lengthof life, etc. One line of workhas relaxedthe certainty-equivalent utilityfunctionof Hall's (1978)PIH, allowingthe marginalutilityof consumption to be nonlinear,typicallyconvex. This convexitycreatesprecautionarymotives for savingwheneveruncertaintyaboutfutureconsumptionis introduced:it is prudentfor individualsto limit borrowingand not consumetoo muchuntiltheyknowmoreabouttheir future-- an effectthat is strongerthe greatertheuncertaintyaboutlifetimeincome.2 Tlheexistenceof the precautionarymotivefor savingsis less in doubtthan its actualmagnitude.While empiricaltesting has been limited,it is likelythat precautionarysavingmay representwellthe short-term consumption-smoothing behaviorof the averageconsumer,but not explainthe bulk of saving,whichin most societiesappearsto be carriedoutby a relativelysmallnumberof wealthierhouseholds(seeCarrolland Summers 1991andDeaton1995). 111.2Incomedistribution and saving Letus nowfocusin moredetailon the impactof changesin the distributionof income(orwealth)on aggregatesaving.We examinefourtopics:(i) linksbetweensavingand the unctionaldistributionof income;
2
UnRlike in thesirnplePIH,inthisframework intertemporal transfersofresourcesthatleavethepresentvalue oflifetimeincomeunaffected canstillaffectsavingbehavior.Higherpresenttaxeswithlowerfuturetaxesleadto a declinein consumption if individuals haveto rebuildtheirprecautionary balances(andcannotborrowagainstthefuture taxbreak).
10
(ii) links betweensavingand thepersonal distributionof income;(iii) liquidityconstraints,distributionand saving;and(iv) indirecteffectsof distributionon saving. Fundionaldistributionandsaving The link betweenthe functionaldistributionof incomeand saving(and growth)is at the heartof the neoclassical gowthmodel(Solow1956),as wellas theneo-Keynesiangrowthmodelsof Lewis(1954),Kaldor (1957) and Pasinetti(1962). Thesemodelsare general-equilibrium in nature, with both savingand income distributionas endogenousvariables. Unlike the neo-Keynesianmodels,in the neoclassicalframeworkworkers and capitalistsdo not necessarily differ in their saving patterns. Aggregatesaving behavior in conjunctionwith production characteristicsdeterminesincomedistribution.The reasonis that saving influencesinvestmentand thus the capitalstock. An increasein thepropensityto savewillincreasethe long-runcapital-laborratio, andcapital's incomesharewillriseor fall dependingon whethertheelasticityof factorsubstitutionis greateror smallerthan one, respectively. Bycontrast,theneo-Keynesian giwth modelsof Lewisand Kaldorassumefrom theoutsetthat workers 3 Lewis(1954)arguesthat most savingcomesfromthe profits and capitalistshavedifferentsavingbehavior."
oftheentrepreneurs in themodem,industrialsectorof the economy,whosave a high fractionof theirincomes, whileothergroupsin theeconomysaveless.Themoreferventtheactivitiesof the capitalists,the fasterdoesthe distributionof incometilt towardprofits,increasingthe aggregatesavingratio. Incomeredistributionfromthe low-savinggroupto the entrepreneursraisesaggregatesaving. Likewise, in thesimplestformof Kaldor's(1957)model,workersspendwhat theyearn (theirpropensity to saveis zero)andtheshareof profitsin nationalincomedependspositivelyon the investment-output ratio and inverselyonthepropensityto saveof thecapitalists.Thus,likein Lewis' model,an increasein investmentraises the incomeshareof profitsat theexpenseof the wageshare,and themorethe capitalistsspend,the morethey earn-- the"widow'scruse"is neverempty. Pasinetti(1962)assumesthatsavingpropensities differamongclassesof individuals,ratherthanclasses of ineone. Workers'savingis not zero;indeed,theyare assumedto ownshareson the capitalstockand receive part of the profits.Nevertheless,the implicationsfor the shareof profits in incomeare the sameobtainedby
13SeeMarglin (1984)forin-depthanalyses of theclassical, neoclassical, no-Marxian, andneo-Keynesian approaches.
I1
Kaldcr.Thefactthatworkerssavedoesinfluencethedistributionof incomebetweencapitalistsand workers,but doesnot influencethedistributionof incomebetweenprofitsandwages. While these neo-Keynesianmodelsestablish a clear relationbetweenthe functionaldistributionof incomeand saving,it is worthnoting that their implicationsin termsof the inequality-savinglink are less automatic.Thereasonis that in manysocietieswageearnersdo not necessarilyrepresentthe poorersegments ofthepopulation, whicharelikelyto includeinsteadsmallrurallandownersand self-employedindividualsin the informal sector.As a result,the associationbetweenthe functionaland personaldistributionsof incomeis empiricallyratherweak(Atkinson1994). PersonalDistributionand Saving With consumerheterogeneity,standardconsumptiontheoriesalso generatelinks betweenpersonal incomedistribution andaggregatesavingthat, unlikethe classicaltheoriesjust referredto, do not dependon the exogmousdistinctionof two groupsof saversand non-savers.Theselinksresultfrom a non-linearrelationship betweenindividualsavingand income,which can havedifferentsources,but in most cases -- althoughnot invariably-- leadsto a positiverelationshipbetweeninequalityand aggregatesaving. A startingpointis againthe LCH,amendedto includebequests.Thelatterwere absentfromthe early formulationsof the LCHbecausetheywere thoughtinsignificant.Only 20 percentof total U.S. wealthwas believedto comefrombequests,with the remaining80 percentdue to the savingof livingindividuals.More recentstudieshavevirtuallyreversedthis 20-80ruleto 80-20(Kotlikoffand Summers1981, 1988).This is an i.nportantfindingfromthetheoreticalviewpointbecause,witha fullydevelopedintergenerational bequestmotive, thedistinction betweentheLCHandthePIHvirtally vanishes,as differentage cohortsbecomemutuallylinked. Theviewthat bequestsas a savingmotiveare moreimportantthan life-cycleconsiderations,and that the elasticityof bequestswithrespectto lifetimeresourcesexceedsunityhelpsexplaina numberof empirical puzzlesontheLCHmodel(seeDeaton1992and 1995for furtherdiscussionand references).First, thereis little evidencethat the olddissave,as impliedby the simpleLCH;on the contrary,theirsavingrates appearto be as high or evenhigherthanthoseof younghouseholds.Second,if bequestsare a luxury(at leastover a relevant wealthrange),savingratesshouldbe higheramongwealthierconsumersand richercountriesthan in the rest, whichempiricallyseemsto be thecase.Third,the fact that savingappearsto be concentratedamongrelatively fewricherhouseholds, whomaybe accumulating mostlyfor dynasticmotives,is also in agreementwith a central roleof bequestsin drivingsaving. If bequestsbythewealthyarea chiefforcebehindsaving,as thisliteraturesuggests,the situationis close to thatdescribedby the"capitalistspirit" modelmentionedearlier,in whichwealthis accumulatedfor its own
12 sake(see,forexample,Zou 1993),andhigherwealthpromptsfurtheraccumulation-- becauseconsumptionand wealtharegrosssubstitutesin theagent'sutilityfunction.Moregenerally,the apparentconcentrationof saving in a small groupof richerindividualssuggeststhat a betterunderstandingof theirsavingbehavioris essential to understandaggregatesavingpatterns. Thekeyissueis that if the elasticityof bequestswithrespectto lifetimeresourcesis greaterthan unity reduceaggregate fromrichto poorwillunambiguously (sothatbequestsarea lwaurygood),inoorneredistribution saving(Blinder1975).As we shallseelater, this viewhas receivedsomeempiricalsupport. Analtemativeroutethroughwhichincomedistributionmaymatterfor aggregatesavingwas suggested by Becker(1975).If therearedecreasingreturnsto humancapital,the poorwillinvestrelativelymorein human capital than the rich. Sincehumancapital expendituresare consideredas consumptionin standardnational accounting, the neasuredsavingratesof thepoor willappearlowerthanthoseof therich,evenif their"ovaall" savingrates (includinghumancapitalaccumulation)areidentical. Inturn,precautionarysavingalso impliesa linkbetweendistributionandsaving.Consumerswith low assetstendto compressconsumption to avoidrunningdowntheirprecautionarybalances,so that theirmarginal propensityto consumeout of incomeis higherthanthat of thoseconsumersholdinglargeasset stocks-- they woulddevotemostof anyextraincometo consumption.Thusredistributionfromthewealthyto the poor would depressoverallsaving.Theoppositecouldhappen,however,if the poorfacegreateruncertainty,aremoreriskaverse,or havemorelimitedaccessto risk diversificationthanthe rich;in suchcircumstances,a transferfrom the latter to the formerwouldleadto higheraggregatesaving.A relatedview,advancedby Friedman(1957), holdsthat, if the cross-sectionaldistributionof incomereflectsfutureincomeuncertainty,thengreaterincome inequalityshouldraiseprecautionarysaving. Consumptionhabits,whosetheoreticalinterestliesmainlyin their abilityto generatepositivesaving4 , also have implicationsfor the savinggrowth correlationsthroughthe slow adjustmentof consumption'
distribution link. This can be most clearlyseen in an LCH framework.Consumptionis costlier for young -- becausethehabititinduceshasto be fed for therest of life-- and cheaperfor old consumers.Thus households theyoungwilltendto savemorethantheold, and incomeredistributionfrom thelatterto the formerwillraise overallsaving.Redistribution fromrichto poor canalso raisesavingunderthe (not too implausible)assumption that habits make it moredifficultto adjustfutureconsumptiondownthanup. In such case,richerconsumers would reduce theirconsumptionlevelby the full amountof the transfer,while poorerconsumerswould be reluctantto raisetheirconsumptionby the sameamount.
andWeil(1994). 14 SeeCarrollandWeil(1994)andCarroll,Overland
13
Borrowingconstraints,saving and distribution The inabilityof some consumersto borrowforgesa powerfullinkbetweenincomedistributionand saving.Consumptionmodelswith borrowingconstraintsdivideconsumersinto saversand non-savers.Unlike in the classicalmodelsof functionalincomedistribution,however,this does not arise from the exogmous distinction oftwoclassesof peopleorpreferwes, but fromthedistributionof preferencesamongthepopulation, interestrates,the variabilityof earnings,andtheirrate of growth. Borrowingconstraintsact in a way similarin manyrespectsto the precautionarysavingmotive.Given the inabilityto borrow,consumersuse assetsto bufferconsumption,accumulatingwhentimes aregood and running them down to protect consumptionwhen earningsare low. In the theoreticalmodels,bofrowing constraintsmostlyaffectimpatientconsumerswhofacehigh earningsgrowth(Deaton1991). Theempiricalrelevanceof borrowingconstraintsis wellestablished However,theyhelpexplainmostly short-termsavingfor consumptionbuffering,not long-termsaving for old-ageor for bequests.For example, Hayashi(1985)findsthat fora significantfractionof the Japanesepopulationthe behaviorof consumptionover is consistent with theexistenceof creditrationinganddifferentialborrowingand lendingrates.Borowing
tie
cmnstraitsappearparticularly imrtant withregardto savingforhousingpurchases.Jappelliand Pagano(1994) showthatcreditconstaintsreflectedin housingnortgageregulationsare an importantexplanatoryfactorbehind cross-countrydifferencesin saving. Inpractice,bcrrowingconstraintsaffectmostlypoorerhouseholds,and not the richwhoholdlargeasset stocks. Thus, likethe precautionarysavingmotive,borrowingconstraintslikelyare a chiefforcebehindthe savingbehaviorof lower-andmiddle-income groups,butnotricherhouseholds.Incomeredistributionawayfron thelattermakesthebcowing constraintsless likelyto bind and reducesthe importanceof buffer-stocksaving, thusloweringaggregatesavingrates. Indirect links Otherrecentliteraturebringsout someindirectlinksbetweendistributionand savingoperatingthrough thirdvariablesthat affect saving.One particularlyactivelineof researchis the"politicaleconomy"literature, whichhas underscoredthe positiveassociationbetweenincomeequalityand economicgrowthin a framework ofendogenous growthand endogenouseconomicpolicy'5 . Inthis approach,causalityruns fromdistributionto
5
Fora generaloverview ofthedifferentstrandsoftheliterature onincomedistribution andgrowh,se Solimno
(1995).
14 growthvia investment.In addition,thesemodelsincludea politicalmechanismwhichprovidesa linkbetween incomeinequalityandeconomicpolicy. The main line of argumentis that a highlyunequaldistributionof incomeand wealthcauses social tensionandpoliticalinstability(violentprotests,coups,etc.);theresultis a discouragementof investmentthrough imaeaseduncutaity, alongwithadverseconsequencesfor productivityand thus growth (Perssonand Tabellini 1994,Alesinaand Rodrik 1994,Perotti1995,Alesinaand Perotti1996).In addition,incomedistributionmay affectgrowthalso throughtaxationand governmentexpenditure:in a moreunequalsocietythere is greater demand for redistributionand thereforehighertaxation,lowerreturnsto investmentsin physicaland human capital,andless investmentand growth. Theseargumentshavereceivedsomeempircalsupport.Fromthepointof viewof saving,the implication is that if savingis positivelydependenton growth-- or, alternatively,if savingreflectsin part the investment decisionsof firms -- thenhigherinequalitywill,throughthe abovechannels,depressaggregatesaving -- in contrastwith the positiveimpact of inequalityon savingimpliedby most of the theoriesexaminedso far. engagemoreactively inequalitymay alsotendto lowerpublic saving,as govemrments distributive Additionally, in redistributiveexpenditures-- as in thepopulistexperiencesexaminedby Dombuschand Edwards(1991). It is importantto notethat the existenceof an inverserelationshipbetweeninequalityand investment, as suggestedby the aboveliterature,couldalso imply a negativeassociationbetweeninequalityand saving throughfirms'earningsretention.Thelatteris typicallythe primarysourceof financingfor privateinvestment, sothat if higherinequalitylowersinvestmentit shouldalso reducefirmsaving.Whathappenswithaggregate saving,however,dependsonwhetherfirmowners(i.e.,households)canpierce the"corporateveil"that separates andfirmdecisions.If this is the case,a fallin firmsavingcouldbe fullyoffsetby a rise in household houschold saving,leavingaggregatesavingunaffected. IV
Empirical Studies Empiricaltests of the impactof incomedistributionon saving are rather scarce.Someearly studies
followedthe Kaldor-Lewisapproachand focusedon the functionaldistributionof income.Alongtheselines, (1968),KelleyandWilliamson(1968)and Gupta(1970) foundsomeevidence (1961),Williamson Houthakker that the propensityto save fromnon-laborincomeexceedsthat fromlaborincome. Morerecentempiricalstudiesfocuson theeffectof personalincomeinequalityon saving.Forthe most part,theyfindeitdr no effectsor a positiveimpact,althoughin thelattercasethe estimatesoftenarestatistically insignificantat conventionallevels.
15 Blinder (1975) uses U.S. time-seriesdata for 1949-1970to estimate an equation for aggregate consunptionincludingincomedistributionindicators.Hefindsthat higherinequalityappearsto raiseaggregate consumption(and thus lowersaving),althoughthe estimatedeffectis in generalstatisticallyinsignificant.He attributes this result to the lack of correspondencebetweenhis analyticalframework-- which predictsthe oppositeresult-- andhisempiricalmodel,and proposesas a preferableempiricaltest theestimationof separate consumptionequationsby incomeclass. This suggestionis takenup by Menchikand David(1983),whouse U.S.datato testdirectlywhethertheelasticityof bequeststo lifetimeresourcesis largeror smaller disaggregated fortherichthanfor otherincomegroups.Theyfindthat the marginalpropensityto bequeathis unambiguously higherfor thewealthy,so that higherinequalityleadsto higherlifetimeaggregatesaving. A relatedapproachis that of Bunting(1991),whousesconsumerexpendituresurveydata for theU.S. to estimateconsumptionas a functionof incomeleveland distributionby incomequintile. He finds strong evidencethathousehold spendingdependson both the levelanddistributionof income:the estimatedmarginal propensities to cansumeuniformly decline(andpropensities to savethereforerise) as the quintileshareof income rises. The coefficientsare highlysignificant,and the modelexplainsover half of the variationin household consumptionin the sample. Twoearlystudiesby DellaValleand Oguchi(1976)and Musgrove(1980)use cross-countrydataon bothindustrialanddevelopingcountriesto investigatetherelationshipbetweensavingand incomedistribution. Inbothcasestheresultsshowno statisticallysignificanteffectof incomedistributionon saving. Theexception aretheOECDcountriesincludedinthestudyby DellaValleandOguchi,for whichtheyfind someevidencethat increasedinequalitymayincreasesaving;Gersovitz(1988)suggeststhat theirfailureto obtaina similarresult forthedevelopingcountriesmaybe due to poor qualityof thecorrespondingincomedistributiondata. Inturn. Lim(1980)findsthat inequalitvtends to raise aggregatesavingrates in a cross-sectionsamnpleof developing countries,but his coefficientestimatesare significantat conventionallevelsonlyin somesubsamples. VenierisandGupta(1986)examinethe patternof averagesavingpropensitiesacrossincomegroupsin a cross-section sampleof 49 countries,usingan econometricspecificationthat includesalso politicalinstability as a savingdeterminant.Theirresults show that poorerhouseholdshavethe lowestsavingpropensities,but somewhatsurprisingly theyalsofindthatthehighestaveragesavingpropensitycorrespondsto the middle-income group,sothatredistribution againsttherichmayraiseor lowerthe aggregatesavingratiodependingon whether the favoredgroupis the middleclass or the poor,respectively.However,the interpretationof theirresults is somewhatuncleardue to their use of constant-pricesaving as the dependentvariable,whichhas no clear analyticaljustification.
16 Sahota(1993)testsa reduced-form relationshipbetweensavingand incomedistributioncontrollingfor theeffectsof per capitaincomeonsaving.Usingdataon65 industrialand developingcountriesfor theyear 1975, he regressesthe saving/GDPratioon the Gini coefficientand a quadraticpolynomialin per capitaincome(he includesalsoregionaldummyvariablestoremoveculturalandhabiteffects). Theparameterestimateon the Gini coefficient is foundto be positive,implyinga positiveimpactof inequalityon aggregatesaving,but the estimate is somewhatimpreciseand significantlydifferentfrom zeroonlyat the 10%level. Morerecently,Cook(1995)presentsestimatesof the impactof inequalityon aggregatesavingratiosin LDCsfroma conventional savingequationincludingalso the leveland growthrate of real income, dependency ratios,anda measureofcapitalinflows.A dummyforLatin Americancountriesis also addedto theregressions, althoughitsjustificationis unclearsincenootherregionaldummiesareincluded.Usingdecadeaveragesfor the 1970sfor 49 developingcountries,he finds a positiveand significanteffect of inequalityon saving,which appearsrobustto somechangesin specificationand to the choiceof alternativeindicatorsof incomeinequality. Finally,Hong(1995)reportseconometricresultson the effectof incomeinequalityon gross domestic savingratiosin cross-countrysamplesof 56 to 64 developingand industrialcountries,using 1960-85averages foreachcountry.Hefindsthattheincomeshareof the top 20%of thepopulationhas a positiveeffecton saving rates,controllingfor old-agedependency,income(and/oreducation)level,and incomegrowth. V
EconometricResults In this sectionwepresentnewempiricalresultson the cross-countryrelationshipbetweensavingand
incomedistribution.Ourobjectiveis to assesstheimpacton savingof alternativeincomedistributionindicators, after controllingfor incomeanddemographicvariables.Our basicsampleincludes52 countries(see the data appendix). We limit ourselvesto variantsof simplespecificationsfoundin comparablecross-countrystudiesof saving(seee.g. Edwards1995,and Masson,Bayoumiand Samiel1995).Thebasicequationto be estimatedis the following: (1)
GNS/GNP= ao + a, gnp
+
a2 (gnp)2 + a3growth + a4 old + a.,young + a6 distrib
whereGNSIGNPis theratioof current-pricegross nationalsavingto current-pricegrossdomesticproduct,gnp is real per capitagross nationalproduct,growth is the (geometric)averageannualrate of growthof real per capitagrossnationalproduct,old is theold-agedependency ratio(ratioof populationof age65 and aboveto total
17 population), young is the young-agedependencyratio(ratioof populationof ages0 to 15to total population), and distribis an incomedistributionvariable. The basic specificationin (1) embedsboth a linearand a quadraticterm in real per capitaincometo encompassthe non-linearrelationbetweenthe savingrate and incomedescribedin section11;accordingly,we 6 . The majorityof empirical shouldexpecta, > 0, a:2 < 0. Allothervariablesenterlinearlyin ourbasic equation"
studiessuggestthat the coefficienton growth shouldbe positive,whilethose on the dependencyratiosshould be negative,accordingto standardlife-cyclearguments." As incomedistributionindicatorwe use the Ginicoefficient,althoughwe presentalso someregressions using insteadthe ratio of the incomeshare of the poorest40 percentof householdsto that of the richest 20 percent,and the incomeshare of the middle60 percentof the population.The lattervariables,however,are availableonlyfor a smallersample. Thecorrelationmatrixof ourbasic set of regressorsin Table2 showsthreestrikingfeatures.First, as mentionedabove, all three incomedistributionindicatorsare very highlycorrelatedwith each other, with correlationcoefficientsin all casesexceeding.90 in absolutevalue.Second,the (negative)correlationbetween young-ageand old-agedependencyratiosis also vely large(-.93). Third,both dependencyratiosare closely correlatedwithreal per capitaincome(thecorrespondingcorrelationcoefficientsexceed.88).It willbe useful to keepin mindthesefeaturesof thedata for thediscussionof theempiricalresultsbelow. Table3 showsestimationresultsusingthebasicequationfor a varietyof samples.As a benchmark,the first columnreports parameterestimatesusing a specificationexcludingincomedistributionindicators.As expected,thesecondandthirdrowsshowthatsavingratiosrisewith incomelevels(a resultalso foundby Carroll and Weil 1994and Edwards1995)but taper off at high income,as indicatedby the negativecoefficienton squaredGNPpercapita.Specifically, the estimatesin columnI implythat, if theothervariablesare set at their samplemeans,the savingrate peaks(at a levelaround22 percent)whenper capitaincomereaches$9,000(in 1987dollars). In turn,thefourthrowin thetable indicatesthat savingratiosare positivelyassociatedacrosscountries withpercapitaGNPgrowthrates.A 1-percentincreasein real growthraises thenationalsavingratioby about
16 Allvariables (exceptthevariability ofincomedefinedbelow)aremeasuredbytheirmeansover1965-1994 (ortheavailable sample,if shorter). 17 SeeLeff(1969)andModigliani (1970).Thedependency ratioisoftendefinedto includealsothepopulation under15.SeeGersovitz (1988)forananalytical discussion of theeffectsoftheseandotherdemographic variableson
saving.
18 1.5percentagepoints.Finally, it can be seen from the fifth and sixth rows in column 1 that both young and oldage dependency ratios have the expected negative effect on national saving rates. The simple specification in column I accounts for nearly 60 percent of the observed cross-country variationin nationalsavingrates. However,the estimatedcoefficientson per capita income and its square, as well as on the young-age dependency ratio, have rather large standard errors. The obvious reason for this lack of precisionis the strong cross-correlation between age-dependencyratios and real income described in Table 2.'" Indeed,ajoint F-testof the null hypothesisthat young-agedependency,real income and real income squared have no impact on savingyields a test statistic of 5.49, which overwhelmningly rejects the null at the I percent level. Columns2-4 in Table 3 augmentthe specificationin the first columnusing the Gini coefficient as income distribution indicator in different country samples. The sign pattern of the parameter estimates in the first six rows remainsunchanged,and the full-sample estimates in column 2 are virtually identical to those in column 1. However,the saving-growthrelationshipdoes not appearrobust across country groups: it is much stronger among industrialcountries (column3) than in developing countries (column 4) -- the same cross-country pattem found bv Carrolland Weil (1994). Controlling for other factors, a I percent increase in the growth rate raises national savingratiosby 3.3 percentage points among OECD countries, and by only 1.I percentage point among LDCs. The seventh row reports the parameter estimates for the Gini coefficient. They are positive for the full sample and the OECD subsample, and negative for LDCs. In all three cases, however, they are insignificantly differentfrom zero.As before,real income,its square, and the dependency ratios are not individually significant, but F-tests cannot reject their joint significance even at the I percent level. Columns 5 through 7 use as income distribution indicator the ratio of the income shares of the top 20 andbottom fortypercentof the population. This results in a loss of seven observations (two industrial countries and fivedevelopingcountries)due to unavailability of the share data. Apart from a general loss of precision, the estimationresults are otherwise very sumilarto those obtained usmg the Gini coefficient, as should be expected in view of the very high correlation reported above between the two income distribution indicators. Columns 8 and 9 of Table 3 show the results of excluding from the sample the group of take-off developingcountries,whichsome mightargue are 'exceptional' from the viewpoint of saving (and also growth). For both the full and LDC samples in columns 8 and 9, the main consequence is that the estimated coefficient on growth loses all significance, a finding similar to that reported by Carroll and Weil (1994) when excluding from their sample the East-Asian 'tigers'. In addition, in the LDC sample (column 9) the estimated coefficient on the income distribution indicator becomes larger in absolute value and closer to statistical significance,
Is Thecorrelationbetweenreal per capitaGNPandits square,not presentedin Table2, equals.98.
19 suggestinga negativeeffectof inequalityon saving.Theinterpretationof this result,however,is a bit unclear. Bydroppingthe take-offcountries,we areeliminatingeightof the tenhighest-savingcountries(seeFigure 1), so that in effectwe are truncatingthe samplefrom above.It is wellknownthat in such circumstancesOLS estimatesare biased,althoughthedirectionof thebias is not knownin general(e.g.,Maddala1983). Next we checkthe robustnessof our main result-- that incomeinequalitydoes not affectaggregate saving-- by estimatingaltemativespecificationsthat havebeenusedin previousstudies.Table 4 presentsthe resultsusingthe fullsample.The first twocolumnsexplorepossiblenon-lineareffectsof incomedistribution, interactingthe Ginicoefficientwithreal per capitaincomeand addinga quadraticterm,respectively.Neither provedsuccessful. Column3 adds incomevariabilityto thebasic set of regressors,withvariability specification measuredby the standarddeviationof real per capitaGNP aroundtrend relativeto the averageGNP level; accordingto the precautionarysavingmotive,it shouldhave a positiveimpacton savingratios.In fact, the estimatedcoefficientis negativebut insignificant.Thelikelyreasonis that aggregateincomevariabilityis very differentfrom -- actuallymuch lowerthan -- individualincomevariability,as shown by Pischke(1995). Column4 introducesregionaldummies,as donefor exampleby Sahota(1993),with industrialcountriesas the omittedcategory.However,thedurmniesare not significant,eitherindividuallyor jointly(a joint F-testyields F(3, 42)=0.681,far below conventionalsignificancelevels).The last two columnsin Table 4 investigate alternativeinequalityindicators:column5 uses the incomeshareof themiddleclass,and column6 adds to this theratioof incomesharesof the top 20 and bottom40 percentof thepopulation.In neithercase do we find any significanteffectson saving. As a finalcheckon our results,and alsoto facilitatecomparabilitywithotherempiricalstudies,Table 5 presentsestimationresultsusinggross domesticsavingandreal per capita GDPas the relevantmeasuresof
saving and income,respectively.Thefirst two columnsestimateour basic specificationon the full and LDC sample, respectively.As canbe seen,the maindifferencewith theestimationresultsin Table3 is the lossof significanceof incomegrowthas a savingdeterminant.Forthe fullsample,the parameterestimateon theGini coefficient is verysimilarto thatreportedby Sahota( 1993),but fallsfar shortof statisticalsignificance.Forthe LDCsample,the estimateturnspositive(recallthat it wasnegativewhenusingthe nationalsavingratio as the dependentvariable),but its precisionis extremelypoor. Theremainingcolumnsin Table5 reportalternativespecificationsaddingincomevariability(computed nowon thebasisof realGDP),regionaldummies,andusingtheratioof incomesharesas indictorof distribution. on incomevariabilityhas thecorrect(positive)sign,and the Themainnoveltiesarethattheestimatedcoefficient
20 regionaldummiesare individuallysigmficant.In everyspecification,however,we fail to find any significant effectsof incomedistributionon saving.'9 Ourfindingsstandin starkcontrastto someof therecentempiricalliteraturereviewedabove(including Lim 1980,Venierisand Gupta 1986,Sahota1993,Cook 1995,and Hong 1995)that findsa positiveeffectof incomeconcentrationon saving.Ourdeviationfrom this literature-- that seemsrobust to altemativesaving measuresand specifications-- is likelydue to our use of the new andbetter cross-countrydata set on income distributionconstructedby Deiningerand Squire(1995). VI
ConcludingRemarks Recenttheoreticalandempircalliteraturehasexaminedthe linksbetweeninequalityand investmentand
inequalityandgrowthHowever,less attentionhas ben paid to the relationshipbetweensavingand distribution. Yetit is hardto understandaggregateconsumption andsavingwithouttakingintoaccountthe factthat theyresult agents,a fact that makesincomedistributiona potentially from thebehaviorof heterogeneousmicroeconomic importantfactorbehindoverallconsumptionand saving. andempiricallythe linkbetweenincomedistributionand aggregate Thispaperhasreviewedanalyfically of thisissuehavebeenmostlyconfinedto Neo-Keynesiangrowthmodels, saving.Whilesystematicexplorations frameworkis abandoned,consumption the paper has arguedthat, oncethe conventionalrepresentative-agent theorybringsouta numberofchannelsthroughwhichincomeinequalitycanaffectsaving.Further,in most cases the relationshipthat arisescan be expectedto be positive,so that on theoreticalgroundshigherinequalityis, ceteris paribus, likelyto be associatedwith highersaving.
Thepaperhasalsopresentedneweconometricevidenceon the saving-inequality link.Usinga newdata set on incomedistribution for a largecross-countrysample,on the wholewe do not find evidenceof any significant associationbetween standardinequalit- indicators and saving ratios, once other key saving determinantsare takenintoconsideration.This conclusionholds for a varietyof samples,incomedistribution indicators,and empiricalspecifications. There are, however,some caveats that make our empiricalresults tentative.First, becauseof the unavailabilityfor most countriesof longtime-serieson incomedistribution,onlythe cross-countrydimension of the data has beenexploitedhere.Whilethis entailssome lossof information,it is well knownthat income distributionindicatorsgenerally displaylittlevariationovertime relativeto that acrosscountries,and thus on the
the incomeshares of the 19Thesame resultwasobtainedin otherregressions(notreported)usingalternatively top20, middle60, andbottom40 percentof the populationas inequalityindicators.
21 wholewedonot thinkthat omissionof thetime dimensionhas any majorconsequencesfor our results.Second, ouremnpirical estimates-- likethosereportedinthe vast majorityof the literatureon saving-- arebased on the implicitassumptionthat causalityrunsfrom income,growthanddistributionto saving.Whilewe areawareof thepotentialsimultaneitybetweenthesevariables,wealso believethat the searchfor validinstrumentsis not a trivialtask,andweleaveit forfuturework Third,relatedto this, our empiricalestimatesfocusonlyon the direct effects of inequalityon saving ratios, ignoringpossible indirect effects operatingthrough other saving determinants - like,for example,the negativeimpactof inequalityon growththat the recentpolitical-economy literaturesuggests.To explorethetotaleffectof inequalityon savingin a satisfactorymannerone wouldneed an analyticaland empiricalframeworkencompassingtheseindirectchannels. Ideally,the startingpointto addressthe lattertwocaveatswouldbe to specifya completetheoretical modeldescribing,as a minimum,thedetermination not only of saving,but also of the distributionof incomeand its growthrate. This,however,is likelyto be a formidabletask,wellbeyondthe scopeof this paper.
DataAppendix Thevariablesintroduced insectionsII andV andtheirdefinitions andsourcesarethefollowing: VariableName
Definition andSource
Grossdomestic savingratio
grossdomestic savingsrelativeto grossdomesticproductin currentprices,averageover1960-94;TheWorldBank
Grossnationalsavingratio
grossnationalsavingsincluding netcurrenttransfersrelativeto grossnationalproductin currentprices,averageover1965-94; TheWorldBank
RealGDPper capita
in constant 1987 U.S. dollars, average over 1960-94; The World
Bank Real GNPper capita
in constant 1987 U.S. dollars, average over 1965-94; The World
Bank RealGDPpercapitagrowthrate
averageover1960-94
22 Real GNP per capita growth rate
average over 1965-94
Gini coefficientand Income Share of
average over 1965-94; Deininger and Squire
Top 20% / Bottom 40% of Population
Income share of Middle 60% of
average over 1965-94; Deininger and Squire
Population
Old age dependencyratio
population aged 65 and over relative to total population, average over 1965-94; The World Bank
Young age dependencyratio
population aged 14 and below relative to total population, average over 1965-94; The World Bank
GDP variability
ratio of standard deviation of residuals of regression of real GDP per capita on time trend to real GDP; authors'calculation.
GNP variability
ratio of standard deviation of residuals of regression of real GNP per capita on time trend to real GNP; authors'calculation.
The number of countries in the full sample is 52. The country classification is the following. OECD countries: Australia,Austria,Belgium,Canada,Dernmark,Finland, France, Germany,Greece, Ireland, Italy, Japan, Netherlands, New Zealand,Norway,Portugal,Spain, Sweden, United Kingdom, and United States. Take-Off countries: Chile, China, Hong Kong,Indonesia,Korea(Rep.),Malaysia,Mauritius,Singapore,Thailand and Taiwan, China. Other developing countries: Bangladesh, Brazil, Colombia, Costa Rica, Dominican Republic, Egypt, Guatemala, India, Jamaica, Mexico, Morocco, Pakistan, Panama, Peru, Philippines, Sri Lanka, Tanzania, Trinidad & Tobago, Tunisia, Turkey, Venezuela, Zambia.
Not all countrieshave Gini and Income Distribution measures available for each year. Countries are included in the sampleonlyif theyhave at least one observationin each of two different decades. The distribution of countries according to the number of annual observations is the following: 38 (31) countries with less than 10 Gini (Income Distribution) observations,1I (11) countries with 10 to 20 Gini (Income Distribution) observations, and 3 (3) countries with more than 20 Gini (Income Distribution) observations.
23 References in H. CheneryandT.N. I. andS. Robinson(1989):"IncomeDistributionandDevelopment." Adelman, Srinivasan(eds.):Handbookof DevelopmentEconomics.New York:North-Holland. Alesina,A. andR. Perotti(1996):"IncomeDistribution,PoliticalInstability,and Investment",Eurpan Ecoomic Review forthcoming. Alesina,A. andD. Rodrik(1994):"DistributivePoliticsandEconomicGrowth."QuarterlyJournalof Economics109, 465-90. Relationship",Journalf AnandandKanbur(1993)in JDE:"The KuznetsProcessandthe Inequality-Development 2 5 5 2 DevelopmentEconomics40, p. - . Atkinson,A. (1994):"Seekingto Explainthe Distributionof Income",DiscussionPaperWSP 106,LondonSchoolof Economics.
Becker,G. (1975):HumanCapital.Cambridge:NBER. Effectsandthe AggregateConsumptionFunction",Journalof PoliticalEconomy87, Blinder,A. (1975): "Distribution p. 608-26.
Bosworth,B.P. (1993):SavingandInvestmentin a GlobalEconomy.Brookings:Washington,D.C. Bourguignon,F. andC. Mornison(1990):"IncomeDistribution,Development,andForeignTrade:A CrossSectional Analysis."EuropeanEconomicReview34. Bunting,D. (1991):"Savingsandthe Distributionof Income."Journalof PostKevnesianEconomics14,3-22. ConferenceSerieson Carnegie-Rochester Carroll,C. andD. Weil(1994):"Savingand Growth:A Reinterpretation." 1 3 3 - 19 2. p. 40, PublicPolicy Carroll,C. andL. Summers(1991):"ConsumptionGrowthParallelsIncomeGrowth:SomeNewEvidence."inB. D. BerrheimandJ. B. Shoven(eds.):NationalSavingandEconomicPerformance.Chicago: Universityof ChicagoPress,305-43. Carroll,C., J. Overland,andD. Weil(1994):"SavingandGrowthwithHabitFormation."manuscript. Clarke,G. (1992):"MoreEvidenceon IncomeDistributionandGrowth."The WorldBank.PolicyResearchWorking
PRa 1064. Collins,S. (1991):"SavingBehaviorin TenDevelopingCountries."in B. D. BernheimandJ. B. Shoven(eds.): NationalSavingandEconomicPerformance.Chicago:Universityof ChicagoPress, 349-72. Cook,C. (1995):"SavingsRatesand IncomeDistribution:FurtherEvidencefrom LDCs",AppliedEconomics27, p. 71-82. Techniquesfor the SocialSciences.New York:JohnWileyand Sons. Cowell,F. (1977):MeasuringInequalitv: Deaton,A. (1991):"SavingandLiquidityConstraints."Econometrica59, 1121-42.
24 Deaton,A. (1992):UnderstandingConsumption. Oxford:ClarendonPress. Deaton,A. (1995):"GrowthandSaving:Whatdo weknow,whatdo we needto know,andwhatmightwe learn?" manusgript.PrincetonUniversity,ResearchProgramin DevelopmentStudies. Deininger,K. andL. Squire(1995):"MeasuringIncomeInequality:a NewDataBase",unpublishedmanuscrit. The WorldBank. DellaValle,P. and N. Oguchi(1976):"Distribution,the AggregateConsumptionFunction,andthe Levelof Economic Development:SomeCross-Country Results",Journalof PoliticalEconomy84,1325-34. Dornbusch,R. and S. Edwards(1991):"The Macroeconomics of Populism."in R. Dornbuschand S. Edwards(eds.): TheMacroeconomics of Populismin LatinAmerica.Chicago:Universityof ChicagoPress. Edwards,S. (1995):"WhyAre SavingRates so DifferentAcrossCountries?:An InternationalComparativeAnalysis." NBERWorkingPaper5097. Feldstein,M. and C. Horioka(1980):"DomesticSavingandInternationalCapitalFlows."EconomicJournal90, 31429. Feldstein,M. andP. Bacchetta(1991):"NationalSavingandInternationalInvestment."in B. D. Bemheimand J. Shoven(eds.):NationalSavingandEconomicPerformnance. Chicago:Universityof ChicagoPress. Flavin,M. (1981): "TheAdjustmentof Consumptionto ChangingExpectationsaboutFutureIncome." Journalof PoliticalEconomy89,974-1009. Friedman,M. (I 957):A Theoryof the ConsumptionFunction.Princeton:PrincetonUniversityPress. Galor,0. andJ. Zeira(1993):"IncomeDistributionandMacroeconomics." Reviewof EconomicStudies60, 35-52. Gersovitz,M. (1988):"SavingandDevelopment."in H. Cheneryand T.N. Srinivasan(eds.):Handbookof Development Economics.Amsterdam:NorthHolland,381-424. Gupta,K.(1970):"PersonalSavingin DevelopingNations:FurtherEvidence",EconomicRecord46, 0. 243-249. Hall,R. (1978):"StochasticImplicationsof the Life-CyclePermanentIncomeHypothesis:TheoryandEvidence." Joumalof PoliticalEconomv86, 75-96. Hayashi,F. (1985):"Testsfor LiquidityConstraints:A CriticalSurvey."NBER WorkingPaper 1720. Hong,K.(1995):"IncomeDistributionandAggregateSaving",manuscript.HarvardUniversity,Cambridge,Mass., November. Houthakker,H. (1961):"AnIntemationalComparisonof PersonalSaving",Bulletinof the IntemationalStatistical Institute38,p. 55-69. Jappelli,T. andM. Pagano(1994):"Saving,Growth,andLiquidityConstraints."OuarterlyJournalof Economics109, 83-109. Kaldor,N. (1957):"A Modelof EconomicGrowth."EconomicJouma 57.
25 Kelley,A.C.and J.G.Williamson(1968):"HouseholdSavingsBehaviorin Develop9ingCountries:the Indonesian Case",EconomicDevelopmentandCulturalChange.16 (3): 385-403. Kirman,A.(1992):"Whomor WhatDoes the RepresentativeIndividualRepresent?"Jouna of EconomicPerspeii 2, 117-36. Transfersin AggregateCapitalAccumulation." Kotlikoff,L. andL. Sunmners(1981):"The Roleof Intergenerational Journalof PoliticalEconomy90,706-32. Kotikoff,L. andL. Summers(1988):"The Contributionof Intergenerational Transfersto TotalWealth:A Reply."in D. KesslerandA. Masson(eds.):Modellingthe AccumulationandDistributionof WealthOxford:Clarendon Press. Kuznets,S. (1955):"EconomicGrowthandIncomeInequality."AmericanEconomicReview89,1-28. Leff,N.H.(1969):"DependencyRates andSavingsRates."AmericanEconomnic Review59, 886-96. Levine,R. andD. Renelt(1992):"A SensitivityAnalysisof Cross-Country GrowthRegressions."Amanca Econic Revi 82, 942-63. Lewis,W.A.(1954):"EconomicDevelopmentwithUnlimitedSuppliesof Labor."TheManchesterSchool22, 139-91. Lim,D. (1980):"IncomeDistribution,ExportInstabilityandSavingsBehavior",EconomicDevdopmentandCultal Change26, 359-64. andQualitativeVariablesin Econometrics.CanbridgeUniversityPress. Maddala,G.(1983):Limited-dependent Maddison,A. (1992):"A Long-RunPerspectiveon Saving."ScandinavianJournalofEconomics94, 181-96. Mankiw,N.,D. Romer,andD. Weil(1992):"A Contributionto the Empiricsof EconomicGrowth",Q°uartb Joumal of Economics107,407-38. Marglin,S. (1984):Growth.Distribution,andPrices.Cambridge,M.A.:HarvardUniversityPress. Masson,P., T. BayoumiandH. Samiel(1995):"SavingBehaviorin IndustrialandDevelopingCountries."m InternationalMonetaryFund. Menchik,P. andM. David(1983):"IncomeDistribution,LifetimeSavings,andBequests",AmericanEconomicReview 73,p.6 7 2 -6 9 0 . Modigliani, F. (1970):"The LifeCycleHypothesisof SavingsandIntercountryDifferencesin the SavingsRatio",in W.A.Eltis,M.F.G.Scottand J.N.Wolfe(eds.):Induction.Growthand Trade. OxfordUniversityPress. Modigliani, F. andR. Brunberg (1954):"UtilityAnalysisandthe ConsumptionFunction:an Interpretationof CrossSectionData."in K.K.Kurihara(ed.):Post-Keynesian Economics.NewBrmswick,N.J.:RutgersUniversity Press. Modigliani,F. andR. Brumberg(1979):"UtilityAnalysisandthe ConsumptionFunction:an Attemptat Integration".in A.Abel (ed.):The CollectedPapersof FrancoModigiani.Vol.2, Cambridge,M.A.:MITPress. Musgrove,P. (1980):"Incomne Distributionandthe AggregateConsumptionFunction."Joumalof PoliticalEggw= 88,504-25.
26 Ogaki,M., J. OstryandC.M.Reinhart(1994):"SavingBehaviorin Low-andMiddle-IncomeDevelopingCounties:A Comparison."manuscriptInternationalMonetaryFund. GrowthL" Reviewf Pasinetti,L. (1962):"Rateof Profitand IncomeDistributionin Relationto theRateof Economnic EconomicStudies29, 267-79. Perotti,R. (1995):"Growth,IncomeDistribution,andDemocracy:Whatthe Data Say", ColumbiaUniversity,NewYork, September. Persson,T. and G.Tabellini(1994):"Is InequalityHarmfulfor Growth?TheoryandEvidence." Review84, 600-21. Pischke,J-S. (1995):"IndividualIncome,IncompleteInformation,andAggregateConsumption", 805-40. Sahota,G. (1993):"SavingandDistribution."in J.H Gapinski(ed.):TeEconicsofSavin AcademicPublishers,193-231.
63 (4),
Boston: luwer
Schmidt-Hebbel, K., L. Serven,andA. Solimano(1996):"SavingandInvestment:Paradigms, Puzzles,Policies",Wrid BankResearchObserver(forthcoming). Schmidt-Hebbel, K., S. Webb,and G. Corsetti(1992):"HouseholdSavingin DevelopingCountries:FirstCrossCountryEvidence."WorldBankEconomicReview6,529-47. Solimano,A. (1995)."The Endof the HardChoices?Revisitingthe Relationship betweenIncomeDistribution and Growth."manuscriptInter-American DevelopmentBank. Solow,R. (1956):"A Contributionto the Theoryof EconomicGrowth"Quar], Journal of Economics70,65-94. Venieris,Y., andD. Gupta(1986):"IncomeDistributionandSociopoliticalInstabilityas Determinatsof Savings:a Cross-Sectional Model",Journalof PoliticalEconomy94,p.87 3 - 8 8 3 . Williamson,J. (1968):"PersonalSavingin DevelopingNations:an IntertemporalCross-Sectionfron Asia",Eggini Record44, p. 194-202. Zou,Heng-Fu(1993):"The Spiritof CapitalismandLong-RunGrowth",manuscript,forthcomingin EI.gJonul of PoliticalEconomy.
Table I
Income Distribution Indicators: Descriptive Statistics Number of Observatons
Gini Coefficient
Income Share Redo of Top 20% to Bottom 40% Income Share of Middle 60%Y
Mean
Std. dev.
Mean
Std. dev.
Mean
Std. dev.
World
52
39.62
2.70
2.72
0.04
0.48
0.02
OECD Countries
20
33.34
1.92
2.08
0.04
0.54
0.01
Developing Countries of which: Take-Off Countries
32
43.68
3.17
3.65
0.03
0.45
0.05
10
40.31
2.87
2.63
0.04
0.47
0.02
Other Developing
22
45.21
3.31
4.00
0.05
0.43
0.03
Table 2
Correlation Matrix of Basic Regressors GNS/GNP
GNS/GNP Per Capita GNP Growth rate of Per Capita GNP Gini coefficient Income share of top 20%/bottom 40% Income share of middle 60% Old age dependency ratio Young age dependency ratio
0.311 0.632 -0.278 -0.277 0.335 0.177 -0.394
Per Capita Growth rate of Gini GNP Per Capita GNP coefficient
-0.001 -0.551 -0.469 0.652 0.860 -0.872
-0.238 -0.233 0.204 -0.012 -0.211
0.951 -0.957 -0.627 0.683
Income share of top2O/bot4O
-0.919 -0.536 0.603
Income share Old age of middle 60 dependency ratio
0.705 -0.763
-0.933
Table 3 Cross-SectionEstimatesof Saving Equations DependentVariable:GNS/GNP (t-statisticsin parentheses) Equation
2
3
4
5
6
7
Sample
Full
Full
OECD
LDC
Full
OECD
LDC
Constant
36.506 (2.762)
36.055 (2.666)
28.209 (1.261)
39.844 (2.149)
37.632 (2.708)
30.999 (1.348)
41.447 (2.144)
32.57 (2.155)
52.299 (2.616)
Real GNPper capita (1987constantdollar)
0.001 (1.736)
0.001 (1.667)
0.002 (1.906)
0.004 (1.151)
0.001 (1.375)
0.001 (1.196)
0.004 (1.054)
0.002 (2.165)
0.011 (2.070)
Real GNPpercapita squared Real GNPgrowthrate
Old agedependencyratio Youngage dependency ratio
Full W/o Take- LDCw/o TakeOff Countries Off Countries
-5.67E-08 -5.5E-08 -7.22E-08-3.26E-07-4.20E-08-4.61E-08-4.13E-07 -7.96E-08 (-1.903) (-1.429) (-1.376) (-1.603) (-0.727) (-0.979) (-0.823) (-0.730)
-1.84E-06 (-1.475)
1.479
1.495
3.265
1.074
1.502
3.202
1.107
0.923
0.341
(3.055)
(3.042)
(2.757)
(1.779)
(2.843)
(2.687)
(1.738)
(1.308)
(0.729)
-1.258
-1.253
-0.927
-1.36
-1.271
-0.878
-1.671
-1.188
-2.742
(-2.643)
(-2.618)
(-1.490)
(-1.061)
(-2.522)
(-1.452)
(-1.106)
(-2.055)
(-1.819)
-0.413 (-1.620)
-0.439 (1.672)
-0.647 (-1.218)
-0.402 (-1.143)
-0.425 (-1.521)
-0.593 (-1.219)
-0.455 (-1.202)
-0.426 (-1.503)
-0.518 (-1.631)
Gini coefficient
0.035
0.105
-0.095
0.094
-0.238
(0.381)
(0.982)
(-0.734)
(1.054)
(-1.613)
0.455 3.681 42
0.413 3.458 22
Incomeshareratio of top 20%/bottom40%
AdjustedR2 StandardError Numberof Observations
8
9
1
0.528 3.875 52
0.520 3.912 52
0.539 2.691 20
0.511 4.446 32
-0.019 (4.033)
0.222 (0.165)
-0.649 (-0.921)
0.506 4.092 45
0.525 2.817 18
0.497 4.742 27
standarderrors. Note:The abovet-statisticswere computedusingheteroskedasticity-corrected
c
29 Table4 Cross-SectionEstimatesof Saving Equations DependentVariable:GNSIGNP (t-statisticsin parentheses) Equation Sample
Constant Real GNP per capita (1987 constantdollar) Real GNP per capita squared
1 Full
2 Full
3 Full
4 Full
5 Full
6 Full
38.740 (2.654) 0.001 (0.517)
23.249 (1.480) 0.001 (1.614)
41.816 (2.709) 0.001 (1.211)
33.354 (2.425) 0.002 (2.032)
35.140 (2.061) 0.001 (1.402)
27.395 (1.170) 0.001 (1.251)
-5.33E-08 -5.63E-08 -3.76E-08 -6.99E-08 -4.22E-08 -3.84E-08 (-1.334) (-1.377) (-0.933) (-1.734) (-0.995) (1.251)
Real GNP growthrate
1.420 (2.710)
1.453 (2.912)
1.291 (2.429)
1.234 (2.065)
1.497 (2.817)
1.504 (2.765)
Old age dependencyratio
-1.241 (-2.556)
-1.256 (-2.591)
-1.349 (-2.638)
-0.997 (-2.002)
-1.273 (-2.498)
-1.287 (-2.471)
Youngage dependencyratio
-0.444 (-1.656)
-0.484 (-1.794)
-0.455 (-1.655)
-0.485 (-1.736)
-0.407 (-1.445)
-0.411 (-1.439)
Gini coefficient
-0.024 (-0.180)
0.763 (1.541)
-0.032 (-0.347)
0.022 (0.191)
Incomeshareratio of top 20% I bottom 40%
0.548 (0.526)
Incomeshareof middle 60% GNP variability Multiplicationof GNP and Gini coefficient
0.173 (0.526)
0.507 4.089 45
0.496 4.134 45
-16.185 (-1.317) 2.15E-05 (1.099)
Gini coefficientsquared
-0.009 (-1.410)
Latin Americaregional dummy
4.413 (1.129) 3.975 (1.001)
Africa regionaldummy Asia regionaldummy
AdjustedR2 StandardError Numberof Observations
0.038 (0.218)
5.164 (1.403)
0.516 3.925 52
0.520 3.911 52
0.535 3.848 52
0.508 3.960 52
Note:The abovet-statistics were computedusing heteroskedasticity-corrected standarderrors.
Table 6 Cross-SectionEstimatesof Saving Equations DependentVariable:GDS/GDP (t-statisticsin parentheses) Equation 3 Full
4 Full
5 Full
a Full
28.699 (1.857) 0.002 (2.792)
40.523 (2.305) 0.002 (1.199)
34.594 (2.116) 0.003 (2.897)
41.524 (2.558) 0.002 (1.965)
-5.58E-07 (-1.198) -0.213 (-0.251)
-8.44E-08 (-2.008) 0.582 (1.003)
-7.81E-08 (-1.777) 0.385 (0.558)
-1.695 (-3.256)
-1.791 (-1.121)
-1.574 (-3.121)
-1.688 (-3.219)
-1.03E-07 (-2.304) 0.130 (0.163) -1.196 (-2.144)
-6.49E-08 (-1.353) 0.447 (0.688) -1.695 (-3.026)
-0.548 (-1.812)
-0.716 (-1.589)
-0.359 (-1.210)
-0.552 (-1.780)
-0.644 (-2.000)
-0.480 (-1.443)
0.149 (1.368) Incomeshareratio of top 20%/ bottom 40%
0.012 (0.087)
0.134 (1.219)
0.117 (0.7340)
0.097 (0.673)
1 Full
2 LDC
39.011 (2.444) 0.002 (2.260)
51.769 (2.158) 0.005 (1.615)
-7.94E-08 (-1.822) 0.430 (0.664)
Old age dependencyratio Youngage dependencyratio
Sample Constant Real GDP per capita (1987 constantdollar) Real GDP per capita squared Real GDP growthrate
Gini coefficient
0.546 (0.726) 14.945 (1.760)
GDPvariability
1.16E-05 (0.483)
Multiplicationof GDP and Gini coefficient Latin America regionaldummy
9.324 (2.337)
Africa regionaldummy
8.848 (1.952)
Asia regionaldummy
9.176 (2.540)
0.355 4.770 52
AdjustedR2 StandardError Numberof Observations
Nnta
Tha nhnva tLctnatitfirc
waro rnmnijfM
0.323 5.447 32
aicinn hn*o,nok*,4aetipiij
0.385 4.656 52
rrt_
0.342 4.816 52
e4.A,-A
£rrnr.
0.373 4.704 52
0.290 5.013 45
o
Figure 1
LONG-TERM WORLD SAVING AND INCOME LEVEL (Gross National Saving Rate Including Net Current Transfers and Real GNP Per Capita, 1965- 94 Averages, by Countries) _ .10
35 30
25
20A
10 I
O.
II
I-
2 y -9E-08x +0.0016x + 17.967 2- 0.1806
0
2000
4000
6000
8000
10000
12000
Averge Real GNP Per C$ap
| LDC (excl.Take-OffCouniries) *Take-Offcountnes AOECD:|
14000
16000
Figure 2
LONG-TERM WORLD SAVING AND INCOME GROWTH (Gross National Saving Rate Including Net Current Transfers and Growth Rate of Real GNP Per Capita, 1965-94 Averages,by Countries) 35
30
A
23
z L*
y
-2
-1
0
1
2
3
4
5
6
Average Growth Rate of Real GNP Per Capita
*LDC (excl.Take-OffCountries) mTake-Offcountries AOECD
7
5 2.0 73x + 16.034 2 R = 0.3779
8
9
Figure 3
LONG-TERM WORLD SAVINGANDINCOME DISTRIBUTION (Gross National Saving Rate Including Net Current TRansfers and Gini Coefficient, 1965-94Averages, by Countries) 35 A 30 25
U
U
*
AA
A
*
20
.
15. 10
|.
D
ec.Tk@fonres
aeOfonnsOC
U
5 0 25
30
35
40
45
50
Average Gili Coeffideut
*LDC(excl.Take-OffCountries)u Take-off countriesA OECD
55
60
Figure 4
LONG-TERM WORLD INCOME DISTRIBUTION AND DEVELOPMENT (Gini Coefficientand Log of Average GNP Per Capita, 1965- 94 Averages,by Countries) 60
-
--
y -2.1861x2 + 30.807x- 63.211
* 55 -
R =0.4292
50
.;45
j40 35
30A
a
25
20
A
I 4.5
5.5
6.5
7.5
l 8.5
Log of Average GNPPer Capita
* LDC(excl.Take-OffCountries) * Take-OffcountriesA OECD
9.5
10.5
Figre 5
LONG-TERM WORLD INCOME DISTRIBUTION MEASURES (GiniCoefficient and Ratio of Income of Top 20% to Bottom 40% of Population, 1965-94Averages, by Countries) 60 55
-
50 45
U
40 35 30 -a
25
1
A
2
3
4
5
6
Average IncomeRatioof Top 20%to Botom 40%
F*LDC(excl.Take-OffCountires) a Take-Offcountries AOECD7
7
8
I
Policy Research Working Paper Series
Title
Contact for paper
Author
Date
WPS1545 International Commodity Control: Retrospect and Prospect
Christopher L. Gilbert
November 1995
G. Ilogon 33732
WPS1546 Concessions of Busways to the Private Sector: The Sao Paulo Metropolitan Region Experience
Jorge M. Rebelo Pedro P. Benvenuto
November 1995
A. Turner 30933
WPS1547 Testing the Induced Innovation Hypothesis in South African Agriculture (An Error Correction Approach
Colin Thirtle Robert Townsend Johan van Zyl
November 1995
M. Williams 87297
WPS1 548 The Relationship Between Farm Size Johan van Zyl and Efficiency in South African Hans Binswanger Agriculture Colin Thirtle
November 1995
M. Williams 87297
WPS1549 The ForgoKtenRationale for Policy Reform: The Productivity of Investment Projects
Jonathan Isham Daniel Kaufman
November 1995
S. Torres 39012
WPS1550 Governance and Returns on Investment: An Empirical Investigation
Jonathan Isham Daniel Kaufman Lant Pritchett
November 1995
S. Fallon 38009
WPS1551 Sequencing Social Security, Pension, and Insurance Reform
Dimitri Vittas
December 1995
P. Infante 37642
WPS1552 Unemployment Insurance and Milan Vodopivec Duration of Unemployment: Evidence from Slovenia's Transition
December 1995
J. Walker 37466
WPS1553 Spatial Correlations in Panel Data
John Driscoll Aart Kraay
December 1995
R. Martin 39065
WPS1554 Rationing Can Backfire: The "Day without a Car" in Mexico City
GunnarS. Eskeland Tarhan Feyzioglu
December 1995
C. Bernardo 37699
WPS1555 Capital Markets, Financial Roland Egerer Intermediaries, and Corporate Governance: An Empirical Assessment of the Top Ten Voucher Funds in the Czech Republic
December 1995
D. Brown 33542
WPS1 556 Workers in Transition
Michal Rutkowski
December 1995
WDR 31393
WPS1 557 Electricity Demand in Asia and the Effects on Energy Supply and the Investment Environment
Masayasu Ishiguro Takamasa Akiyama
December 1995
G. Ilogon 33732
Policy Research Working Paper Series Contact for paper
Author
Date
WPS1558 In Search of Price Rigidities (Recent Sector Evidence from Argentina
Jacques Morisset
December 1995
N. Cuellar 37892
WPS1559 Have Transport Costs Contributed to the Relative Decline of SubSaharan African Exports? Some Preliminary Empirical Evidence
Azita Amjadi Alexander J. Yeats
December 1995
S. Lipscomb 33718
WPS1560 Trade and Fluctuations
Aart Kraay Jaume Ventura
December 1995
R. Martin 39065
January 1996
E. Khine 37471
Title
WPS1561 Income Inequality and Aggregate Klaus Schmidt-Hebbel Saving: The Cross-Country Evidence Luis Serven