VOLUME: 15 | NUMBER: 3 | 2017 | SEPTEMBER
DIGITAL IMAGE PROCESSING AND COMPUTER GRAPHICS
Animal Recognition System Based on Convolutional Neural Network Tibor TRNOVSZKY, Patrik KAMENCAY, Richard ORJESEK, Miroslav BENCO, Peter SYKORA Department of multimedia and information-communication technologies, Faculty of Electrical Engineering, University of Zilina, Univerzitna 8215/1, 010 26 Zilina, Slovakia
[email protected],
[email protected],
[email protected],
[email protected],
[email protected] DOI: 10.15598/aeee.v15i3.2202
Abstract. In this paper, the Convolutional Neural Network (CNN) for the classification of the input animal images is proposed. This method is compared with well-known image recognition methods such as Principal Component Analysis (PCA), Linear Discriminant Analysis (LDA), Local Binary Patterns Histograms (LBPH) and Support Vector Machine (SVM). The main goal is to compare the overall recognition accuracy of the PCA, LDA, LBPH and SVM with proposed CNN method. For the experiments, the database of wild animals is created. This database consists of 500 different subjects (5 classes / 100 images for each class). The overall performances were obtained using different number of training images and test images. The experimental results show that the proposed method has a positive effect on overall animal recognition performance and outperforms other examined methods.
Keywords Animal recognition system, LBPH, neural networks, PCA, SVM.
1.
Introduction
Currently, the animal detection and recognition are still a difficult challenge and there is no unique method that provides a robust and efficient solution to all situations. Generally, the animal detection algorithms implement animal detection as a binary pattern classification task [1]. That means, that given an input image, it is divided in blocks and each block is transformed into a feature. Features from the animal that belongs to a certain class are used to train a certain
classifier. Then, when given a new input image, the classifier will be able to decide if the sample is the animal or not. The animal recognition system can be divided into the following basic applications: • Identification - compares the given animal image to all the other animals in the database and gives a ranked list of matches (one-to-N matching). • Verification (authentication) - compares the given animal image and involves confirming or denying the identity of found animal (one-to-one matching). While verification and identification often share the same classification algorithms, both modes target distinct applications [1]. In order to better understand the animal detection and recognition task and its difficulties, the following factors must be taken into account, because they can cause serious performance degradation in animal detection and recognition systems: • Illumination and other image acquisition conditions - the input animal image can be affected by factors such as illumination variations, in its source distribution and intensity or camera features such as sensor response and lenses. • Occlusions - the animal images can be partially occluded by other objects and by other animals. The outline of this paper is organized as follows. The Sec. 2. gives brief overview of the state-of-the-art in object recognition. In the Sec. 3. , the animal recognition system based on feature extraction and classification is discussed. The obtained experimental results are listed in Sec. 4. Finally, the Sec. 5. concludes and suggests the future work.
c 2017 ADVANCES IN ELECTRICAL AND ELECTRONIC ENGINEERING
517
VOLUME: 15 | NUMBER: 3 | 2017 | SEPTEMBER
DIGITAL IMAGE PROCESSING AND COMPUTER GRAPHICS
2.
State of the Art
to minimize the effect of factors that can adversely influence the animal recognition algorithm.
In [2], an object recognition approach based on CNN • The feature extraction block - in this step the feais proposed. The proposed RGB-D (combination of tures used in the recognition phase are computed. a RGB image and its corresponding depth image) architecture for object recognition consists of two sepa• The learning algorithm (classification) - this algorate CNN processing streams, which are consecutively rithm builds predictive model from training data combined with a late fusion network. The CNNs are that have features and class labels. These predicpre-trained by ImageNet [3]. Depth images are entive models use the features learnt from the traincoded as a rendered RGB images, spreading the ining data on the new (previously unseen) data to formation contained in the depth data over all three estimate their class labels. The output classes are RGB channels, and then a standard (pre-trained) CNN discrete. Types of classification algorithms include is used for recognition. Due to lack of large scale ladecision trees, Support Vector Machines (SVM) belled depth datasets, CNNs pre-trained on ImageNet and many more. [4] are used. A novel data augmentation that aims at improving recognition in noisy real-world setups is proInterestingly, many traditional computer vision imposed. The approach is experimentally evaluated using two datasets: Washington RGB-D Object Dataset and age classification algorithms follow this pipeline (see Fig. 1), while Deep Learning based algorithms bypass RGB-D Scenes dataset [5]. the feature extraction step completely. Another object recognition approach, which uses In all our experiments, the feature extraction (PCA, deep CNN, is proposed in [6]. It also uses CNN, which LDA and LBPH) and classifications (SVM and prois pre-trained for image categorization and provide a posed CNN) methods will be used to estimate test anrich, semantically meaningful feature set. The depth imal images (fox, wolf, bear, hog and deer). information is incorporated by rendering objects from a canonical perspective and colorizing the depth channel according to distance from the object centre.
3.1.
3.
Principal Component Analysis
Animal Recognition System
Start
The image recognition algorithm (image classifier) takes the image (or a patch of the image) as input and outputs what the image contains. In other words, the output is a class label (fox, wolf, bear etc.).
Test image
Training part
Covariance matrix
Eigen vector
Eigen matrix
ANIMAL RECOGNITION Feature Classification extraction �PCA �SVM �LDA �CNN �LBPH
Testing part
information of the testing image
Train set
Image pre-processing
Pre-processing (observation and feature matrix)
Test observation vector
Transformed vector matrix
Euclidian distance
Test set
Recognition results
Retrieved image
Stop
Fig. 1: The animal recognition and classification system.
Fig. 2: Block diagram of a PCA algorithm.
The animal recognition system (see Fig. 1) is divided into following steps: The Principal Components Analysis (PCA) is • The pre-processing block - the input image can be a variable-reduction technique used to emphasize varitreated with a series of pre-processing techniques ation and bring out strong patterns in a dataset. The
c 2017 ADVANCES IN ELECTRICAL AND ELECTRONIC ENGINEERING
518
VOLUME: 15 | NUMBER: 3 | 2017 | SEPTEMBER
DIGITAL IMAGE PROCESSING AND COMPUTER GRAPHICS
Testing part
main idea of the PCA is to reduce a larger set of variables into a smaller set of „artificial“ variables, called „principal components“, which account for most of the variance in the original variables (see Fig. 2) [7] and [8].
Input test image
Feature selection
Square distance to match animal in database
The general steps for performing a Principal Component Analysis (PCA): Information of the testing image
• Take the whole dataset consisting of d-dimensional samples ignoring the class labels.
Compare information
Information of the matched animal in the database
Training part
• Compute the d-dimensional mean vector (i.e., the means for every dimension of the whole dataset). • Compute the scatter matrix (alternatively, the covariance matrix) of the whole data set. • Compute eigenvectors (e1 , e2 , e3 , e4 , e5 ,...,ed ) and corresponding eigenvalues (λ1 , λ2 , λ3 , λ4 , λ5 ,...,λd ). • Sort the eigenvectors by decreasing eigenvalues and choose k eigenvectors with the largest eigenvalues to form a d × k dimensional matrix W (where every column represents an eigenvector). • Use this d × k eigenvector matrix to transform the samples into the new subspace. This can be summarized by the mathematical equation: y = WT × x,
(1)
where ~x is a d × 1 dimensional vector representing one sample, and y is the transformed k × 1 dimensional sample in the new subspace. PCA finds a linear projection of high dimensional data into a lower dimensional subspace such as:
Fig. 3: Block diagram of a LDA algorithm.
The general steps for performing a Linear Discriminant Analysis (LDA) are: • Compute the d dimensional mean vectors for the different classes from the dataset. • Compute the scatter matrices. • Compute the eigenvectors (e1 , e2 ,...,ed ) and corresponding eigenvalues (λ1 , λ2 ,...,λd ) for the scatter matrices. • Sort the eigenvectors by decreasing eigenvalues and choose k eigenvectors with the largest eigenvalues to form a d × k dimensional matrix W (where every column represents an eigenvector). • Use this d × k eigenvector matrix to transform the samples into the new subspace. This can be summarized by the matrix multiplication: Y = X × W,
• The variance retained is maximized (maximizes variance of projected data).
(2)
where X is a n×d dimensional matrix representing the n samples, and Y are the transformed n × k dimensional samples in the new subspace.
• The least square reconstruction error is minimized (minimizes mean squared distance between data point). The general LDA approach is similar to a Principal Component Analysis (see Fig. 3) [8] and [9].
3.2.
Linear Discriminant Analysis
Linear Discriminant Analysis (LDA) is most commonly used as dimensionality reduction technique in the preprocessing step for pattern classification and machine learning applications (see Fig. 3). The goal is to project a dataset into a lower dimensional space with better class separability in order to avoid overfitting and also reduce computational costs [8].
3.3.
LBP Approach to Animal Recognition
The LBPH method takes a different approach than the eigenfaces method (PCA, LDA). In LBPH, each image is analyzed independently, while the eigenfaces method looks at the dataset as a whole.
c 2017 ADVANCES IN ELECTRICAL AND ELECTRONIC ENGINEERING
519
VOLUME: 15 | NUMBER: 3 | 2017 | SEPTEMBER
DIGITAL IMAGE PROCESSING AND COMPUTER GRAPHICS
a)
1600
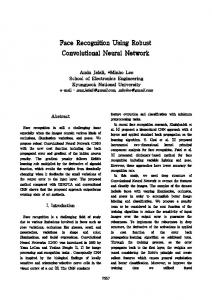
The basic idea of Local Binary Patterns is to summarize the local structure in a block by comparing each pixel with its neighborhood [10]. Each pixel is coded with a sequence of bits, each of them is associated with the relation between the pixel and one of its neighbors. If the intensity of the center pixel is greater than or equal to its neighbor, then it is denoted with 1. It is denoted 0 if this condition is not met (see Fig. 5). Finally, a binary number (Local Binary Pattern or LBP code) is created for each pixel (just like 01111100). If 8-connectivity is considered, we will end up with 256 combinations [10] and [11]. The LBP operator (used a fixed 3x3 neighbourhood) is shown in Fig. 5.
b)
1200 800 400 0
50
100
c)
150
200
250
Training stage (see Fig. 6) looks as follows. Animals and training samples are introduced in the system, and feature vectors are calculated and later concatenated in a unique Enhanced Features Vector to describe each animal image sample. Then, all these results are used to generate a mean value model for each class [11].
Fig. 4: Local binary patterns of the training dataset: a) input image, b) local binary pattern, c) histogram. LBP (3x3 blocks)
Input Training images
The LBPH method is somewhat simpler, in the sense that we characterize each image in the dataset locally and when a new unknown image is provided, we perform the same analysis on it and compare the result to each of the images in the dataset. The way, which is used for image analysis, does so by characterizing the local patterns in each location of the image. This histogram based approach (see Fig. 4) defines a feature, which is invariant to illumination and contrast [10].
Features extraction and concatenation
Training stage
Models (animal)
Input Test images
Animal candidate? No
Yes
Classification stage LBP (3x3 blocks)
Non-Animal
Animal?
Yes
No
Non-Animal
Animal
Fig. 6: Block diagram of a LBP algorithm.
Test stage (see Fig. 6) on the other hand looks as follows. For each new test image, segmentation preprocessing is applied first to improve animal detection efficiency. Then the result feeds classification stage. Just test images with positive results in classification stage are classified as animals [11].
(0 1 1 1 1 1 0 0) = 124
0
1
1
0 0
1
1
1
Threshold
44
118
192
32
83
204
61
174
250
Binary: 0 1 1 1 1 1 0 0 Decimal: 124 Fig. 5: Example of a LBP calculation (feature extraction).
3.4.
Support Vector Machine
The Support Vector Machine (SVM) is a classification method that samples hyperplanes, which separate two or multiple classes (see Fig. 7). Eventually, the hyperplane with the highest margin is retained, where “margin” is defined as the minimum distance from sample points to the hyperplane. The sample points that form margin are called support vectors and establish the final SVM model [12] and [13].
c 2017 ADVANCES IN ELECTRICAL AND ELECTRONIC ENGINEERING
520
VOLUME: 15 | NUMBER: 3 | 2017 | SEPTEMBER
DIGITAL IMAGE PROCESSING AND COMPUTER GRAPHICS
Class 1
Feature space
Class 2 Max(1, 1, 5, 6) = 6
Non-support vector:
y
Support vector:
1
1
2
4
5
6
7
8
3
2
1
0
1
2
3
4
x max pool with 2x2 filters
6
8
3
4
y Rectified feature map
x
Fig. 7: Boundary searched by the SVM. Fig. 9: Max Pooling operation on feature map (2×2 window).
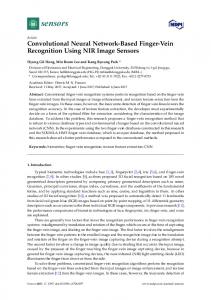
Hyper-parameters are the parameters of a classifier These operations are the basic building blocks of that are not directly learned in the learning step from every Convolutional Neural Network, so understandthe training data but are optimized separately. The ing how these work is an important step to developing goals of hyper-parameter optimization are to improve a sound understanding of ConvNets [14], [15] and [16]. the performance of a classifier and to achieve good generalization of a learning algorithm [13].
3.5.
Convolutional Neural Network
The Convolutional Neural Networks (CNNs) are a category of Neural Networks that have proven effective in areas such as image recognition and classification. CNN have been successful in identifying animals, faces, objects and traffic signs apart from powering vision in robots and self-driving cars [14]. Convolution + ReLU
Pooling
Convolution + ReLU
Pooling
Fully Connected
Fully Connected
Output
4.
Experiments and Results
In this section, we will evaluate the performance of our proposed method on created animal database. In all our experiments, all animal images were aligned and normalized based on the positions of animal eyes. All tested methods (PCA, LDA, LBPH, SVM and proposed CNN) were implemented in MATLAB and C++/Python programming language.
4.1.
Animal Dataset
Fig. 8: Example of convolutional neural networks.
The Convolutional Neural Network (see Fig. 8) is similar in architecture to the original LeNet (Convolutional Neural Network in Python) and classifies an input image into categories: fox, wolf, bear, hog or deer (the original LeNet was used mainly for character recognition tasks) [15]. As it is evident from the figure above with a fox image as input, the network correctly assigns the probability for fox among all five categories. There are four main operations in the CNN: • Convolution. Fig. 10: The example of the created animal database.
• Non Linearity (ReLU). • Pooling or Sub-Sampling (see Fig. 9). • Classification (Fully Connected Layer).
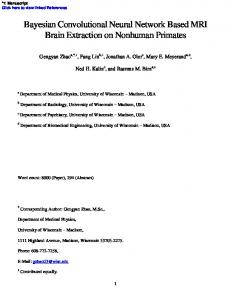
The created animal database includes five classes of animals (fox, wolf, bear, hog and deer). Each animal has 100 different images. In total, there are 500 animal
c 2017 ADVANCES IN ELECTRICAL AND ELECTRONIC ENGINEERING
521
VOLUME: 15 | NUMBER: 3 | 2017 | SEPTEMBER
DIGITAL IMAGE PROCESSING AND COMPUTER GRAPHICS
images. The Fig. 10 shows 20 images from the cre- hanced feature vector is obtained by concatenating the ated animal database. The size of each animal image histograms, not merging them. In our experiments, the is 150×150 pixels. SVM classifier used two data types. To create a classification model, training data are used. To test and There are variations in different illumination conevaluate trained model accuracy, testing data are used. ditions. All the images in the created database were taken in the frontal position with tolerance for some The proposal of the Convolutional Neural Network side movements. There are also some animal images (CNN) is shown in Fig. 11. The input image contains with variations in scale. The successful animal recog- 1024 pixels (32×32 image). The convolutional layer 1 nition depends strongly on the quality of the image is followed by Pooling Layer 1. dataset. Input 32x32x3
4.2.
Experiments
A)
2D CNN 16, 3x3, L2, Relu B)
MaxPool 2x2 Dropout 0.25 C)
2D CNN 32, 3x3 L2, Relu
Dense 256 Relu L2
Dense 5 Output Softmax
D) MaxPool 2x2 Dropout 0.25
. . .
Dropout Results A series of all our experiments for 40, 50, 60, 70, 80 0.25 and 90 training images were done. Training database E) F) G) H) consisted of five classes (fox, wolf, bear, hog and deer). The example of input images from the train- Fig. 11: Block diagram of the proposed CNN. ing database is shown in Fig. 10. All tested methods follow the principle scheme of the image recognition This convolutional network is divided into 8 blocks: process (see Fig. 1). Training images and test images as a vector were transformed and stored. These im• A) As input data were used our animal faces from ages formed the whole created animal database (see dataset. Each animal face was resized into 32×32 Fig. 10). To the designation of feature vector the Eupixels to improve the computation time. The inclidean distance was used (accuracy of animal recogniput database has been expanded to provide the tion algorithm between the test images and all training better experimental results. This means that the images). The obtained results can be seen in Tab. 1. input data were scaled, rotated and shifted. In order to evaluate the effectiveness of our pro• B) The second block is 2D CNN layer, which posed algorithm we compared the animal recognition has 16 feature maps with 3×3 kernel dimension. rate of our proposed CNN with 4 algorithms (PCA, L2 regularization was used due to small dataset. LDA, LBPH, and SVM). After the system was trained As an activation function, Rectifier linear unit by the training data, the feature space „eigenfaces“ (ReLU) was used. through PCA, the feature space „fisherfaces“ through LDA were found using respective methods. Eigenfaces • C) In this layer the kernel with dimension 2×2 was and Fisherfaces treat the visual features as a vector in used and output was dropped out with probability a high-dimensional image space. Working with high 0.25. It is because we tried to prevent our NN from dimensions was costly and unnecessary in this case, overfitting. so a lower-dimensional subspace was identified, try• D) The second 2D CNN was used with same paing to preserve the useful information. The Eigenrameters as first one, but amount of feature maps faces method is a holistic approach to face recognition. was doubled to 32. This approach maximizes the total scatter, but it was a problem in our scenario because the detection al• E) The MaxPooling layer and Dropout with the gorithm may have generated animal images with high same value as in block C were used (see Fig. 11). variance due to the lack of supervision in the detection. • F) As the next layer, standard dense layer was Although Fisherfaces method can preserve discriminaused. It had 256 neurons and as activation functive information with Linear Discriminant Analysis, tion Relu was used. The L2 regularization was this assumption basically applies for constrained sceused to better control of weights. narios. Our detected animal images are not perfect, light and position settings cannot be guaranteed. Un• G) Dropout function was set to 0.25. like Eigenfaces and Fisherfaces, Local Binary Patterns Histograms (LBPH) extract local features of the object • H) As the output dense layer with 5 classes and and have its roots in 2D texture analysis. The spatial softmax activation function was used. information must be incorporated in the animal recogIn the proposed CNN (see Fig. 11), the pooling opernition model. The proposal in MATLAB is to divide the LBP image into 8×8 local regions using a grid and ation is applied separately to each feature map. In genextract a histogram from each. Then, the spatially en- eral, the more convolutional steps we have, the more
c 2017 ADVANCES IN ELECTRICAL AND ELECTRONIC ENGINEERING
522
VOLUME: 15 | NUMBER: 3 | 2017 | SEPTEMBER
DIGITAL IMAGE PROCESSING AND COMPUTER GRAPHICS
complex features (such as edges) it is possible to recognize using proposed network. The whole process is repeated in successive layers until the system can reliably recognize objects. For example, in image classification a CNN may learn to detect edges from raw pixels in the first layer, then use the edges to detect simple shapes in the second layer, and then use these shapes to determine higher-level features, such as facial shapes in higher layers.
images and 40 % test images. The following part consists of 50 % training images and 50 % test images. Finally, the last part of our experiments consists of 40 % training images and 60 % test images. The ratio of test data and training data (test: training): • A – 10:90 (90 % of the data was used for training),
Pooling
ReLU
Convolutional
ReLU
Pooling
Convolutional
Pooling
ReLU
Convolutional
• B – 20:80 (80 % of the data was used for training), • C – 30:70 (70 % of the data was used for training), • D – 40:60 (60 % of the data was used for training), • E – 50:50 (50 % of the data was used for training),
Input image
• F – 60:40 (40 % of the data was used for training). deer
hog
bear
fox
wolf
Results
The best recognition rate (accuracy of 98 %) using proposed CNN for the first part of our performed experiments (A – 90 % training images and 10 % test images) was achieved. On the other hand, the worst The neurons in each layer of the CNN (see Fig. 12) recognition rate (accuracy of 78 %) for the sixth part are arranged in a 3D manner, transforming a 3D in- of our experiments (F – 40 % training images and 60 % put to a 3D output. For example, for an image input, test images) was obtained. the first layer (input layer) holds the images as 3D inputs, with the dimensions being height, width, and the Tab. 1: The animal recognition rate for different number of subjects. colour channels of the image. The neurons in the first convolutional layer connect to the regions of these imRatio of test/training animal data ages and transform them into a 3D output. The hidden A B C D E F 85 77 72 64 62 61 PCA (%) units (neurons) in each layer learn nonlinear combina80 70 65 63 61 60 LDA (%) tions of the original inputs (feature extraction). These 88 84 76 73 71 67 LBPH (%) learned features, also known as activations, from one 83 74 70 68 66 64 SVM (%) layer become the inputs for the next layer. Finally, the Proposed 98 92 90 89 88 78 CNN (%) learned features become the inputs to the classifier or the regression function at the end of the network [17]. Table 2 displays the confusion matrix for the proposed CNN, constructed using pre-labelled input images from created animal dataset. Using 500 test 4.3. Results images, each row corresponds to the image classes The obtained experimental results will be presented in (5 classes/100 images for each class), specified by the this section. The first row in Tab. 1 presents recogni- created animal dataset (target class). The columns tion accuracy using PCA algorithm. The second row indicate the number of times an image, with known (see Tab. 1) presents recognition accuracy using LDA image class, was classified as certain class (predicted algorithm. The overall accuracy of the LBPH algo- class). rithm is described in third row. The experimental results obtained using SVM are described in the next Tab. 2: The confusion matrix by the proposed CNN method. row of the Tab. 1. The last row of the Tab. 1 describes Predicted class Classifithe experimental results of the proposed CNN method cation bear hog deer fox wolf rate (overall recognition accuracy). The all obtained experbear 97 3 0 0 0 0.97 imental results are divided into six main parts (A, B, hog 4 91 3 0 2 0.91 C, D, E, and F). The first part of our performed exdeer 3 4 93 0 0 0.93 periments consists of 90 % training images and 10 % fox 0 0 2 95 3 0.95 wolf 0 0 0 5 95 0.95 test images. The second part consists of 80 % training images and 20 % test images. The third part of our The cells along the diagonal (green colour) in Tab. 2, experiments consists of 70 % training images and 30 % test images. The next part consists of 60 % training represent images which were correctly classified to be Target class
Fig. 12: The example of layers of the proposed CNN.
c 2017 ADVANCES IN ELECTRICAL AND ELECTRONIC ENGINEERING
523
VOLUME: 15 | NUMBER: 3 | 2017 | SEPTEMBER
DIGITAL IMAGE PROCESSING AND COMPUTER GRAPHICS
the same class as their pre-labelled image class. Using the correctly classified images, it is possible to determine the classification accuracy. The classification accuracy of the neural network across all classes as the ratio of the sum of the correctly labelled images (green colour) to the total number of images in the test set (500 images) was calculated (accuracy of 94.2 %).
mance of classifier using combination of local descriptors. Future works can also include experiments with this method on other animal databases.
Acknowledgment
In the Tab. 3, the overall accuracy of correctly idenThis publication is the result of the project implementified animals for each class (fox, wolf, bear, hog and tation: Centre of excellence for systems and services of deer) using PCA, LDA, LBPH, SVM and proposed intelligent transport, ITMS 26220120028 supported by CNN is shown. the Research & Development Operational Programme Tab. 3: The accuracy of correctly identified animals for each funded by the ERDF. class.
PCA (%) LDA (%) LBPH (%) SVM (%) Proposed CNN (%)
Bear 82 81 85 87
Wolf 79 77 87 864
Fox 78 78 83 85
Deer 76 81 84 83
Hog 82 83 82 81
97
95
95
93
91
The best precision (accuracy of 97 %) using proposed CNN was obtained for the bear class (see Tab. 3). On the other hand, the worst results (accuracy of 76 %) using PCA algorithm was obtained for the deer class.
5.
Conclusion
The paper presents a proposed CNN in comparison with the well-known algorithms for the image recognition, feature extraction and image classification (PCA, LDA, SVM and LBPH). The proposed CNN was evaluated on the created animal database. The overall performances were obtained using different number of training images and test images. The experimental result shows that the LBPH algorithm provides better results than PCA, LDA and SVM for large training set. On the other hand, SVM is better than PCA and LDA for small training data set. The best experimental results of animal recognition were obtained using the proposed CNN. The obtained experimental results of the performed experiments show that the proposed CNN gives the best recognition rate for a greater number of input training images (accuracy of about 98 %). When the image is divided into more windows the classification results should be better. On the other hand, the computation complexity will increase. In the future work, we plan to perform experiments and also tests of more complex algorithms with aim to compare the presented approaches (PCA, LDA, SVM and LBPH) with other existing algorithms (deep learning). We are also planning to investigate reliability of the presented methods by involving larger databases of animal images. Next, we need to improve the perfor-
References [1] XIE, Z., A. SINGH, J. UANG, K. S. NARAYAN and P. ABBEEL. Multimodal blending for high-accuracy instance recognition. In: 2013 IEEE/RSJ International Conference on Intelligent Robots and Systems. Tokyo: IEEE, 2013, pp. 2214–2221. ISBN 978-1-4673-6356-3. DOI: 10.1109/IROS.2013.6696666. [2] EITEL, A., J. T. SPRINGENBERG, L. D. SPINELLO, M. RIEDMILLER and W. BURGARD. Multimodal Deep Learning for Robust RGB-D Object Recognition. In: 2015 IEEE/RSJ, International Conference on Intelligent Robots and Systems (IROS). Hamburg: IEEE, 2015, pp. 681–687. ISBN 978-1-4799-99941. DOI: 10.1109/IROS.2015.7353446. [3] RUSSAKOVSKY, O., J. DENG, H. SU, J. KRAUSE, S. SATHEESH, S. MA, Z. HUANG, A. KARPATHY, A. KHOSLA, M. BERNSTEIN, A. C. BERG and L. FEI-FEI. ImageNet Large Scale Visual Recognition Challenge. International Journal of Computer Vision (IJCV). 2015, vol. 115, no. 3, pp. 211–252. ISSN 1573-1405. DOI: 10.1007/s11263-015-0816-y. [4] KRIZHEVSKY, A., I. SUTSKEVER and G. E. HINTON. ImageNet classification with deep convolutional neural networks. Annual Conference on Neural Information Processing Systems (NIPS). Harrah’s Lake Tahoe: Curran Associates, 2012, pp. 1097–1105. ISBN 978-1627480031. [5] RGB-D Object Dataset. In: University of Washington [online]. 2014. Available at: http://rgbd-dataset.cs.washington. edu/dataset/. [6] SCHWARZ, M., H. SCHULZ and S. BEHNKE. RGB-D object recognition and pose estimation
c 2017 ADVANCES IN ELECTRICAL AND ELECTRONIC ENGINEERING
524
VOLUME: 15 | NUMBER: 3 | 2017 | SEPTEMBER
DIGITAL IMAGE PROCESSING AND COMPUTER GRAPHICS
based on pre-trained convolutional neural network features. In: IEEE International Conference on Robotics and Automation (ICRA). Seattle: IEEE, 2015, pp. 1329–1335. ISBN 978-1-47996923-4. DOI: 10.1109/ICRA.2015.7139363.
on Convolutional Neural Network. In: 2017 IEEE 11th International Conference on Semantic Computing (ICSC). San Diego: IEEE, 2017, pp. 61–64. ISBN 978-1-5090-4284-5. DOI: 10.1109/ICSC.2017.57.
[7] HAWLEY, T., M. G. MADDEN, M. L. [15] LeNet Convolutional Neural NetO’CONNELL and A. G. RYDER. The effect of works in Python. In: PyImageprincipal component analysis on machine learnSearch [online]. 2016. Available at: ing accuracy with high-dimensional spectral data. http://www.pyimagesearch.com/2016/08/01/lenetKnowledge Based Systems. 2006, vol. 19, iss. 5, convolutional-neural-network-in-python/. pp. 363–370. ISSN 0950-7051. [16] Understanding convolutional neural networks. [8] ABUROMMAN, A. A. and M. B. I. REAZ. In: WildML [online]. 2015. Available at: Ensemble SVM classifiers based on PCA and http://www.wildml.com/2015/11/understandingLDA for IDS. In: 2016 International Conconvolutional-neural-networks-for-nlp/. ference on Advances in Electrical, Electronic and Systems Engineering (ICAEES ). Putrajaya: [17] MURPHY, K. P. Machine Learning: A Probabilistic Perspective. Massachusetts: MIT University IEEE, 2016, pp. 95–99. ISBN 978-1-5090-2889-4. Press. 2012. ISBN 9780262018029. DOI: 10.1109/ICAEES.2016.7888016. [9] HAGAR, A. A. M., M. A. M. ALSHEWIMY and M. T. F. SAIDAHMED. A new object recognition framework based on PCA, LDA, and K- About Authors NN. In: 11th International Conference on Computer Engineering & Systems (ICCES). Cairo: Tibor TRNOVSZKY was born in Zilina and IEEE, 2016, pp. 141—146. ISBN 978-1-5090-3267- started to study on University of Zilina in 2009. He is 9. DOI: 10.1109/ICCES.2016.7821990. focused on computer vision and image processing. [10] KAMENCAY, P., T. TRNOVSZKY, M. BENCO, R. HUDEC, P. SYKORA and A. SATNIK. Accurate wild animal recognition using PCA, LDA and LBPH, In: 2016 ELEKTRO. Strbske Pleso: IEEE, 2016, pp. 62–67. ISBN 978-1-4673-8698-2. DOI: 10.1109/ELEKTRO.2016.7512036.
Patrik KAMENCAY was born in Topolcany in 1985, Slovakia. He received his M.Sc. and Ph.D. degrees in Telecommunications from the University of Zilina, Slovakia, in 2009 and 2012, respectively. His Ph.D. research work was oriented to reconstruction of 3D images from stereo pictures. Since October 2012 he [11] STEKAS, N. and D. HEUVEL. Face Recognition is researcher at the Department of MICT, University Using Local Binary Patterns Histograms (LBPH) of Zilina. His research interest includes holography for on an FPGA-Based System on Chip (SoC). In: 3D display and construction of 3D objects of the real 2016 IEEE International Parallel and Distributed scene (3D reconstruction). Processing Symposium Workshops (IPDPSW). Chicago: IEEE, 2016, pp. 300–304. ISBN 978- Miroslav BENCO was born in Vranov nad Toplou 1-5090-3682-0. DOI: 10.1109/IPDPSW.2016.67. in 1981, Slovakia. He received his M.Sc. degree in 2005 at the Department of Control and Information [12] FARUQE, M. O. and A. M. HASAN. Face recog- System and Ph.D. degree in 2009 at the Department nition using PCA and SVM. In: 2009 3rd Inter- of Telecommunications and Multimedia, University national Conference on Anti-counterfeiting, Secu- of Zilina. Since January 2009 he is researcher at rity, and Identification in Communication. Hong the Department of MICT, University of Zilina. His Kong: IEEE, 2009, pp. 97–101. ISBN 978-1-4244- research interest includes digital image processing. 3883-9. DOI: 10.1109/ICASID.2009.5276938. Peter SYKORA was born in Cadca in 1987, Slovakia. He received his M.Sc. degree in Telecommunications from the University of Zilina, Slovakia, in 2011. His research interest includes hand gesture [14] WU, J. L. and W. Y. MA. A Deep Learn- recognition, work with 3D data, object classification, ing Framework for Coreference Resolution Based machine learning algorithms.
[13] VAPNIK, V. Statistical Learning Theory. New York: John Wiley and Sons, 1998. ISBN 978-0471-03003-4.
c 2017 ADVANCES IN ELECTRICAL AND ELECTRONIC ENGINEERING
525