Croatian Journal of Education Vol: 13 (1/2011), page: 99 - 137 Original scientific paper Paper submitted: 8th June 2011 Paper accepted: 25th July 2011
ANIMATIONS MADE IN MATLAB AND THEIR APPLICATION FOR DIDACTIC PURPOSES Djurdjica Takaci1, Igor Nikola Dimovski2 1 Department of Mathematics and Informatics, Faculty of Sciences, University of Novi Sad, Serbia 2 University for Information Science and Technologies, Ohrid, Macedonia
SUMMARY The aim of this paper is to show how dynamic multimedia tool in Matlab (animation) can be made and how the animations and movies can be used for didactic purposes, or to be more precise, how they can be integrated into the teaching process. This paper is a part of a more complex research whose aim is to investigate the impact of the information technology on the quality of mathematical knowledge related to functions. Analysis of the results of a research conducted on a sample of 30 students before and after performing the innovated teaching with the application of the information technology showed a significant impact of the IT application on the quality of knowledge related to functions. The t-test showed that, with the probability of 99%, it can be concluded that the results of the students after carrying out such type of innovated teaching were significantly better than their results on analogue contents taught through classical teaching. Key words: animations created in Matlab, dynamic multimedia tools, integration of the educational ICT materials in teaching, movie (.avi file), verbal and visual learning
99
Croatian Journal of Education Hrvatski časopis za odgoj i obrazovanje
Vol: 13 (1/2011) page: 99-137
VERBAL AND VISUAL LEARNING. Functions in mathematics education According to the cognitive theory, there are two qualitatively different methods of learning: verbal learning and visual learning. These two methods are complementary and mutually non-exclusive (Milovanović, 2005). In teaching practice, verbal learning is the most common method of learning. Words are the basis of every communication, therefore, in any teaching method in the classical teaching methodology it is the way in which a word game is organised. Generally, words are used to explain facts and generalisations, regardless whether the teaching content is simple or complex. Books, textbooks, workbooks and didactic tools in general, are filled with words. One of the didactic principles is the principle of evidence and abstractness. There is an old saying which says that an image is worth a thousand words. Visual learning supplements the verbal and enables complete perception. No matter how simple or complex, or concrete or abstract teaching contents are, visualisation is important for the students to be able to activate their complete perceptive apparatus, which is necessary to initiate the thinking process. Creating terms begins with the perception of concrete objects, followed by the thinking process through which the abstract term is created (Campbell, Jammy, 2005). Visualisation is especially important in teaching mathematics. It is a process of presenting contents using geometric or graphic presentation of mathematical principles, theorems or problems, or by means of computer graphics or animations. Visualizations are a specific form of external representation intended to communicate information by using a visuo-spatial layout of the information and processed in the visual sensory system (Scheiter, Wiebe, Holsanova, 2009). The concept of function as commonly known through the definition (a correspondence between two sets which assigns every one of the elements in the first set to an element in the second set), plays a central and unifying role in mathematics. However, most students do not generally associate function with this formal definition. Their images of the concept are varied and numerous.
100
Dj. Takaci, I. N. Dimovski: Animations made in matlab and their application for didactic purposes
Most of the studies that examine these images do so in an Analysis /Calculus context (Nardi, 2008). When university students take their first analysis course, they have already encountered many different specific functions and used many different algorithms and procedures related to function investigation. Studies show that university students tend to focus on procedural aspects of functions, but without knowing why the procedures and algorithms work, and that this tendency to focus on procedure is related to the students’ lack of graphical understanding (Ottesen, 2009). The most striking and most powerful impact comes when, in pursuit of a mathematical question or goal, students directly explore a geometric realm informed by hand and eye, focused by their minds (Mackrell, Johnston-Wilder, 2004). In teaching mathematics, functional thinking is especially important. Very often there is a need for the presentation of dynamic processes which need to be explained with dynamic means, with presentations where movements – animations are shown.
DYNAMIC MATHEMATICAL SITUATION The following example demonstrates how the presentation of the dynamics of a mathematical situation can be achieved with the means of static multimedia tools. Example 1. Analysing the following problem: “Determine intersection of a hyperboloid
x2 − y 2 −
z2 =1 4
with plane x = d, depending on the values of the constant d”, the graphics can be considered as generated by the simple code in MATLAB.
101
Croatian Journal of Education Hrvatski časopis za odgoj i obrazovanje
Vol: 13 (1/2011) page: 99-137
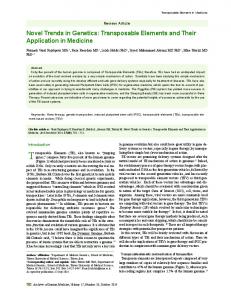
Picture 1. Visualisation of a concrete mathematical problem Parameterization of the hyperboloid, the meshgrid and surface functions can be used in MATLAB in order to achieve graphics given in Picture 1. a=2;b=1;c=1; u=-4:0.1:4; v=0:0.05:3.15; [U,V]=meshgrid(u,v); z=a*sinh(U).*cos(V); y=b*sinh(U).*cos(V); x=c*cosh(U); h=surface(x,y,z); h1=surface(-x,y,z); view(38,54) MATLAB code. 1.
Dynamics can be achieved by showing intersection of the ellipses for different values of the parameter d.. In the MATLAB, the function plot3 for the magnifier can be used in order to obtain ellipses shown in Picture 1.
102
Dj. Takaci, I. N. Dimovski: Animations made in matlab and their application for didactic purposes
t=0:0.05:6.3; for d=-27:2:-1 d1=sqrt(d^2-1); z1=2*d1*cos(t); y1=d1*sin(t); x1=0*t+d; plot3(x1,y1,z1,'k','LineWidth',1) plot3(-x1,-y1,z1,'k','LineWidth',1) end MATLAB code. 2.
Having MATLAB code for generating this graphics, it is not at all difficult to experiment with different values of the parameter d. This enables the application of the teaching methods that actuate functional thinking of the students and, at the same time, creates several different situations that lead the students to seek connections between formulas and the results achieved, a task they can easily do by themselves, and the whole process is really happening in the 3D surroundings. For example, after solving the system: 2 z2 2 =1 x − y − 4 x = d
it is essentially important to ask what solving the system shown with this equation means geometrically:
y2 z2 + =1. d 2 − 1 4 ( d 2 − 1) Describing the shape and the position of the ellipse depending on the value of parameter d cannot be accomplished with formal knowledge. Graphics shown in the picture can greatly assist students to see the shape and the position of the ellipse, and verbally describe what kind of ellipse is produced, for instance, for the following values: d = 10 and d = −10. Students can even be asked to sketch this kind of ellipse in a 2D coordinate system whose axes are y and z and then interpret it according to the
103
Croatian Journal of Education Hrvatski časopis za odgoj i obrazovanje
Vol: 13 (1/2011) page: 99-137
distance from the yz-coordinate plane where this ellipse along with the plane x = d, parallel to it, will be placed. Students should in essence understand the condition for an intersection between the two-part hyperboloid and the plane: |d| > 1. For that purpose, questions such as “what happens if d = 0 or d = ½?” are very useful. With this kind of questions the students may be introduced to a situation where the problem is to interpret equation attained for d = 0: 4y2 + z2 = −4, and that does not fulfil any ordered pair of real numbers, bring into context with inexistence of an intersection of the given hyperbolide and the yzcoordinate plane, thus visualise this conclusion relatively easily. Interaction For this obvious connection to be quickly and precisely visualised, the same MATLAB code can be used by changing the values of the parameter d and rotation of the view. This means that in a realistic classroom, with integration of such educational materials in the real teaching process, a certain degree of interaction can be achieved between the student and the educational software. The following code shows how the code 2 can be changed in order to present a situation where instead of showing all those ellipses from Picture 1, we can import a single chosen value of the parameter d, after which MATLAB will generate graphics where a solution of the problem from the Example 1. is shown for that particular value of the parameter d . d=input('Enter value for the constant d: ') d1=sqrt(d^2-1); z1=2*d1*cos(t); y1=d1*sin(t); x1=0*t+d; hold on plot3(x1,y1,z1,'k','LineWidth',1) MATLAB code. 3.
DYNAMIC MULTIMEDIA TOOLS
104
Dj. Takaci, I. N. Dimovski: Animations made in matlab and their application for didactic purposes
Animations made in MATLAB For the students to acquire essential knowledge about the functions and their properties, it is necessary to develop a sense of the impact of the change of input value over the output value, as well as on the geometrical interpretations, and everything that function or the limits, derivative, integral, etc. mean in the mathematical model where a certain real situation is described with that function. In the Example 1. there is a description of some “tricks” on how to emulate a certain dynamic mathematical situation by means of static multimedia tools. Interpretation of 3D vector function as a model of particle motion and its derivative as tangent vector of a curve that is a trajectory described by that particle motion and the velocity vector of that motion, then the second derivative of that function is acceleration of that same motion etc. is very difficult to explain by the use of static graphics and almost impossible by means of the traditional teaching methods (Thomas, Weir, Hass, Giordano, 2007). Using MATLAB in learning mathematics might seem risky, because of the difficulty of the computer programming. But, mathematics was one of the earliest subjects to make use of the computer in the classroom. This is not surprising because the first digital computers were primarily developed to solve differential equations. Many people are convinced that computer programming could provide a valuable way into learning mathematics (Sutherland, 2007). MATLAB offers quite an easy and interesting way of creating animations with the help of which dynamic features of functions can be described. The essence of creating such animations is in generating a great number of static pictures in which most objects remain unchanged, and only few change. Every picture presents one frame. A row of such frames is kept in the so called movie matrix that can be preserved as a separate file. Then, with a simple MATLAB code, an animation reading the movie matrix, placing the static part of the graphics and issuing the command for showing the movie can be shown. The created animation can be literally exported as a movie, i.e. video file in an .avi format.
105
Croatian Journal of Education Hrvatski časopis za odgoj i obrazovanje
Vol: 13 (1/2011) page: 99-137
Such manner of creating animations can be used for didactic purposes. A coordinate system is created, the view is set (azimuth and elevation), static and geometrical objects are drawn, whereas dynamics is emulated by change of form and/or the position of moving objects. Every change is kept as a frame, and then the animation is created by reading the matrix created in this way. In order to achieve the teaching aims related to, for instance, the given example of the interpretation of the vector-valued 3D function as motion of a particle, the following assignment can be used: Example 2. Vector-valued function r ( t ) = (1 + t ) i +
t2
j+
t3 k shows 3
2 the position of the particle that is moving in the 3D space in time t. Find the velocity vector of this particle in time t=1.
In order to achieve dynamics, the following question is suggested: what would the same problem look like if instead of t = 1, a different time coordinate was taken, or in what way would the speed vector change if the time changed continuously from 0 to 2.5? This is a classical mathematical situation where the dynamics is in the very nature of the problem. In order to show the motion of the particle that is described with the given vector-valued 3D function and the change of the velocity vector: v ( t ) = i + 2 tj + t 2 k
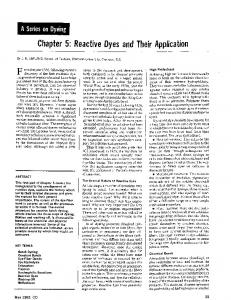
that occur with the change of time t in an interval of [0,2.5], a curve can once be drawn – the trajectory of motion, and the position of the particle and the velocity vector can be calculated for different values of the input parameter t. In order to show the motion, it is sufficient to construct a partition of the interval [0,2.5] into 25 subintervals with the given step of 0.1. In that way, 26 frames that will be stored in the movie matrix can be generated and later, animation that will be shown after the discussion regarding what happens with the change of the input parameter t, can be created.
106
Dj. Takaci, I. N. Dimovski: Animations made in matlab and their application for didactic purposes
% 2. Creating the movie matrix M2 for s=1:26 steps=2*s+1; figure(1) hold on set(1,'Position',[100,50,800,600]) grid on;axis equal;axis([-1, 4, -2, 8, 0, 10]);view(30,18) r=[x(steps),y(steps),z(steps)]; plot3(r(1),r(2),r(3),'bo') plot3(x,y,z,'LineWidth',1.5) T=[x1(steps),y1(steps),z1(steps)]; T1=r+T; plot3([r(1),T1(1)],[r(2),T1(2)],[r(3),T1(3)],'r','LineWidth',2.5) xlabel('x');ylabel('y');zlabel('z'); M2(s) = getframe; close(1) end save M2 MATLAB code. 4.
This is shown in the previous code where the key command is getframe, which every frame in the movie matrix M2 is saved with, and that comes after the command save, is saved as a separate .mat file with that name. In the teaching practice, students can be shown only the execution of the following code: clear all;clc load M2.mat M2 figure(1) set(1,'Position',[100,50,800,600]) axis equal axis([-1, 4, -2, 8, 0, 10]);view(30,18) movie(M2,1,4); MATLAB code. 5.
thus practically producing the animation of the related assignment from the Example 2.
107
Croatian Journal of Education Hrvatski časopis za odgoj i obrazovanje
Vol: 13 (1/2011) page: 99-137
Picture 2. Frames from which animation is created This is one of the ways for such a dynamic multimedia tool to integrate into the teaching process. It is very important to recognise that with such an exercise avoiding formal knowledge can be achieved since, apart from having students apply formal rules for differentiation of the vector function and “recite by heart” that itt is a velocity vector of particle motion, with such an exercise they can attain a perception of what is really happening and how the differentiation is in direct connection with the real events. Using finer interval partition, closer frames are obtained, meaning that a better animation can be made. Movie When it comes to modern mathematics teaching, in the contemporary information society based on knowledge, it should be taken into consideration that the integration of the educational materials in teach teaching is not limited merely to certain teaching situations in a real classroom. So, the question arises
108
Dj. Takaci, I. N. Dimovski: Animations made in matlab and their application for didactic purposes
as to how such multimedia tools can be made available to students not only during the class, but also after the class or even independently from the real teaching (classroom) itself, and in the virtual teaching space (e-learning managing systems) (Mirchev, Aleksov, 2005), (Tuparov, Dureva, 2005). MATLAB offers opportunities for the created animation to be exported as a movie, more precisely as a file in an .avi format. After that, this file can be used quite independently from the MATLAB application itself. Creating an .avi file If, for instance M2 is a movie matrix, it can be saved as an M2.mat file and loaded at any time with a simple command: load M2.mat M2. For showing the animation itself, it is enough to use the following command: movie(M2, 1, 4). Parameter 1 means that the animation should be shown once, whereas parameter 4 stands for the number of frames shown in a second. Using the command movie2avi(MTP,'TangentToCurve','fps',4) a TangentToCurve.avi file is created and can be viewed by any player that supports this type of files. Processing and conversion of .avi files With the last command, a film is created allowing the animation shown in the Example 2 to be viewed independently from MATLAB. http://www.e-ucitel.net/vismath/vid26.wmv Such file can be edited with usual applications for video file processing, like the Windows Movie Maker, for instance. It is necessary to compress the video file in order for it to be uploaded on the Internet. We have uploaded compilations of such video files created in MATLAB for research purposes. http://www.youtube.com/watch?v=Y9LVIaO8yP4 Creating such educational materials itself cannot be considered independently from the issue of using such materials for didactic purposes.
109
Croatian Journal of Education Hrvatski časopis za odgoj i obrazovanje
Vol: 13 (1/2011) page: 99-137
Therefore, this presentation has focused on teaching techniques that help integrate such educational materials in the teaching process. Developing dynamic mathematical situations, apart from the previously described methods, can be achieved by creating didactic systems of mathematical problems that can be further developed in various teaching forms. Among those forms is the project teachin teaching, organised over the elearning management system. For instance, picture 3 shows several animation frames that treat the problem of application of partial derivatives and the problem of tangent planes of a given surface.
Picture 3. Tangent planes nes of given surface The animation itself, as well as 25 more video files prepared for the needs of the project teaching of this research can be seen on the website: http://www.e-ucitel.net/vismath/vid22.wmv ucitel.net/vismath/vid22.wmv
110
Dj. Takaci, I. N. Dimovski: Animations made in matlab and their application for didactic purposes
RESEARCH METHODOLOGY Research aim The main aim of the research is: o Determining the degree of application impact of the visualisation methods based on the theoretical bases of mathematics didactics and the integrated approach of information communication technologies application in teaching mathematics over the students’ quality of knowledge regarding specific teaching content. The teaching content includes functions, especially vector-valued functions and functions with more variables, and their properties as well as three-dimensional analytical geometry – curve and surface. The following aims will be reached with the research: o Designing educational materials in electronic form that enable students to learn functions and their properties with interactive computer tools, integrated in the e-learning management system. o Designing instruments that can measure the impact of visualisation methods applications on the quality of crucial knowledge. The expected result of the research is the confirmation of the assumption that visualisation methods based on theoretical grounds of mathematic didactics and the integrated approach of information communication technology application in teaching mathematics have a significant influence on the knowledge quality of the students and that they quite positively affect the constructive psychological experiences of the students during their studies of mathematics. Research participants The research was conducted during the academic year 2009/2010. The research subjects were a group of 30 students from the University of Information Sciences and Technology, “Sv. Apostol Pavle” Ohrid, Macedonia. During the first semester, the teaching of the subject Mathematics 1 was performed applying the classical approach. The work and the results of these students were analytically observed. Before the beginning of the second
111
Croatian Journal of Education Hrvatski časopis za odgoj i obrazovanje
Vol: 13 (1/2011) page: 99-137
semester, the contents that were defined as essential knowledge about functions with one variable and 2D analytical geometry were separated. Then, the strategy was prepared about the development, by means of analogy, of similar concepts that refer to vector-valued functions, functions of several variables and 3D analytical geometry, all part of the Mathematics 2 course. Students’ previous knowledge regarding this essential knowledge was measured using the “Diagnostic test” instrument. After performing innovated teaching, using analogy again, the “Re-test” instrument was used. With the comparative analysis of the “before” and “after” results, conclusions were drawn on the degree of the impact information technology application had over the students’ knowledge of functions. Methods and techniques of innovated teaching The phase of teaching performance is the central and the longest phase of this research. What was really happening in the classrooms was actually a generator of the changes we expected. Innovation in teaching refers to the classical teaching performed by chalk and board enriched with the application of information and communication technology, in particular, by integrating multimedia tools created in MATLAB in the teaching process. The accent is placed on the contents directly linked with the knowledge that was in the pre-research phase defined as essential regarding functions with more variables and three dimensional analytical geometry. In that way, a choice of 6 blocks of lessons was designed, composed of teaching lessons where innovated teaching was intensely applied. It means that with this choice of 6 blocks there are 18 teaching lessons with innovated approach that cover 40% of the whole teaching time. For every single one of these 6 blocks one appropriate topics was chosen and developed with the innovated approach. Straight lines and planes in space; Cylinders and square surfaces; Vector-valued functions; Functions of several variables;
112
Dj. Takaci, I. N. Dimovski: Animations made in matlab and their application for didactic purposes
Tangent planes; Double integrals; Important feature of the innovated approach is that for any of these topics a didactic system of mathematical problems was designed, so that for every assignment an appropriate visualisation was prepared – graphics or an animation created in MATLAB. It means that for each simplified general drawing that in the classical teaching quite roughly shows a generalised situation, in this approach the graphics or the animation was specially designed in order to show a particular mathematical situation to which the given assignment refers. Didactic systems of the block 1. Straight lines and planes in space consist of 31 assignments of which 22 are made using the prepared educational materials, whereas 9 assignments are for individual work. For the block 2. Cylinders and square surfaces, there are 22 appropriate programmes in MATLAB, intended for particular mathematical situation, amounting to 22 assignments of total 32. The rest 10 assignments are quiz questions. Blocks 3-6 refer to the contents where dynamic nature of the problem is accented. Therefore, the application of the dynamic multimedia tools was here particularly noted. Vector-valued functions were developed intensively using 20 animations and graphics made in MATLAB. Didactic systems of assignments refer to block 4. Functions of several variables and consist of 30 assignments of which 18 are developed with graphics and animations and some assignments have 2 approaches – two-dimensional (regarding the domain of the function), and three-dimensional that refer to the function graphic with 2 independent variables. The rest of the 12 assignments refer to the technical solutions for determining limits of such functions. Tangent planes were again skilfully developed using a number of animations linking partial derivatives of the function of two variables and a real three-dimensional view. This didactic system consisted of 6 assignments with appropriate animations and graphics prepared for all of them. The last block 6. Double integrals, was developed using a didactic system of 19 assignments. Appropriate educational materials developed in MATLAB refer to two – dimensional visualisation in the area of integration, as well as to three – dimensional visualisation of the double integral interpretation of the volume, and visualisation of the Riemann’s sum of functions of two variables.
113
Croatian Journal of Education Hrvatski časopis za odgoj i obrazovanje
Vol: 13 (1/2011) page: 99-137
Thus, 40% of the lessons were realised with this innovated approach. For that purpose 138 mathematical assignments systematically organised and systematised in 6 units were used. For 107 of such assignments, multimedia tools – graphics and animations designed in MATLAB were used. These tools were integrated in the teaching process, so that for every particular situation, an appropriate visualisation was shown but also, through carefully chosen questions, a discussion was developed regarding what would happen in case some of the parameters changed; so MATLAB was used instantly in order for the changes that occurred to be shown. In this way, the interaction was achieved between the students and the multimedia tools used as educational tools. Wherever it was possible, the dynamic nature of a certain problem or a mathematical situation was visualised using an appropriate animation. Measurement of the impact of innovated methods and techniques Instruments The basic aim of the diagnostic testing was to obtain relevant data about the previous knowledge of the students in order to perform comparative analysis with the knowledge that students acquired after the research was completed. Having in mind that the part of teaching this research refers to, is related to functions of several variables, vector-valued functions and threedimensional analytical geometry, the previous knowledge was, therefore, related to functions of one variable and two-dimensional analytical geometry. The major issues that this research is related to can be understood by the analogy of the functions of one variable and the two-dimensional analytical geometry, hence, the comparative analysis itself too, refers to comparing the results of this area with the results from the area of analogy. Having in mind the choice of the contents that are set as essential knowledge regarding functions of one variable, the diagnostic test was designed to measure students’ knowledge referring to the following 5 categories: Limits of a function at a given point and continuity of real functions of one variable; Graphs and properties of functions of one variable;
114
Dj. Takaci, I. N. Dimovski: Animations made in matlab and their application for didactic purposes
Differentiability, derivative of a function with one variable and a geometric interpretation of the derivative; Definite integral; Two-dimensional analytical geometry – curves of second order.
After determining categories, indicators were divided according to the categories. In Table 1, a review of questions is given by categories. Table. 1. Review of the questions of the diagnostic test Category 1 2 1 and 2 3 4 5
Number of questions of referent categories 3 4 4 4 2 3
After the realisation of the teaching with the innovated approach, the measurement of the changes in the students’ knowledge was conducted so that certain conclusions about the impact of ICT over students’ knowledge regarding functions could be drawn. Since the aim and the object of testing were determined, designing the instruments followed, and the knowledge was measured after the research activities were carried out. This instrument is called a re-test because its design is very similar to the diagnostic test, and it is completely adapted to the aim to measure the change of students’ essential knowledge that occurred during the research. Because of that, the re–test is designed so as to measure the knowledge of the students regarding the following 5 categories: 1r. Limits of a function of two variables at a given point and continuity of real functions of two variables; 2r. Domain, range and graph of a function of the two variables; 3r. Differentiability, tangent of a curve and tangent plane of a 3D surface; 4r. Double integral, volume; 5r. Tree-dimensional analytical geometry – of a straight line, a plane and surfaces of second order.
115
Croatian Journal of Education Hrvatski časopis za odgoj i obrazovanje
Vol: 13 (1/2011) page: 99-137
After determining categories, indicators were divided according to the categories. In Table 2. a review of questions is given according to the categories. Table 2. Review of the questions of the re-test Category 1r 2r. 1r and 2r 3r. 4r. 5r.
Number of questions of referent categories 4 2 2 4 2 4
RESULTS The average result of the 30 observed students on the diagnostic test was 41% with a standard deviation of 14.8. The average result of the same 30 students on the re-test was 64.8% with a standard deviation of 14.4. The obvious difference in favour of the re-test was verified using t-test for equity of mathematical expectations. The statistical null-hypothesis was tested: E(X) > Е(Y) where X is a random variable “the student’s result on the diagnostic test”, Y is the random variable “the student’s result on the re-test”, E(X) and E(Y) are their mathematical expectations, contrary to alternative hypothesis: E(X) < E(Y). The sample size of both samples was nx = ny = 30. It was presumed that the random variables X and Y have equal standard deviation. For the estimation of that unknown standard deviation σp2, the corrected standard deviation samples were used: sx = 15.1; sy = 14.6.
116
Dj. Takaci, I. N. Dimovski: Animations made in matlab and their application for didactic purposes
Estimation of the standard deviation is: 2
σp =
( nx − 1) sx 2 + ( ny − 1) s y 2 nx + n y − 2
≈ 14.86 .
Test-statistic variable
T=
X −Y 1 1 σp + nx n y
particular results obtained from this research attain realisation t = −6.1. Since the critical domain of this unilateral test with a level of significance α = 0.01 is the interval B = (−∞, −2.39), it can be concluded that the results achieved for the value on t -test deeply fall into the critical domain of the test, which means that the null-hypothesis can be rejected and the alternate hypothesis can be accepted. This means that with the probability of 99%, a statistically valid conclusion can be made that the students’ results after carrying out this type of innovated teaching were significantly better than their results on the analogue contents acquired through classical teaching. Achieved results by categories are shown in Table 3. Table. 3. Comparison of results of both tests Category
Diagnostic test
Re-test
Difference
1 (1r)
28.9
55.8
26.9
2 (2r)
40.8
66.7
25.8
1 и 2 (1r and 2r)
42.5
51.7
9.2
3 (3r)
26.7
56.7
30.0
4 (4r)
46.7
90.0
43.3
5 (5r)
65.6
75.0
9.4
117
Croatian Journal of Education Hrvatski časopis za odgoj i obrazovanje
Vol: 13 (1/2011) page: 99-137
CONCLUSION Even though the program package MATLAB is intended for quite different purposes, it can be used for creating multimedia tools that can be used for didactic purposes and be integrated into various forms of the teaching process. These educational materials are not difficult to design – they can be designed by teachers or by the students themselves after a short training. Dynamic mathematical situations, even those regarding 3D mathematics, can be emulated by graphics – static multimedia tools. But a significantly stronger effect is achieved by dynamic multimedia tools – animations and movies. Integration of educational materials into regular teaching has a powerful positive impact over the process of learning mathematics, especially when dynamic multimedia tools for explanation of the dynamic mathematical situations are used. Analysis of the results obtained from the research conducted on a sample of 30 students before and after performing the innovated teaching with the application of the information technology has shown that there is a significant impact of the IT application over the quality of knowledge related to functions. The results of the t-test have shown that with the probability of 99% it can be concluded that the students’ results after the implementation of this type of innovated teaching are significantly better than their results on analogue contents acquired during a lesson where classical teaching was applied. After the analysis of the results in Table 3, it can be concluded that the results of this research indicate that the application of innovated teaching using educational materials created in MATLAB has resulted in the largest impact on the integrated concept learning. The smallest effect was found for the issue related to more complex situations that require the students to link their knowledge about limits and the continuity related to graphic view of the function and the issue related to the analytical geometry, but the last difference is smaller because the previous knowledge in this area was better. Quite a significant progress was recorded with respect to the issues related to the limits and the continuity of the functions, graphs of functions and geometric interpretations of the derivatives.
118
Dj. Takaci, I. N. Dimovski: Animations made in matlab and their application for didactic purposes
REFERENCES Campbell, I., Jammy, I.D. (2005) Handbook of mathematical cognition. New York: Psychology Press. Mackrell, K., Johnston-Wilder, P. (2004) Thinking geometrically: Dynamic imagery. In Johnston-Wilder, S Prim, D (eds.) Teaching Secondary Mathematics with ICT (Learning & Teaching With Information & Communications Technology) (pp. 81-100). Maidenhead: Open University Press. Milovanovic, M. (2005) Multimedia learning in education: Multimedia lessons on Rotation. In Ilievski, B. (ed.) Proceedings of III congress of mathematicians of Macedonia (pp.131-140). Skopje: Mathematical society of Macedonia. Mirchev, I.A. Aleksov, Z.A. (2005) Software tools for building the web-based distance learning systems - aproaches and comparison. In Ilievski, B. (ed.) Proceedings of III congress of mathematicians of Macedonia (pp.141-146). Skopje: Mathematical society of Macedonia. Nardi, E. (2008) Amongst Mathematicians: Teaching and Learning Mathematics at University Level. New York: Springer Science+Business Media, LLC. Ottesen, S.T. (2009) Relating University Mathematics Teaching Practices and Students' Solution Processes. (PhD dissertation, Roskilde University) Roskilde: IMFUFA, Department of Science, Systems and Models. Scheiter, K., Wiebe, E., Holsanova, J. (2009) Theoretical and Instructional Aspects of Learning with Visualizations. In Zheng, Z.R. (ed.) Cognitive Effects of Multimedia Learning (pp.67-88 ). New York: IGI Global Sutherland, R. (2007) Teaching for Learning Mathematics. Maidenhead: Open University Press. Thomas, G.B. Weir, M.D. Hass, J. Giordano, F.R. (2007) Thomas' Calculus, 11th edition - Boston: Addison Wesley.
119
Croatian Journal of Education Hrvatski časopis za odgoj i obrazovanje
Vol: 13 (1/2011) page: 99-137
Tuparov, G., Dureva, D. (2005) One approach for modelling of adaptive scenarios in e-learning environments. In Ilievski, B. (ed.) Proceedings of III congress of mathematicians of Macedonia (pp.199-206). Skopje: Mathematical society of Macedonia.
Djurdjica Takaci Department of Mathematics and Informatics, Faculty of Sciences, University of Novi Sad, Trg Dositeja Obradovića 3, Novi Sad, Serbia,
[email protected] Igor Nikola Dimovski University for Information Science and Technologies, Partizanska bb, Ohrid, Macedonia,
[email protected]
120
Dj. Takaci, I. N. Dimovski: Animations made in matlab and their application for didactic purposes
ANIMACIJE IZRAĐENE U MATLAB-u I NJIHOVA PRIMJENA U DIDAKTIČKE SVRHE
SAŽETAK Cilj ovog rada je pokazati kako se može načiniti dinamički multimedijski alat u Matlabu (animacija) i kako se animacije i filmovi mogu koristiti za didaktičke svrhe, ili, da budemo precizniji, kako mogu biti integrirani u nastavni proces. Ovaj rad je dio složenijeg istraživanja čiji je cilj istražiti utjecaj informacijske tehnologije na kvalitetu matematičkih znanja vezanih uz funkcije. Analiza rezultata istraživanja, provedenog na uzorku od 30 studenata prije i nakon izvođenja inovativne nastave uz primjenu informacijskih tehnologija, pokazala je značajan utjecaj primjene informacijskih tehnologija na kvalitetu znanja vezanih uz funkcije. Ttest je pokazao da se, uz vjerojatnost od 99%, može zaključiti da su rezultati studenata nakon izvođenja ovog oblika inovativne nastave bili znatno bolji od rezultata iste skupine studenata na analognim sadržajima tijekom klasične nastave. Ključne riječi: animacije stvorene u Matlabu, dinamički multimedijski alati, integracija ICT obrazovnih materijala u nastavi, film (.avi datoteka.), verbalno i vizualno učenje
VERBALNO I VIZUALNO UČENJE. Funkcije u nastavi matematike Prema kognitivnoj teoriji, postoje dvije kvalitativno različite metode učenja: verbalno i vizualno učenje. Ove su dvije metode komplementarne i međusobno se ne isključuju (Milovanović, 2005). U nastavnoj praksi verbalno je učenje najčešća metoda učenja. Riječi su temelj svake komunikacije, dakle, u svakoj nastavnoj metodi u tradicionalnoj metodici to je način na koji je organizirana igra riječi. Općenito govoreći, riječi
121
Croatian Journal of Education Hrvatski časopis za odgoj i obrazovanje
Vol: 13 (1/2011) page: 99-137
se koriste za objašnjenje činjenica i generalizacija, bez obzira na to radi li se o jednostavnim ili složenim nastavnim sadržajima. Knjige, udžbenici, zbirke i didaktička pomagala općenito sadrže velik broj riječi. Jedno od didaktičkih načela je načelo zornosti i apstrakcije. Postoji stara izreka prema kojoj slika vrijedi tisuću riječi. Vizualno učenje dopunjuje verbalno i omogućuje potpunu percepciju. Bez obzira na to koliko je nastavni sadržaj jednostavan ili složen, odnosno konkretan ili apstraktan, vizualizacija je važna kako bi studenti mogli u cijelosti aktivirati svoje perceptivne organe, što je nužno kako bi se pokrenuo proces razmišljanja. Stvaranje pojmova počinje s percepcijom konkretnih predmeta, nakon čega slijedi proces razmišljanja pomoću kojeg nastaje apstraktni pojam (Campbell, Jammy, 2005). Vizualizacija je naročito važna u nastavi matematike. To je proces predstavljanja sadržaja pomoću geometrijskih ili grafičkih prikaza matematičkih principa, poučaka ili problema, ili pak pomoću računalnih grafičkih prikaza ili animacija (Milovanović, Takači, Milajić, 2010). Vizualizacije su specifičan oblik vanjskog prikaza namijenjen prijenosu podataka pomoću vizualno-prostornog razmještaja podataka i obrađen pomoću vizualnog osjetilnog sustava (Scheiter, Wiebe, Holsanova, 2009). Koncept funkcije, općepoznat po svojoj definiciji (korespondencija između dva skupa gdje se svakom od elemenata u prvom skupu dodjeljuje element drugog skupa), zauzima središnju i jedinstvenu ulogu u matematici. Međutim, većina studenata općenito ne povezuje funkciju s navedenom formalnom definicijom. Njihove predodžbe koncepta različite su i brojne. Većina istraživanja koja se bave proučavanjem predodžbi čine to u kontekstu Matematičke analize (Nardi, 2008). Kada studenti upišu prvi kolegij analize, oni već imaju određena predznanja u smislu da su se već susreli s različitim specifičnim funkcijama te da su se koristili različitim algoritmima i postupcima vezanima uz istraživanja funkcija. Istraživanja pokazuju da se studenti nastoje usredotočiti na proceduralne elemente funkcija, ali ne znajući zašto određeni postupci i algoritmi funkcioniraju i da je ta sklonost usredotočenja na postupak povezana s nedostatkom grafičkog razumijevanja kod učenika (Ottesen, 2009). Najupadljiviji i najsnažniji utjecaj vidljiv je kada, tražeći matematičko pitanje ili cilj, studenti izravno istražuju geometrijsko područje primajući informacije preko ruku i očiju koje usmjerava njihov um (Johnston-Wilder, Prim, 2004).
122
Dj. Takaci, I. N. Dimovski: Animations made in matlab and their application for didactic purposes
U nastavi matematike funkcionalno je razmišljanje osobito važno. Vrlo često postoji potreba za prikazom dinamičkih procesa koje je potrebno objasniti pomoću dinamičkih sredstava, pomoću prezentacija u kojima su prikazani pokreti – animacije.
DINAMIČKE MATEMATIČKE SITUACIJE Sljedeći primjer pokazuje kako se prikaz dinamike matematičke situacije može postići uz pomoć statičkih multimedijalnih alata. Primjer 1. Analizirajući sljedeći problem: "Odredite sjecišta hiperboloida
z2 x − y − =1 4 2
2
s ravninom x = d, ovisno o vrijednosti konstante d ", može se vidjeti grafički prikaz napravljen jednostavnim kodom u MATLAB-u. Slika 1. Koristeći parametrizaciju hiperboloida, u MATLAB-u se mogu iskoristiti funkcije meshgrid and surface kako bi se stvorili grafički prikazi kao na slici 1. a=2;b=1;c=1; u=-4:0.1:4; v=0:0.05:3.15; [U,V]=meshgrid(u,v); z=a*sinh(U).*cos(V); y=b*sinh(U).*cos(V); x=c*cosh(U); h=surface(x,y,z); h1=surface(-x,y,z); view(38,54) MATLAB code. 1.
Dinamika se može postići prikazom sjecišta elipsa za različite vrijednosti parametra d. U MATLAB-u, funkcija plot3 za povećanje može se koristiti kako bi se dobile elipse prikazane na slici 1.
123
Croatian Journal of Education Hrvatski časopis za odgoj i obrazovanje
Vol: 13 (1/2011) page: 99-137
t=0:0.05:6.3; for d=-27:2:-1 d1=sqrt(d^2-1); z1=2*d1*cos(t); y1=d1*sin(t); x1=0*t+d; plot3(x1,y1,z1,'k','LineWidth',1) plot3(-x1,-y1,z1,'k','LineWidth',1) end MATLAB code. 2.
Ukoliko posjedujemo MATLAB kod za stvaranje ovog grafičkog prikaza, zapravo uopće nije teško eksperimentirati s različitim vrijednostima parametra d. Time je omogućena primjena nastavnih metoda koje omogućuju funkcionalno razmišljanje kod studenata i istodobno stvaranje nekoliko različitih situacija koje upućuju studente na traženje veza između formula i dobivenih rezultata, zadatak koji bi i oni sami lako izveli, i ono što se realno događa u 3D okruženju. Na primjer, nakon rješavanja sustava: 2 z2 2 =1 x − y − 4 x = d
važno je pitati što s geometrijskog stajališta znači rješenje ovog sustava prikazanog jednadžbom:
y2 z2 + =1 d 2 − 1 4 ( d 2 − 1) Opis oblika i položaja elipse, ovisno o vrijednosti parametra d, ne može se ostvariti pomoću formalnog znanja. Predstavljeni grafički prikaz može uvelike pomoći studentima da vide oblik i položaj elipse i verbalno opišu vrstu nastale elipse, na primjer, za sljedeće vrijednosti: d = 10 i d = -10. Studenti čak mogu dobiti zadatak skicirati ovu vrstu elipse u 2D koordinatnom sustavu čije osi su y i z, a zatim protumačiti na koju udaljenost od yz-ravnine će ova elipsa, zajedno s ravninom x = d, biti postavljena paralelno s njom.
124
Dj. Takaci, I. N. Dimovski: Animations made in matlab and their application for didactic purposes
Studenti bi zapravo trebali razumjeti uvjet za sjecište između dvoplošnog hiperboloida i ravnine: |d| > 1. U tu su svrhu pitanja poput "Što će se dogoditi ako je d = 0 ili d = ½?" iznimno korisna. Uz ovu vrstu pitanja studenti mogu biti dovedeni u situaciju da probleme rješavaju interpretirajući jednadžbu kada je d = 0: 4y2 + z2 = −4, koju ne zadovoljava ni jedan uređeni par realnih brojeva i dovedu u kontekst s nepostojanjem sjecišta danog hiperboloida i yz-koordinatne ravnine i relativno lako vizualiziraju ovaj zaključak. Interakcija Kako bi se ova očita veza mogla brzo i precizno vizualizirati, isti MATLAB kod može se koristiti tako da se promijene vrijednosti parametra d i rotira prikaz. To znači da se u stvarnoj učionici, integracijom navedenih obrazovnih materijala u stvarni nastavni proces, može postići određeni stupanj interakcije između studenata i obrazovnih računalnih programskih paketa. Sljedeći kod pokazuje način na koji se kod 2 može promijeniti kako bi se prikazala situacija u kojoj, umjesto prikaza svih elipsi sa slike 1, možemo uvesti jednu odabranu vrijednost parametra d, nakon čega će MATLAB načiniti grafičke prikaze, s prikazanim rješenjem problema iz primjera 1 za određenu vrijednost parametra d . d=input('Enter value for the constant d: ') d1=sqrt(d^2-1); z1=2*d1*cos(t); y1=d1*sin(t); x1=0*t+d; hold on plot3(x1,y1,z1,'k','LineWidth',1) MATLAB code. 3.
125
Croatian Journal of Education Hrvatski časopis za odgoj i obrazovanje
Vol: 13 (1/2011) page: 99-137
DINAMIČKI MULTIMEDIJSKI ALATI Animacije izrađene u MATLAB-u Kako bi studenti usvojili temeljna znanja o funkcijama i njihovim svojstvima, potrebno je razviti osjećaj o utjecaju promjena ulazne vrijednosti na izlaznu vrijednost, kao i na geometrijska tumačenja, i sve što funkcija ili limes, derivacija, integral i slično znače u matematičkom modelu, gdje su neke stvarne situacije opisane odabranom funkcijom. U primjeru 1. opisani su neki "trikovi" kako se mogu oponašati određene dinamičke matematičke situacije pomoću statičkih multimedijalnih alata. Tumačenje 3D vektorske funkcije kao modela kretanja čestica i njegove derivacije kao tangencijalnog vektora krivulje koja je putanja opisana navedenim kretanjem čestica i vektorom brzine kretanja, onda je druga derivacija te funkcije ubrzanje istog kretanja itd. je vrlo teško objasniti pomoću statičkog grafičkog prikaza, a gotovo nemoguće pomoću tradicionalnih metoda poučavanja (Thomas, Weir, Hass, Giordano, 2007). Korištenje MATLAB-a u nastavi matematike može se činiti riskantnim zbog poteškoća računalnog programiranja. No, matematika je jedan od prvih školskih predmeta u kojemu su se koristila računala u nastavi. To ne čudi jer su prva digitalna računala prvenstveno razvijena za rješavanje diferencijalnih jednadžbi. Mnogi su ljudi uvjereni da računalno programiranje može osigurati vrijedan put u učenju matematike (Sutherland, 2007). MATLAB nudi vrlo jednostavan i zanimljiv način stvaranja animacija pomoću kojih se mogu opisati dinamičke osobine funkcija. Bit izrade takvih animacija je u stvaranju velikog broja statičkih slika u kojima većina objekata ostaje nepromijenjena, a samo se nekolicina mijenja. Svaka slika predstavlja jedan okvir. Niz takvih okvira pohranjen je u tzv. matrici filma koja se može očuvati kao zasebna datoteka. Zatim, s jednostavnim MATLAB kodom može biti prikazana animacija učitavanjem matrice filma, postavljanjem statičkog dijela grafičkog prikaza i izdavanjem naredbe za prikazivanje filma. Stvorena animacija može se eksportirati kao film, odnosno videodatoteka u .avi formatu. Takav način stvaranja animacija može se koristiti u didaktičke svrhe. Koordinatni sustav je određen, pogled je postavljen (azimut i povišenje), statički
126
Dj. Takaci, I. N. Dimovski: Animations made in matlab and their application for didactic purposes
i geometrijski objekti su nacrtani, a dinamika se oponaša promjenom oblika i/ili položajem pokretnih objekata. Svaka promjena vodi se kao okvir, a zatim se stvara animacija čitanjem matrice koja je nastala na taj način. Kako bi se ostvarili ciljevi poučavanja povezani s, na primjer, prikazanim primjerom tumačenja vektorske 3D funkcije kao gibanja čestice, može se koristiti sljedeći zadatak: Primjer 2. Vektorska funkcija
r ( t ) = (1 + t ) i +
t2
j+
t3 k pokazuje 3
2 položaj čestice koja se kreće u 3D prostoru i vremenu t. Nađi vektor brzine ove čestice u vremenu t=1. Da bi se postigla dinamika, predlaže se postavljanje pitanja: kako bi isti problem izgledao kada bi umjesto t = 1, uzeli drugu vremensku koordinatu, ili na koji bi se način promijenila brzina vektora kada bi se vrijeme neprekidno mijenjalo od 0 do 2,5? Ovo je klasična matematička situacija gdje je dinamika u samoj prirodi problema. Kako bi pokazali gibanje čestice koja je opisana navedenom vektorskom 3D funkcijom i promjenom brzine vektora: v ( t ) = i + 2 tj + t 2 k
koji se javljaju s promjenom vremena t u intervalu [0, 2,5], krivulja se može jednom nacrtati - putanja kretanja, a položaj čestice i vektor brzine mogu se izračunati za različite vrijednosti ulaznog parametra t. Kako bi se prikazalo kretanje, dovoljno je konstruirati particiju intervala [0, 2,5] na 25 podintervala sa zadanim korakom od 0,1. Na taj se način može proizvesti 26 okvira pohranjenih u matrici filma i kasnije se može napraviti animacija koja će se prikazati nakon rasprave o tome što se događa kada se promjeni ulazni parametar t. % 2. Creating the movie matrix M2 for s=1:26 steps=2*s+1; figure(1) hold on set(1,'Position',[100,50,800,600]) grid on;axis equal;axis([-1, 4, -2, 8, 0, 10]);view(30,18) r=[x(steps),y(steps),z(steps)]; plot3(r(1),r(2),r(3),'bo')
127
Croatian Journal of Education Hrvatski časopis za odgoj i obrazovanje
Vol: 13 (1/2011) page: 99-137
plot3(x,y,z,'LineWidth',1.5) T=[x1(steps),y1(steps),z1(steps)]; T1=r+T; plot3([r(1),T1(1)],[r(2),T1(2)],[r(3),T1(3)],'r','LineWidth',2.5) xlabel('x');ylabel('y');zlabel('z'); M2(s) = getframe; close(1) end save M2 MATLAB code. 4.
Ovo je prikazano u prethodnom kodu gdje je ključna naredba getframe pomoću koje se sprema svaki okvir u matrici filma M2, a dolazi nakon naredbe save i sprema se kao zasebna .mat datoteka s tim imenom. U nastavnoj praksi studentima se može prikazati samo izvršenje sljedećeg koda: clear all;clc load M2.mat M2 figure(1) set(1,'Position',[100,50,800,600]) axis equal axis([-1, 4, -2, 8, 0, 10]);view(30,18) movie(M2,1,4); MATLAB code. 5.
čime se praktično stvara animacija vezana uz zadatak iz primjera 2. Slika 2. Ovo je jedan od načina kako se takav dinamičan multimedijski alat može integrirati u nastavni proces.Vrlo je važno prepoznati da se s ovakvom vježbom može izbjeći formalno znanje, jer osim što tražimo od studenata da primijene formalna pravila pri razlikovanju vektorske funkcije i "recitiraju napamet" da se radi o vektoru brzine kretanja čestica, pomoću ove vježbe studenti mogu dobiti percepciju o tome što se stvarno događa i kako je diferencijacija u izravnoj vezi sa stvarnim događajima. Korištenjem preciznije particije intervala dobiju se točniji okviri, što znači da se može izraditi bolja animacija.
128
Dj. Takaci, I. N. Dimovski: Animations made in matlab and their application for didactic purposes
Film Kada je riječ o modernoj nastavi matematike, u suvremenom informacijskom društvu temeljenom na znanju treba uzeti u obzir da integracija obrazovnih materijala u nastavi nije ograničena samo na određene nastavne situacije u stvarnoj učionici. Dakle, postavlja se pitanje kako studentima omogućiti pristup multimedijskim alatima, ne samo tijekom nastave, već i nakon nastave, pa čak i neovisno o nastavi (u učionici), i u virtualnom nastavnom prostoru (sustavi za upravljanje e-učenjem) (Mirchev, Aleksov, 2005), (Tuparov, Dureva, 2005). MATLAB nudi mogućnosti za stvaranje animacija koje se eksportiraju kao film, točnije kao datoteka u . avi formatu. Nakon toga ova datoteka može se koristiti posve neovisno od MATLAB aplikacije. Stvaranje. avi datoteke Ako je, na primjer M2 matrica filma, može se spremiti kao M2.mat datoteka i učitati u bilo koje vrijeme pomoću jednostavne naredbe: load M2.mat M2. Za prikazivanje same animacije dovoljno je koristiti sljedeću naredbu: movie(M2, 1, 4). Parametar 1 znači da animaciju treba prikazati jednom, dok parametar 4 označava broj okvira prikazanih u sekundi. Pomoću naredbe movie2avi (MTP, 'TangentToCurve', 'fps', 4) stvorena je TangentToCurve.avi datoteka koja se može pregledati pomoću bilo kojeg playera koji podržava ovu vrstu datoteke. Procesiranje i konvertiranje. avi datoteka Posljednjom naredbom stvoren je film čime je omogućeno gledanje animacije prikazane u primjeru 2 neovisno o MATLAB-u. http://www.eucitel.net/vismath/vid26.wmv Takva datoteka može se uređivati pomoću uobičajenih aplikacija za obradu videodatoteka, kao što je na primjer Windows Movie Maker. Potrebno je komprimirati videodatoteku kako bi se učitala na Internet.
129
Croatian Journal of Education Hrvatski časopis za odgoj i obrazovanje
Vol: 13 (1/2011) page: 99-137
Mi smo učitali kompilacije takvih videodatoteka stvorenih u MATLAB-u za potrebe istraživanja. http://www.youtube.com/watch?v=Y9LVIaO8yP4 Izrada ove vrste nastavnih materijala ne može se razmatrati neovisno od pitanja kako se koristiti takvim materijalima u didaktičke svrhe. Stoga je ovaj prikaz usmjeren k tehnikama poučavanja koje pomažu integrirati spomenute obrazovne materijale u nastavni proces. Razvoj dinamičkih matematičkih situacija, osim prethodno opisanih metoda, može se postići stvaranjem didaktičkog sustava matematičkih problema koji se mogu dalje razvijati u različite oblike poučavanja. Među navedenim oblicima nastave je i projektna nastava, organizirana putem sustava za upravljanje e-učenjem. Na primjer, slika 3 prikazuje nekoliko animacijskih okvira koji se bave problemom primjene parcijalne derivacije i problemom tangencijalnih ravnina datih površina. Slika 3. Sama animacija, kao i još 25 videodatoteka, pripremljenih za potrebe projektne nastave opisanog istraživanja, može se vidjeti na internetskoj stranici: http://www.e-ucitel.net/vismath/vid22.wmv
METODOLOGIJA ISTRAŽIVANJA Cilj istraživanja Glavni je cilj istraživanja: o određivanje stupnja učinka primjene metoda vizualizacije temeljenih na teorijskim osnovama matematičke didaktike i integriranog pristupa primjene informacijsko-komunikacijskih tehnologija u nastavi matematike u odnosu na kvalitetu znanja studenata s obzirom na odabrane nastavne sadržaje. Navedeni sadržaji uključuju funkcije, osobito vektorske funkcije i funkcije s više varijabli, zatim njihova svojstva, kao i trodimenzionalnu analitičku geometriju - krivulje i površinu.
130
Dj. Takaci, I. N. Dimovski: Animations made in matlab and their application for didactic purposes
Sljedeći će ciljevi biti postignuti ovim istraživanjem: o izrada obrazovnih materijala u elektroničkom obliku koji omogućuju učenicima da nauče funkcije i njihova svojstva pomoću interaktivnih računalnih alata, integriranih u sustav upravljanja e-učenjem o izrada instrumenata koji mogu mjeriti utjecaj primjene metoda vizualizacija na kvalitetu ključnih znanja. Očekivani rezultat istraživanja je potvrda pretpostavke da metode vizualizacije temeljene na teoretskim osnovama matematičke didaktike i integrirani pristup primjene informacijskih i komunikacijskih tehnologija u nastavi matematike imaju značajan utjecaj na kvalitetu znanja studenata i da prilično pozitivno utječu na konstruktivna psihološka iskustva studenata tijekom studija matematike. Sudionici istraživanja Istraživanje je provedeno tijekom 2009./2010. akademske godine. U istraživanju je sudjelovala skupina od 30 studenata sa Sveučilišta informacijskih znanosti i tehnologije, "Sv. Apostol Pavle" u Ohridu, u Makedoniji. Tijekom prvog semestra nastava iz predmeta Matematika 1 izvedena je primjenom klasičnog pristupa. Rad i rezultati studenata analitički su promatrani. Prije početka drugog semestra odvojeni su sadržaji koji su definirani kao temeljna znanja o funkcijama s jednom varijablom i 2D analitičkom geometrijom. Zatim je razrađena strategija o tome kako putem analogije razviti slične koncepte koji se odnose na vektorske funkcije, funkcije nekoliko varijabli i 3D analitičku geometriju, koje su dio kolegija Matematika 2. Prethodno znanje učenika u svezi s navedenim temeljnim znanjem izmjereno je pomoću "dijagnostičkog testa". Nakon izvođenja inovativne nastave, ponovnom uporabom analogije, primijenjen je „ponovljeni test ". Nakon usporedne analize rezultata "prije" i "poslije" doneseni su zaključci o stupnju utjecaja primjene informacijske tehnologije na znanje studenata o funkcijama.
131
Croatian Journal of Education Hrvatski časopis za odgoj i obrazovanje
Vol: 13 (1/2011) page: 99-137
Metode i tehnike inovativne nastave Faza izvedbe nastave je središnja i najduža faza ovog istraživanja. Ono što se doista događalo u učionicama je zapravo generator očekivanih promjena. Inovacije u nastavi odnose se na izvedbu klasične nastave pomoću krede i ploče, obogaćene primjenom informacijske i komunikacijske tehnologije, posebice integracijom multimedijskih alata stvorenih u MATLAB-u tijekom nastavnog procesa. Naglasak je stavljen na sadržaje koji su izravno povezani sa znanjem koje je u fazi predistraživanja definirano kao temeljno s obzirom na funkcije s više varijabli i trodimenzionalnu analitičku geometriju. Na taj je način stvoren izbor od 6 nastavnih jedinica, sastavljenih od nastavnih sati, tijekom kojih se intenzivno primjenjivala inovativna nastava. To znači da je s ovim izborom 6 nastavnih jedinica, primjenom inovativnog pristupa, organizirano 18 nastavnih sati koji pokrivaju 40% cjelokupnog nastavnog vremena. Za svaku od 6 nastavnih jedinica jedna je prikladna tema izabrana i razvijena pomoću inovativnog pristupa. 1. Pravci i ravnine u prostoru 2. Cilindri i kvadratne površine 3. Vektorske funkcije 4. Funkcije nekoliko varijabli 5. Tangencijalne ravnine 6. Dvostruki integrali. Važno obilježje inovativnog pristupa je da je za svaku od ovih tema razvijen didaktički sustav matematičkih problema, tako da je za svaki zadatak pripremljena odgovarajuća vizualizacija- grafički prikaz ili animacija izrađena u MATLAB-u. To znači da su, umjesto uopćenog pojednostavljenog crteža koji u klasičnoj nastavi prilično grubo prikazuje opće stanje, u opisanom pristupu posebno dizajniran grafički prikaz ili animacija kako bi se prikazala konkretna matematička situacija na koju se zadatak odnosi. Didaktički sustav nastavne jedinice 1. Pravci i ravnine u prostoru sastoji se od 31 zadatka od kojih su 22 izrađena uz pomoć pripremljenih nastavnih materijala, dok je 9 zadataka predviđeno za individualni rad. Za nastavnu jedinicu 2. Cilindri i kvadratne površine pripremljena su 22 odgovarajuća programa u MATLAB-u, namijenjena za određene matematičke situacije, što čini 22 zadatka od ukupno 32. Preostalih 10 zadataka su kviz-pitanja.
132
Dj. Takaci, I. N. Dimovski: Animations made in matlab and their application for didactic purposes
Nastavne jedinice 3-6 odnose se na sadržaje kod kojih je naglašena dinamička priroda problema. Stoga je posebna pažnja posvećena primjeni dinamičkih multimedijskih alata. Vektorske funkcije razvijene su intenzivnom uporabom 20 animacija i grafičkih prikaza u MATLAB-u. Didaktički sustavi zadataka odnose se na nastavnu jedinicu 4. Funkcije nekoliko varijabli i sastoje se od 30 zadataka od kojih je 18 razvijeno pomoću grafičkih prikaza i animacija, a kod nekih su zadataka korištena 2 pristupa - dvodimenzionalni (s obzirom na domenu funkcije) te trodimenzionalni koji se odnose na grafički prikaz funkcije s 2 neovisne varijable. Preostalih 12 zadataka odnose se na tehnička rješenja za određivanje limesa takvih funkcija. Tangencijalne ravnine ponovno su vješto razvijene uporabom niza animacija povezujući parcijalne derivacije funkcije dviju varijabli i pravi trodimenzionalni prikaz. Ovaj se didaktički sustav sastojao od 6 zadataka s odgovarajućim animacijama i grafičkim prikazima pripremljenim za svaki zadatak. Posljednja nastavna jedinica 6. Dvostruki integrali razvijena je uporabom didaktičkog sustava s 19 zadataka. Odgovarajući obrazovni materijali razvijeni u MATLAB-u odnose se na dvodimenzionalnu vizualizaciju u području integracije, kao i trodimenzionalnu vizualizaciju tumačenja dvostrukog integrala kao volumen, te vizualizaciju Riemannovog zbroja funkcija dviju varijabli. Dakle, 40% nastave ostvareno je pomoću ovog inovativnog pristupa. U tu svrhu korišteno je 138 matematičkih zadataka sustavno organiziranih i sistematiziranih u 6 nastavnih jedinica. Za 107 takvih zadataka korišteni su multimedijski alati – grafički prikazi i animacije dizajnirani u MATLAB-u. Ovi su alati integrirani u nastavni proces tako da je za svaku određenu situaciju prikazana odgovarajuća vizualizacija, ali i pomoću pažljivo odabranih pitanja razvijena je rasprava o tome što bi se dogodilo kada bi neki parametri bili promijenjeni; stoga je MATLAB korišten na licu mjesta kako bi se prikazale navedene promjene. Na taj je način postignuta interakcija između studenata i multimedijskih alata koji su rabljeni kao obrazovni alati. U svakoj situaciji, kada je to bilo moguće, dinamička priroda određenog problema ili matematičke situacije vizualizirana je pomoću odgovarajuće animacije.
133
Croatian Journal of Education Hrvatski časopis za odgoj i obrazovanje
Vol: 13 (1/2011) page: 99-137
Mjerenje utjecaja inovativnih metoda i tehnika. Instrumenti Osnovni je cilj dijagnostičkog testiranja dobiti relevantne podatke o prethodnom znanju studenata, kako bi se izvršila komparativna analiza znanja koje su studenti usvojili po završetku provedenog istraživanja. Imajući u vidu da je jedan dio nastave, na koji se odnosi ovo istraživanje, povezan s funkcijama nekoliko varijabli, vektorskih funkcija i trodimenzionalnom analitičkom geometrijom, tada se prethodno znanje odnosi na funkcije jedne varijable i dvodimenzionalnu analitičku geometriju. Osnovna pitanja na koja se odnosi ovo istraživanje mogu se razumjeti pomoću analogije funkcija jedne varijable i dvodimenzionalne analitičke geometrije, dakle, i sama komparativna analiza odnosi se na uspoređivanje rezultata ovog područja s rezultatima iz području analogije. Imajući u vidu izbor sadržaja koji su postavljeni kao temeljno znanje o funkcijama jedne varijable, dijagnostički test je dizajniran kako bi se provjerilo znanje studenata koje se odnosi na sljedećih 5 kategorija: 1. limes funkcije u danoj točki i neprekidnost realne funkcije jedne varijable 2. grafovi i svojstva funkcija jedne varijable 3. diferencijabilnost, derivacije funkcije s jednom varijablom i geometrijsko tumačenje derivacije 4. određeni integral 5. dvodimenzionalna analitička geometrija- krivulje drugog reda. Nakon utvrđivanja kategorija pokazatelji su podijeljeni prema kategorijama. U Tablici 1 prikazan je pregled pitanja prema kategorijama. Tablica. 1. Nakon realizacije nastave pomoću inovativnog pristupa provedena su mjerenja s obzirom na promjene u znanju studenata kako bi se mogli izvesti određeni zaključci o utjecaju informacijskih i komunikacijskih tehnologija na znanje studenata o funkcijama. Budući da je cilj i predmet ispitivanja određen, slijedilo je konstruiranje instrumenata, a znanje je provjereno nakon što su provedene aktivnosti vezane uz istraživanje. Ovaj se instrument naziva
134
Dj. Takaci, I. N. Dimovski: Animations made in matlab and their application for didactic purposes
ponovljeni test, jer je dizajniran na vrlo sličan način kao i dijagnostički test i u potpunosti je prilagođen cilju, odnosno mjerenju promjene razine temeljnih znanja studenata do koje je došlo tijekom istraživanja. Stoga je ponovljeni test dizajniran na način da mjeri znanje studenata prema sljedećih 5 kategorija: 1r. Limes funkcije dviju varijabli u danoj točki i neprekidnost realne funkcije dviju varijabli; 2r. Domena, doseg i graf funkcije dviju varijabli; 3r. Diferencijabilnost tangenta krivulje i tangencijalna ravnina 3D površine 4r. Dvostruki integral; volumen 5r. Trodimenzionalna analitička geometrija- pravac, ravnina i površine drugog reda. Nakon utvrđivanja kategorija indikatori su podijeljeni prema kategorijama. U Tablici 2 prikazan pregled pitanja prema kategorijama. Tablica 2.
REZULTATI Prosječan rezultat dobiven za 30 promatranih studenata na dijagnostičkom je testu iznosio 41% uz standardnu devijaciju od 14,8. Prosječan rezultat istih 30 studenata na ponovljenom testu bio je 64,8% uz standardnu devijaciju od 14,4. Očita razlika u korist ponovljenog testa potvrđena je t-testom za jednakost matematičkih očekivanja. Statistička nul hipoteza je provjerena: E(X) > Е(Y) gdje je X slučajna varijabla " rezultat studenta na dijagnostičkom testu", Y slučajna varijabla "rezultat studenta na ponovljenom testu", E (X) i E (Y) su matematička očekivanja, suprotno alternativnoj hipotezi: E (X)