ANOVA with EXCEL. Retrieved from http://org.elon.edu/econ/sac/anova.htm on 9/
2/2009. A. Overview of ... B. Step-by-step instructions for doing ANOVA in Excel.
ANOVA with EXCEL Retrieved from http://org.elon.edu/econ/sac/anova.htm on 9/2/2009 A. Overview of ANOVA B. Step-by-step instructions for doing ANOVA in Excel C. Interpreting your Excel output
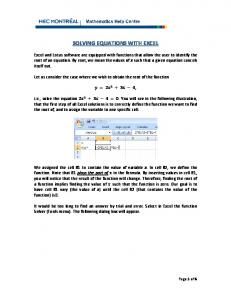
A. OVERVIEW OF ANOVA In statistics, we often want to know if the means of two populations are equal. For example, do men and women earn equal wages on average? This is an easy thing to test using a two-sample t-test for the equality of means. The problem with that test is we cannot deal with more than two populations. What if we want to know whether Blacks, Latinos and Whites earn the same wages on average? To answer a question like this, we need to use ANOVA. ANOVA means analysis of variance. Of course, variance is a measure of dispersion, not central tendency (like the mean). So, why do we analyze the variance in order to test to see if the means of three or more groups are equal? Remember, sample means will differ for two reasons. One, due to random sampling error, we cannot expect multiple sample means to be exactly equal even if the groups really do have the same population means. So, if the sample means differ only because of mere sampling error, we expect those sample means to be "pretty close." If they are "not very close", then we would conclude that the populations means really probably are different. Thus, the variance in the sample means will provide a way of testing whether the sample means are "close enough" or not. If the variance between the groups is relatively small, then we conclude that the sample means are equal. If the variance between the groups is large, we will conclude they are not equal. B. DOING ANOVA IN EXCEL Consider the following example. In a study reported in the Journal of Small Business Management, self-employed individuals were asked to report their degree of job-related stress. They were asked 15 questions about their work and they responded on a 1-5 scale as the amount of stress they felt. These responses were added up in order to come up with a numeric measure of job stress (15 being the minimum stress and 75 the maximum stress). Below is the Excel file with 3 of the groups' data: Real Estate Agent, Architect and Stockbroker.
1
In this case, we have what we call a "one-way ANOVA." That is, there is one factor (stress) we are looking at across these 3 groups. Step 1: State the null hypothesis. The null hypothesis in ANOVA is that the means of the groups are equal. In other words,
If the null hypothesis is true, it means that these 3 groups are all from the same population. In other words, these 3 groups with their different sample means simply represent 3 points on the same sampling distribution. If the hypothesis is true, then the "between group variance" will be equal to the "within group variance." The "between group variance" (or Mean Square due to Treatments or MSTR) is an estimate of the variance of the population if the null hypothesis is true. We find it by calculating the variance between the 3 sample means, using the mean of ALL the observations as the estimate for the population mean. the "within group variance" (or Mean Square Error or MSE) is an average of the 3 actual sample variances found. If the null hypothesis is true, the "between group variances" must be equal (close to) to the "within group variances." The test statistic in this case is an F, where F is defined to be the ratio of the two variances (between and within).
2
Step 2: Choose a critical value (e.g., .05, .10) for your test. Step 3: Calculate the F statistic using Excel's Data Analysis. Click on TOOLS and choose DATA ANALYSIS. Under DATA ANALYSIS, choose the appropriate type of ANOVA:
There are 3 types used in Excel. "Single factor" ANOVA is the same as "one-way" ANOVA. That is what we have in this example, since we are only considering one factor (Stress) across these groups. Excel can handle any number of groups as long as they are in columns. After choosing "ANOVA: Single Factor" you will see
In "Input Range" highlight the entire range of data. Be sure to include the labels (row 1) and click on "Labels in First Row." Specify your critical level (see Step 2). Finally, clicking on "OK" will produce the following results:
3
C. INTERPRETING YOUR EXCEL OUTPUT As we can see, the mean level of stress reported by real estate agents (67.73) is higher than that of either stockbrokers (65.8) or architects (61.33). But are these differences statistically significant? According to the test result F = 1.19. With a critical value of .05, the critical F = 3.219. Therefore, since the F statistic is smaller than the critical value, we fail to reject the null hypothesis. Remember from above, the null hypothesis was that all 3 of these groups' means were equal. So, we fail to reject that real estate agents, stockbrokers and architects have the same level of job-related stress. Apparently, the differences we saw in this sample were simply due to random sampling error.
4