Apidologie 31 (2000) 67–79 © INRA/DIB/AGIB/EDP Sciences
67
Original article
Colony evaluation is not affected by drifting of drone and worker honeybees (Apis mellifera L.) at a performance testing apiary Peter NEUMANNa,b, Robin F.A. MORITZb*, Dieter MAUTZc a
Department of Zoology and Entomology, Rhodes University, Grahamstown 6140, South Africa b Molekulare Ökologie, Institut für Zoologie, Martin-Luther-Universität Halle-Wittenberg, Kröllwitzerstr. 44, 06099 Halle/Saale, Germany c Bayerische Landesanstalt für Bienenzucht, Burgbergstr. 70, 91054 Erlangen, Germany (Received 12 February 1999; revised 23 August 1999; accepted 14 September 1999)
Abstract – The impact of drifting workers and drones on evaluating performance data of honeybee (Apis mellifera carnica) colonies was studied using DNA microsatellites. Colony size, honey yield and colony level of infestation with Varroa jacobsoni were evaluated from 30 queenright colonies. Individuals (n = 1359 workers from 38 colonies, n = 449 drones from 14 colonies) were genotyped using four DNA microsatellite loci. Maternity testing was used to identify drifted individuals. The drifting of workers ranged from 0 to 14% with an average of 5 ± 0.7%. The amount of drifting drones was significantly higher ranging from 3 to 89% (average of 50 ± 6.8%). No significant correlations were observed between the amount of drifting and colony sizes. Likewise, the correlations between drifting workers and drones with the phenotypic variance for colony honey yields and levels of infestation with V. jacobsoni were weak and in no case significant. Thus, the low levels of drifting workers (due to performance apiary layout) and the high levels of drifting drones did not interfere with performance testing in this study. Apis mellifera / drifting / honeybee / performance / Varroa jacobsoni
1. INTRODUCTION Performance testing of colonies is routinely used to evaluate success of breeding programs. However, honeybees may leave * Correspondence and reprints E-mail:
[email protected]
their own nest to join another colony as a result of drifting [3, 44]. This may interfere with the results of the performance testing because drifting has been suggested to have an impact at the colony level [39].
68
P. Neumann et al.
Drifting of worker and drone honeybees in commercial apiaries has been studied in some detail and depends on a broad variety of environmental, apiary layout and colony factors. Wind [18] and the position and apparent movement of the sun [5, 24, 32, 38, 52] are important for the number and destination of drifting bees. Likewise, the apiary layout [12, 13, 18–21] may reduce or promote drifting behavior. For example, the coloration of the hive has been shown to reduce drifting [12, 13, 19, 44]. For the drifting of drones the queenstate of the colony [7, 8] must be considered too. The arrangement of colonies is among the most important factors [19–21, 32]; e.g. there is particularly strong drifting of workers [13, 18–21] and drones [32] into colonies which were placed at the ends of rows.
worker drifting from colony with high levels of infestation with the ectoparasitic mite V. jacobsoni.
Highly plausible assumptions and speculations have been made addressing the potential effects of drifting honeybees on the colonial phenotype [e.g. 6, 21, 28, 30, 41]. However, only few studies address the phenotypic impact of drifting in an experimentally controlled design. Unfortunately, these more detailed studies often yield contradictionary results. For example, whereas some authors found that drifting has an impact on the honey yield or on foraging efficiency [34, 45] others do not find such effects [23, 25, 31]. The potential role of workers and drones as vectors of various parasites and pathogens has also been repeatedly discussed [5, 21, 28, 30, 41]. Drifting honeybees may carry the pythopathogenic BBLMV virus [2], Penibacillus larvae spores [15] or Tropilaelaps clareae mites [42]. Observations of long-range drifting of 800 m [9, 33] and more [921 m in A. m. capensis; Neumann & Hepburn (unpublished data)] may indicate that diseases can be spread between apiaries and through whole populations. However, the quantitative impact of drifting on colonial phenotypes remains obscure. Only a weak impact of drifting on the spread of American foulbrood disease was found [16], whereas another author [50] reported increased
In this paper we quantify the number of drifting workers and drones using DNA microsatellite maternity testing [37]. To evaluate the potential interactions of drifting and colonial phenotypes these results are combined with colony levels of infestation with Varroa jacobsoni, honey yields and colony sizes.
Most studies on drifting of honeybees use various labeling techniques of drones and workers [e.g. 3, 54] which may interfere with honeybee behavior. Morphological characteristics are not appropriate because it has been shown that races differ in the drifting behavior of workers and drones [46, 47]. Obviously, radioactive labeling of honeybees [51] does not interfere with behavior. However, legal constraints and environmental disadvantages prevent a wide usage of this technique. Therefore, studies addressing this question using biochemical [17] or DNA markers [32] have the important advantage of not interfering with either honeybee behavior or the environment.
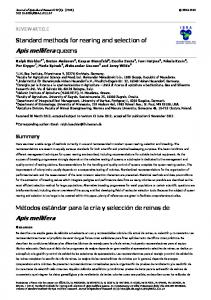
2. MATERIALS AND METHODS 2.1. Experimental design and sampling Thirty-eight queenright colonies of Apis mellifera carnica Pollmann were sampled at the performance testing apiary Schwarzenau, Germany (Fig. 1). Using different coloration of the hives, dense vegetation between the bee shelters and the special apiary layout (Fig. 1) we tried to follow some of the procedures suggested by [18–22, 31, 32 among others] to reduce the drifting of workers and drones. Obviously, we could not follow all suggested procedures to reduce drifting because this would interfere with the routine procedure of performance testing at this apiary. The row position of the colonies in the apiary was evaluated as
Performance testing and drifting of honeybees
69
Figure 1. Schematic map of the performance test apiary from which the samples were taken. The sampled colonies are black, numbered from 1 to 38 and clustered in groups of up to five different colored hives in bee shelters (rectangles) which are separated through dense vegetation of at least 18 m. Such an arrangement of hives follows some [19–21] but not all suggested procedures to reduce drifting of workers in apiaries. The direction of the flight entrances is indicated with black bars. All flight entrances are facing east (ellipses and irregulars = vegetation, rectangles = buildings).
defined by [32] to estimate whether the effects of hive arrangement on drifting are minimized or not. To ensure sufficient sample size after genotyping, at least 40 sexually mature drones and 40 adult workers were sampled from the outer frames of each colony (drones: n = 14 colonies; workers n = 38 colonies) on 08.06.1995. The colonies were sampled early in the morning from 6.00 a.m. to 9.00 a.m. before normal drone flight activity begins [27, 37, 47]. All colonies from which drone samples were obtained showed many drones by far exceeding the actual taken sample size. The samples were immediately stored in 75% EtOH and kept in a freezer until further DNA processing. 2.2. Performance data of colonies In 1994 and 1995 the phenotypes of 30 queenright colonies belonging to five
different breeding lines were determined by performance testing [1, Tab. I]. These colonies were headed by the same queens during the two-year testing period. Annual colony levels of infestation with the ectoparasitic mite Varroa jacobsoni were determined by counting the total number of dead mites in the hive after each of three treatments with the acaricide Perizin. The infection levels were obtained when the tested colonies were free of brood from mid to end of November. The total infection rate of the testing apiary was low in both years with levels of infestation for all performance tested colonies of 301 ± 97.5 and 504 ± 53,9 mites respectively. The honey yield was evaluated by weighing honey frames before and after honey extraction in early June and in mid July and by estimating residual winter honey stores. Colony sizes were estimated using the amount of sealed worker brood frames in May.
70
P. Neumann et al.
Table I. Performance data of the tested A. m. carnica colonies for the years 1994 and 1995 [1]. Only colonies were considered which were headed by the same queens during the two-year testing period (BL = breeding line, 1–10 = breeding line). Colony
1 2 3 4 5 6 7 8 9 10 11 14 15 16 18 18 19 20 21 23 24 25 26 28 29 32 34 35 37 38
Varroa infestation (number of mites)
Honey yield (kg)
BL
1994
1995
1994
1995
9 3 4 7 1 2 3 5 6 5 5 7 1 2 5 10 4 9 7 8 9 10 8 7 2 8 9 10 6 5
324 231 320 149 161 520 375 173 149 268 283 186 154 385 234 188 393 160 178 319 322 358 446 399 472 285 398 188 301 182
426 631 512 952 268 1355 432 388 110 492 559 1050 311 402 378 525 95 1039 175 417 375 1753 705 951 206 263 255 249 326 718
54.50 40.20 27.70 54.10 34.60 38.00 49.30 44.60 50.40 56.10 49.50 54.20 29.40 37.70 57.30 45.20 26.10 53.70 33.40 56.50 46.80 53.80 41.60 32.80 34.80 20.20 54.40 59.90 34.80 44.40
41.60 38.40 38.30 55.60 40.50 32.50 41.70 42.60 40.80 34.50 27.30 47.40 30.30 33.40 43.50 43.50 51.00 44.00 34.60 53.40 41.70 54.00 52.60 33.70 46.10 38.90 46.30 55.40 41.40 16.50
2.3. DNA isolation and genotyping DNA extraction was performed according to Neumann et al. [35, 36]. We used four DNA-microsa-tellites which have been developed by Estoup et al. [10, 11]. PCR of two pairs of loci (A43-B124, A76-A107) was multiplexed following the protocols of Estoup et al. [10, 11]. Amplification products were electrophorezed on standard 6% polyacrylamide sequencing gels with M13mp18 control DNA sequencing reac-
Colony size (brood frames) 1994 8 7 5.5 8 6 7 9 6.5 9 8 7 8 6 9 8 7 4 9 6.25 8 7 10 7 5.5 6.5 7 9 7 7 8
1995 8.5 8 7 9.5 8 7.5 9 8 9 8 6 10 7 7.75 9 8 8 9 7.5 10 7.5 10 10 6 7 6.5 9.5 9.5 8 6
tions run on the same gel as size standards. Microsatellite alleles were scored as fragment lengths in base pairs. 2.4. Genotype analysis The genotypes of the mother queens and the drone mates were derived from the genotypes of the sampled adult workers [11]. Since sister queens originated from the same mother we also used this pedigree information to determine the queens’ genotypes.
Performance testing and drifting of honeybees
Then, we identified drifted individuals using maternity testing [37]. If a worker or a drone had no allele in common with the putative mother queen genotype at one or more of the tested loci, the individual was considered to be a drifted individual. Undetected drifted individuals may cause errors. This non-detection error of drifted individuals is the probability that a drifted bee is genetically indistinguishable from the offspring of the host queen. This depends on the frequencies of the host queen’s alleles at each of the tested microsatellite loci. In order to estimate the non-detection error we followed the approach of [35] using the queen allele frequencies of the tested honeybee population. Data analysis We compared the amount of drifting workers and drones using a Mann-Whitney U-test. We calculated simple correlations (r-matrix) between the amount of drifting and colony size. Drifted individuals may act as vectors for mites and may have an impact on honey yields as well. Clearly, we can not give a precise forecast on the actual impact of these drifted bees on the phenotype of individual host colonies. For example, workers from a high performing colony may increase the honey yield of a low performing colony and vice versa. Given, drifting has any impact on the colony phenotype, we consider it is most likely that drifting increases the phenotypic variance within the performance tested breeding lines. Colonies which show high levels of foreign individuals should differ from the mean of the corresponding breeding line either in terms of increased or decreased performance. The tested breeding lines (n = 89 colonies) differed significantly in their levels of infestation with V. jacobsoni (ANOVA: p < 0.05) and in their honey yields (ANOVA: p < 0.001, data not shown for all colonies). In order to evaluate this potential effect of drifting on the colonial phenotypic variance
71
we tried to eliminate breeding strain and yearly variance effects for colony honey yields and levels of infestation with V. jacobsoni. For that purpose, we calculated for each colony and each phenotypic trait for both testing years: ∆2i =
(pij – pj )2
(1)
sdj
where i = colony j = corresponding breeding line pij = absolute phenotypic value of colony i pj = mean value of the corresponding breeding line sdj = standard deviation of the corresponding breeding line. Colony size has been shown to interfere with the honey yield [49] and with the population dynamics of V. jacobsoni [50]. Also in our data set (n = 89) colony size had significant effects on honey yields and a close to significant impact on levels of infestation with V. jacobsoni (data not shown for all colonies, simple correlation, r-matrix: r = 0.799, p < 0.0001 for honey yields and r = 0.354, p = 0.055 for levels of infestation with V. jacobsoni). In order to extract the impact of drifting on colony phenotype we calculated partial correlations (corrected for colony size 1994 and 1995) between our performance data and the drifting of drones and workers. Since the tested colonies were headed by the same queens during the testing period and the apiary layout (Fig. 1) was not changed, we assumed similar levels of drifting drones and workers in both years. The statistical calculations were done using the SPSS statistic package. 3. RESULTS Among the 1808 genotyped individuals (449 drones and 1359 workers) 70 drifted workers and 252 drifted drones were found (Tab. II). The drifting of workers ranged
72
P. Neumann et al.
Table II. Drifting of workers and drones for the 38 tested colonies (N = sample size of genotyped individuals). Drones Colony 1 2 3 4 5 6 7 8 9 10 11 12 13 14 15 16 17 18 19 20 21 22 23 24 25 26 27 28 29 30 31 32 33 34 35 36 37 38 x/Σ ± s.e.
Workers
Drift (%) N
27 63 3 29 38
14 20 39 20 13
69 65 89 71
43 35 42 42
60 23 29 81 56
42 33 45 30 28
50,2 6,8
449
Drift (%)
N
10 0 3 9 14 8 6 0 3 0 0 3 10 8 3 3 0 7 4 4 0 7 0 0 0 7 11 0 12 13 3 0 7 7 8 5 3 2
30 33 39 61 40 38 62 22 32 32 32 38 37 40 40 29 34 27 23 33 24 31 34 32 26 29 35 30 30 46 43 36 42 41 41 40 40 37
4,7 0,7
1359
from 0% to 14% with an average of 5 ± 0.7% (Tab. II). The amount of drifting drones reached from 3% to 89% with an average of 50 ± 6.8% (Tab. II). The non
detection error of drifted individuals as estimated from the queen allele frequencies (following [35]) of the tested honeybee population (Tab. III) was p = 0.0043 for drones and p = 0.0194 for workers. Drones drifted significantly more often than workers (Mann-Whitney U-test: U = 23, p < 0.0001). There was no significant correlation for the drifting of workers and drones with the row position (as defined by [32]; simple correlation, r-matrix; drones r = –0.25, p > 0.05; workers: r = –0.32, p > 0.05), indicating that the effect of rows is reduced for drones and workers. We could not find significant correlations for the amount of drifting drones and workers and colony size (Fig. 2). Likewise, no significant partial correlations (corrected for colony size 1994 and 1995) were found between the drifting of drones and workers and the performance data of the tested honeybee colonies. The phenotypic variance for colony honey yields (Fig. 3) and for levels of infestation with Varroa jacobsoni (Fig. 4) during the two year testing period were not significantly affected by the level of drifting bees. 4. DISCUSSION Our results show that drones drifted significantly more often than workers. Clearly, our estimates of drifting may be influenced by the various factors known to affect drifting in apiaries [7, 18–21, 24, 32 among others]. Moreover, we only deal with the adoption of foreign bees by host colonies. Population dynamics as a result of drifting involve adoption of new nest members as well as a loss of nest members. In long rows of hives the balance between loss and gain of bees is shifted. Colonies which are placed at the end of rows gain bees and colonies in more central positions loose bees due to drifting [13, 18–21, 32]. However, we found no correlation between the amount of drifting with the row position (as defined by [32]), indicating that the effect of rows on drifting of workers and [19] and drones [32]
Performance testing and drifting of honeybees Table III. Queen allele frequencies for the tested honeybee population (allele size in base pairs, n = sample size). Locus A76 Allele (bp) (n = 76) 209 231 239 243 249 251 255 259 261 265 267 271 277 281 283 287 291 295 299 305 313 343
0.09 0.01 0.03 0.01 0.01 0.12 0.03 0.04 0.03 0.03 0.08 0.05 0.04 0.01 0.08 0.08 0.01 0.01 0.08 0.03 0.09 0.04
Locus B 124 Allele (bp) (n = 76) 212 214 216 218 220 222 224 230
0.03 0.54 0.24 0.08 0.01 0.08 0.01 0.01
Locus A107 Allele (bp) (n = 76) 158 159 160 162 163 164 165 166 167 168 170 171 172 173 174 176 177 183
0.079 0.026 0.132 0.079 0.039 0.013 0.053 0.026 0.039 0.066 0.066 0.066 0.066 0.013 0.053 0.132 0.026 0.026
Locus A43 Allele (bp)
(n = 76)
126 127 140 142 146
0.039 0.395 0.513 0.013 0.039
is reduced due to apiary layout. Therefore, we do not expect substantial shifts between adoption and loss of bees in our sample. The non-detection error of drifted individuals was low as a result of the high degree of heterozygosity at the microsatellite loci used. Given larger colonies accept more drones, it might well be that the drifting of drones is
73
influenced by the size of the host colonies. But there was no significant correlation between colony size and the drifting of drones and workers in our sample. Using DNA markers we may have misinterpreted a few worker produced drones as drifted individuals. However, the presence of successfully reproducing workers in queenright colonies of European honeybee races is extremely rare due to worker policing [43]. In the experiments of [7] the acceptance of artificially introduced drones in colonies ranged from 8 to 88% which is congruent with our findings of naturally drifted drones. In our sample drones drifted significantly more often than workers. This supports the findings of [4, 13–14, 54] who also observed that drones drift more frequently than workers. We could certainly not support reports that drones drift less often than workers [3, 26, 28, 29]. Our results are consistent with findings that apiary layouts which significantly reduce the number of drifting workers [19–21] do not necessarily reduce the proportion of drones that drift [4]. The differences in the estimated amounts of drifting reported in different studies could vary with the sampling technique used [5] as well as with the method of evaluating the drifting [3, 32, 48]. The age of the drones at the time of the sampling [5], the apiary layout used [7, 20, 21], different environmental conditions such as a nectar flow [53], the topography of the study area [4] and the race [46, 48] may also be important to the final results. In all cases, only studies which simultaneously evaluate the drifting of drones and workers, such as Free [12] did, can provide comparable data. He found that the average amount of drone drifting is 2–3 times higher than that of workers. Our findings are consistent with [12] in principle, but we found 10 times more drifting drones which can be explained by the various factors influencing the amount of drift. Our data strongly suggest that the high levels of drifting drones have no significant effect on evaluating performance data.
74
P. Neumann et al.
A
B
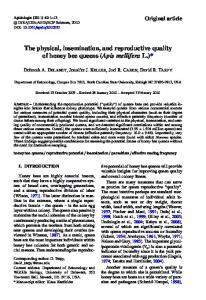
Figure 2. Colony size (measured as worker brood frames) and the amount of drifting drones and workers (A = drones; B = workers). No significant effects were found for both testing years (colony size 1994: drones r = –0.75, p > 0.05; workers r = –0.34, p > 0.05; colony size 1995: drones r = 0.18, p > 0.05, workers r = –0.34, p > 0.05). The figures show the overall data for both testing years. The overall correlations were also not significant (drones: r = 0.14, p > 0.05; workers: r = 0.47, p > 0.05).
A
B
Likewise, the impact of the low level of drifting workers on the tested colonial phenotypic traits was weak and in no case significant. Thus, although drifting of honeybees in commercial apiaries may result in problems for the beekeeper [22] this does
Figure 3. ∆2Honey (see Material & Methods) and amount of drifting drones and workers (A = drones, B = workers). No significant effects were found (partial correlations corrected for Colony size 1994 or 1995: ∆ 2 Honey 1994: drones r = < –0.01, p > 0.05, workers r = 0.21, p > 0.05; ∆2Honey 1995: drones r = 0.11, p > 0.05, workers r = 0.03, p > 0.05). The figures show the overall data for both test years. The overall partial correlations (corrected for colony size 1994/1995) were also not significant (drones: r = 0.17, p > 0.05, workers: r = –0.02, p > 0.05).
not interfere with the results of performance testing in this study. We found that colony evaluation was not affected by a potential increase in phenotypic variance due to the drifting of worker
Performance testing and drifting of honeybees
75
A
Figure 4. ∆2Varroa (see Material and Methods) and amount of drifting drones and workers (A = drones, B = workers). No significant effects were found (partial correlations corrected for colony size 1994 or 1995: ∆ 2 Varroa 1994, drones r = –0.03, p > 0.05, workers r = 0.01, p > 0.05; ∆2Varroa 1995: drones r = –0.05, p > 0.05, workers r = –0.37, p > 0.05). The figure shows the overall data for both test years. The overall partial correlations (corrected for colony size 1994/1995) were also not significant (drones: r = –0.25, p > 0.05, workers: r = –0.02, p > 0.05).
and drones. Our results are in line with the findings of other authors [23, 25, 31]. Orientation cues such as colors, which are known to reduce drifting, did not effect the honey yields of colored and non-colored colonies in one study [31]. Similarly, it has been found that apiary layouts which are known to reduce the worker drifting [22] did not affect the honey yield of colonies in the studied apiaries [23, 25]. The effects of drifting on the honey yield found by [34, 45] can be explained by: 1) a much higher amount of drifting workers [39, 45], which is affected by the apiary layout [19] and 2) the positive correlation between colony size and honey yield known from routine beekeeping experience [49]. In our study relevant worker population shifts between colonies may be reduced due to apiary layout. Therefore, we cannot exclude that higher levels of drifting workers can have a negative impact on the honey yield of colonies as suggested by others [39]. It has been shown that drifted nurse honey bees show lower levels of activity compared to nestmate workers [40]. This may provide a plausible explanation for a potential lower
B
performance of host colonies with high levels of foreign individuals regardless of the performance of the drifted individuals’ host colonies We do not find any significant correlations between the drifting of workers and drones and the phenotypic variance for levels of infestation with Varroa jacobsoni. Although the intracolonial drone population can consist of more than 80% of drifted individuals no significant interaction was found. We had no detailed knowledge about the total drone populations of our test colonies. Given colony drone populations would just consist of a small number of individuals we would expect a minor impact of the drifting of drones. However, the drifting of drones was only evaluated in strong colonies which had plenty of male sexuals by far exceeding the actual taken sample. So far, our results are consistent with [16] who found that drifting is not a particular cause of the spread of American foulbrood disease. A higher drifting of workers from colonies with higher levels of infestation with V. jacobsoni has been found [50].
76
P. Neumann et al.
Given, drones similarly show a higher drifting from highly infested colonies and may act as vectors for V. jacobsoni, one might expect an effect of the high amount of drifting drones on levels of infestation especially of neighbouring colonies. However, we found only relatively low levels of infestation in our study in both testing years. Therefore, we can not exclude that the presence of highly infested colonies at the apiary may cause evaluation biases due to drifting. In conclusion, our results indicate that if performance testing is done in apiaries where the layout reduces the level of drifting workers to an average level of less than 5% there is no significant effect on evaluating performance data of colonies. Even high levels of drifting drones which are not affected by the apiary layout seem to be a minor factor only for evaluating quantitative performance data of honeybee colonies. ACKNOWLEDGMENTS We are grateful to K. Gladasch and A. Kühl for technical assistance. We wish to thank S. Fuchs, H.R. Hepburn, P. Kryger and two anonymous referees for valuable comments on earlier versions of the manuscript. Financial support was granted by a Rhodes University Fellowship to PN and by the DFG to RFAM.
Résumé – L’évaluation des performances des colonies d’abeilles (Apis mellifera L.) n’est pas influencée dans un rucher test par la dérive des mâles et des ouvrières. L’influence de la dérive des mâles et des ouvrières sur l’évaluation des performances de colonies d’Apis mellifera carnica a été étudiée dans un rucher test à l’aide de microsatellites d’ADN. La force de la colonie, le rendement en miel et le niveau d’infestation par Varroa jacobsoni ont été déterminés sur 30 colonies possédant une reine (Tab. I). Afin d’évaluer l’influence de la dérive sur le phénotype de la colonie, on a corrigé les effets des lignées d’élevage et de la variance annuelle sur les données de performances
(formule 1). Des abeilles ont été prélevées individuellement sur les cadres externes dans le rucher test de Schwarzenau (Fig. 1) et leur génotype a été déterminé à l’aide de quatre loci de microsatellites d’ADN (n =1359 ouvrières [n = 38 colonies avec reines] et n = 449 mâles [n = 14 colonies avec reines]). Les abeilles, qui ne possédaient pas un seul allèle de la reine à l’un quelconque des loci, ont été classées comme ayant dérivé. La dérive des ouvrières a varié de 0 à 14 % (moyenne : 5 ± 0,7) ; celle des mâles de 3 à 89 % (moyenne : 50 ± 6,8) (Tab. II). L’erreur, individus ayant dérivé mais non détectés, a été calculée d’après la fréquence allélique des reines (Tab. III) et estimée à p = 0 0043 pour les mâles et p = 0,0194 pour les ouvrières. Les mâles ont dérivé significativement plus que les ouvrières (test U de Mann-Whitney p < 0,0001). On n’a trouvé aucune corrélation significative entre la dérive et la force de la colonie (Fig. 2). L’influence de la dérive des mâles et des ouvrières sur la variance phénotypique pour le rendement en miel (∆2 miel, corrélations partielles corrigées par la force de la colonie, Fig. 3) était faible et non significative. En ce qui concerne l’infestation par V. jacobsoni (∆2 Varroa, corrélations partielles corrigées par la force de la colonie, Fig. 4), l’influence n’est pas non plus significative. Nos résultats montrent que ni la faible dérive des ouvrières, due à la disposition des ruches dans le rucher test, ni la dérive élevée des mâles n’influe sur l’évaluation des performances. Apis mellifera / dérive / performance colonie / infestation / Varroa jacobsoni
Zusammenfassung – Die Erhebung von Leistungsdaten bei Honigbienenvölkern (Apis mellifera L.) wird auf einem Prüfhof nicht durch den Verflug von Drohnen und Arbeiterinnen beeinflusst. Der Einfluss des Verflugs von Drohnen und Arbeiterinnen auf die Erhebung von Leistungsdaten bei Bienenvölkern (Apis mellifera
Performance testing and drifting of honeybees
carnica) wurde mit Hilfe von DNA Microsatelliten auf einem Prüfhof ermittelt. Volksstärke, Honigertrag und Befall mit Varroa jacobsoni wurden von 30 weiselrichtigen Völkern bestimmt (Tab. I). Um den Einfluβ des Verflugs auf den Phänotyp des Volkes abzuschätzen, wurden die Effekte der Zuchtlinien und der jährlichen Varianz auf die Leistungsdaten korrigiert (Formel 1). Individuelle Bienen wurden am Prüfhof Schwarzenau (Abb. 1) von den Randwaben gesammelt und mit Hilfe von vier DNA microsatelliten Loci genotypisiert (n = 1359 Arbeiterinnen [n = 38 weiselrichtige Völker], n = 449 Drohnen [n = 14 weiselrichtige Völker]). Bienen, die nicht eines der Königinnenallele an jedem der Loci aufwiesen, wurden als verflogen klassifiziert. Der Verflug der Arbeiterinnen reichte von 0 bis 14 % mit einem Mittelwert von 5 ± 0.7%. Die Höhe des Drohnenverflugs lag zwischen 3 und 89 % mit einem Mittelwert von 50 ± 6.8 % (Tab. II). Der Fehler, verflogene Bienen nicht zu erkennen, wurde mit Hilfe der Allelfrequenzen der Königinnen berechnet (Tab. III) und betrug p = 0.0043 für Drohnen und p = 0.0194 für Arbeiterinnen. Drohnen verflogen sich signifikant häufiger als Arbeiterinnen (Mann-Whitney U-test: p < 0,0001). Es konnten keine signifikante Korrelationen zwischen der Höhe des Verflugs und der Volksstärke gefunden werden (Abb. 2). Der Einfluss des Verflugs von Drohnen und Arbeiterinnen auf die phänotypische Varianz für den Honigertrag der Völker (∆2 Honey) war ebenfalls schwach und nicht signifikant (partielle Korrelationen korrigiert für Volksstärke, Abb. 3). Der Verflug von Drohnen und Arbeiterinnen korrelierte ebenfalls nicht signifikant mit der phänotypischen Varianz von V. jacobsoni (∆2 Varroa, partielle Korrelationen korrigiert für Volksstärke, Abb. 4). Unsere Ergebnisse zeigen, dass der Verflug von Arbeiterinnen keinen signifikanten Einfluss auf die Erhebung von Leistungsdaten hat, wenn die Höhe des Verflugs aufgrund der Anordnung der Völker am Prüfstand erniedrigt ist. Der hohe Verflug von Drohnen, der nicht durch die
77
Anordnung der Völker erniedrigt wurde, hatte ebenfalls keinerlei signifikanten Einfluss auf die erhobenen Leistungsdaten. Apis mellifera / Leistung / Honigbiene / Verflug / Varroa jacobsoni REFERENCES [1]
Bayerische Landesanstalt für Bienenzucht, Leistungsprüfung 1993–1995, Prüfhof Schwarzenau, Abschluβbericht, Bayerische Landesanstalt für Bienenzucht, Erlangen 1995. [2] Boylan-Pett W., Ramsdell D.C., Hoopinggarner R.A., Hancock J.F., Honeybee foraging behaviour, in-hive survival of infectious, pollenborne blueberry leaf mottle virus and transmission of the virus in highbush blueberry, Pythopathol. 81 (1991) 1407–1412. [3] Butler C.G., The drifting of drones, Bee Wld 20 (1939) 140–142. [4] Currie RW., Some factors affecting the orientation of drone honeybees, M. Sc. thesis, University of Manitoba, 1982. [5] Currie RW., The effects of the position and apparent movement of the sun and a colony’s queen state on the orientation of drone honeybees (Apis mellifera L.) to their hives, Ph.D. thesis., University of Manitoba, 1986. [6] Currie RW., The biology and behaviour of drones, Bee Wld 68 (1987) 129–143. [7] Currie RW., Jay S.C., The influence of a colony’s queen state, time of the year, and drifting behaviour, on the acceptance and longevity of adult drone honeybees (Apis mellifera L.), J. Apic. Res. 27 (1988) 219–226. [8] Currie RW., Jay S.C., The influence of a colony’s queen state on the drifting of drone honeybees (Apis mellifera L.), Apidologie 22 (1991) 183–195. [9] Duranville C., Miniggio C., Arnold G., Borneck R., Dérive des butineuses et réinfestation des colonies d’abeilles par Varroa jacobsoni, Santé de l’Abeille 125 (1991) 228–235. [10] Estoup A., Solignac M., Harry M., Cornet J.M., Characterisation of (GT)n and (CT)n microsatellites in two insect species: Apis mellifera and Bombus terrestris, Nucl. Acid. R. 21 (1993) 1427–1431. [11] Estoup A., Solignac M., Cornuet J.M., Precise assessment of the number of patrilines and genetic relatedness in honeybee colonies, Proc. R. Soc. London B 258 (1994) 1–7. [12] Free J.B., The drifting of honeybees, J. Agric. Sci. 51 (1958) 294–306.
78
P. Neumann et al.
[13] Free J.B., Spencer Booth Y., Further experiments on the drifting of honeybees, J. Agric. Sci. 57 (1961) 153. [14] Goetze G., How much do drones drift in large apiary? Leipzig. Bienenzt. (West) 68 (1954) 223–225 (in German). [15] Goodwin R.M., Perry J.H., Brown P., American foulbrood disease. Part 3: spread, New Zealand Beekeeper 219 (1993) 7–10. [16] Goodwin R.M., Perry J.H., Houten A.T., The effect of drifting honeybees on the spread of American foulbrood infections, J. Apic. Res. 33 (1994) 209–212. [17] Hung A.C.F., Rubik W.L., Biochemical evidence of non-progeny workers in feral Africanized honeybee (Apis mellifera L.) colonies (Hymenoptera: Apidae), Bee Science 2 (1992) 33–36. [18] Jay S.C., Drifting of honeybees in commercial apiaries. I. Effect of various environmental factors, J. Apic. Res. 4 (1965) 167–175. [19] Jay S.C., Drifting of honeybees in commercial apiaries. II. Effect of various factors when hives are arranged in rows, J. Apic. Res. 5 (1966) 103–112. [20] Jay S.C., Drifting of honeybees in commercial apiaries. III. Effect of apiary layout, J. Apic. Res. 5 (1966) 137–148. [21] Jay S.C., Drifting of honeybees in commercial apiaries. IV. Further studies on the effect of apiary layout, J. Apic. Res. 7 (1968) 37–44. [22] Jay S.C., The problem of drifting in commercial apiaries, Am. Bee J. 109 (1969a) 178–179. [23] Jay SC., Drifting of honeybees in commercial apiaries. V. Effect of drifting on honey production, J. Apic. Res. 8 (1969b) 13–17. [24] Jay S.C., Sun position as a possible factor in the disorientation of honeybees (Apis mellifera) (Hymenoptera: Apidae), Can. Entomol. 103 (1971) 1111–1114. [25] Jay S.C., Dixon D., Drifting behaviour and honey production of honeybee colonies maintained on pallets, J. Apic. Res. 27 (1988) 213–218. [26] Kepena L., Beitrag zur Biologie der DrohnenBienen des Stammes “Tatranka”, 19 Int. Bienenzucht Kongr. Prag (1963) 241–242. [27] Kurrenoi M.N., Flight activity and sexual maturity of drones, Pchelovodsto 12 (1956) 24–28 (in Russian). [28] Lecomte J., Que savons-nous du comportement des faux bourdons ?, Ann. Abeille 1 (1958) 31–39. [29] Livenetz T.P., The drifting of drones, Pchelovodstvo 29 (1952) 25–30 (in Russian). [30] Matheson A., Practical beekeeping in New Zealand, Government Printing Office, Wellington, New Zealand, 1984, p. 185.
[31] Matvijenko A., Effect of coloured orientation surfaces on drifting and on honey yield, Ved. Pr. Vyzk. Ustavu. Vcelarskeho CSAZV 4 (1965) 105–112 (in Czech). [32] Moritz R.F.A., Neumann P., Genetic analysis of the drifting of drones in Apis mellifera using multilocus DNA fingerprinting, Ethology 102 (1996) 580–590. [33] Mossadegh M.S., The biology of the tracheal mite Acarapis woodi (Acari: Tarsonemidae) and role of drone honeybees in intercolony spread of the mite, in North Carolina., Sci. J. Agri. 16 (1993) 14–22 (in Arabic). [34] Nekrasov V.Y., The drifting of bees, Pchelovodsto 3 (1949) 177–184 (in Russian). [35] Neumann P., Moritz R.F.A., Van Praagh J., Queen mating-frequency in different types of honeybee mating apiaries, J. Apic. Res. 38 (1999) 11–18. [36] Neumann P., Van Praagh J., Moritz R.F.A., Dustmann J., Testing reliability of a potential honeybee island mating apiary using DNA microsatellites, Apidologie 30 (1999) 257–276. [37] Neumann P., Moritz R.F.A., Mautz D., Using DNA microsatellites for maternity testing in honeybees (Apis mellifera), Apidologie 30 (1999) 505–512. [38] Oertel E., Observations on the flight of drone honeybees, Ann. Entomol. Soc. Am. 49 (1956) 497–500. [39] Pfeiffer K.J., Crailsheim K.E., Drifting of honeybees, Insectes Soc. 45 (1998) 113–233. [40] Pfeiffer K.J., Crailsheim K.E., The behavior of drifted nurse honeybees, Insectes Soc. 46 (1999) 34–40. [41] Poltev V.L., Robbing and drifting of honeybees, Pchelovodsto 88 (1968) 42 (in Russian). [42] Rath W., Delfinado-Baker M., Drescher W., Observations on the mating behavior, sex ratio, phoresy and dispersal of Tropilaelaps clareae (Acari: Laelapidae), Int. J. Acarol. 17 (1991) 201–208. [43] Ratnieks F.L.W., Visscher P.K., Worker policing in the honeybee, Nature 342 (1989) 796–797. [44] Rauschmayer F., Das Verfliegen der Bienen und die optische Orientierung am Bienenstand, Arch. Bienenk. 9 (1928) 249–322. [45] Robinson F.A., Foraging efficiency and drift among honeybee colonies, in: Proceedings of the 4th International Symposium on Pollination, Maryland 1978 (1979). [46] Rinderer T.E., Hellmich R.L., Danka R.G., Collins A.M., Male reproductive parasitism: A factor in the Africanization of European honeybee populations, Science 228 (1985) 1119–1121. [47] Ruttner F., The life and flight activity of drones, Bee World 47 (1966) 93–100.
Performance testing and drifting of honeybees [48] Ruttner F., Naturgeschichte der Honigbienen, Ehrenwirth, München, 1992. [49] Sachs H.G., Vergleich der Honigerträge von Bienenvölkern der Carnica-Rasse bei unterschiedlicher Raumumgebung und unterschiedlicher Volksstärke, Z. Bienenforsch. 7 (1964) 47–52. [50] Sakofski F., Quantitative investigations on transfer of Varroa jacobsoni Oud, in: Ritter W.J. (Ed.), Proc. of the International Symposium on Recent Research on Bee Pathology, September 5–7, 1990, Ghent, Belgium; Rijksstation voor
[51] [52]
[53] [54]
79
Nematologie en Entomologie on behalf of Apimondia, 1991, pp. 70–72. Thyri H., [Drifting in the apiary], Tidskrift for Biavl 107 (1973) 14–16 (in Norwegian). Vollbehr J., Zur Orientierung junger Honigbienen bei ihrem ersten Orientierungsflug, Zool. Jb. Physiol. 79 (1975) 33–69. Washington R.J., Drones, Am. Bee J. 108 (1967) 7–9. Witherell P.C., Drifting of drones, Am. Bee J. (1965) 105–175.